. 2024 Feb 13;8(2):e567.
doi: 10.1002/pld3.567. eCollection 2024 Feb.

The maize striate leaves2 (sr2) gene encodes a conserved DUF3732 domain and is homologous to the rice yss1 gene

Affiliations

The maize striate leaves2 (sr2) gene encodes a conserved DUF3732 domain and is homologous to the rice yss1 gene

Meghan J Brady et al. Plant Direct. .

Abstract

Maize striate leaves2 (sr2) is a mutant that causes white stripes on leaves that has been used in mapping studies for decades though the underlying gene has not been identified. The sr2 locus has been previously mapped to small regions of normal chromosome 10 (N10) and a rearranged variant called abnormal chromosome 10 (Ab10). A comparison of assembled genomes carrying N10 and Ab10 revealed only five candidate sr2 genes. Analysis of a stock carrying the sr2 reference allele (sr2-ref) showed that one of the five genes has a transposon insertion that disrupts its protein sequence and has a severe reduction in mRNA. An independent Mutator transposon insertion in the gene (sr2-Mu) failed to complement the sr2-ref mutation, and plants homozygous for sr2-Mu showed white striped leaf margins. The sr2 gene encodes a DUF3732 protein with strong homology to a rice gene with a similar mutant phenotype called young seedling stripe1 (yss1). These and other published data suggest that sr2 may have a function in plastid gene expression.

Keywords: Zea mays; chloroplast development; comparative genomics; transposon induced mutation.


Conflict of interest statement

We have no conflicts of interest to declare.

Figures

FIGURE 1
FIGURE 1
Orthologs between the N10 and Ab10 assembly. Lines indicate orthologs between N10 and Ab10 determined by OrthoFinder (Emms & Kelly, 2019). Shades of green indicate expected orthologs, red and purple indicate unexpected orthologs that could or could not be sr2, respectively. Location of genetic markers with known physical position, o7 and w2, are shown (Udy et al., ; Wang et al., 2011). TR1 (light blue) and knob180 (bright green) are maize knob types. Trkin (dark blue) and kindr (dark green) are kinesin‐encoding genes responsible for the preferential transmission of Ab10 (Dawe et al., ; Swentowsky et al., 2020). Shared (brown) indicates the regions of known homology between Ab10 and N10. The sr2 region is where the sr2 gene has been mapped on Ab10, as defined by the breakpoints of Ab10‐Df(K) and Ab10‐Df(M) (Hiatt & Dawe, 2003b) (Figure S1). Annotated genes are indicated as blue vertical bars (Hufford et al., ; Liu et al., 2020). The plot at the bottom shows short reads from B73 (which has N10) mapped to the Ab10 reference assembly with a mapping quality greater than or equal to 20 (Hufford et al., 2021). This alignment shows the traditionally defined shared region.
FIGURE 2
FIGURE 2
Duplicated region on Ab10. Cartoon representation of the duplicated region on Ab10 identified via OrthoFinder and BLAST (Camacho et al., ; Emms & Kelly, 2019). Shaded regions between N10 and Ab10 indicate regions of homology where the hourglass shape indicates an inversion. TR1 and knob180 are maize knob types and r1 is a kernel and plant color locus marking the edge of the Ab10 haplotype. Location of genes with known physical position, o7 and w2, are shown (Udy et al., ; Wang et al., 2011). Brown squares indicate an annotated gene (Hufford et al., ; Liu et al., 2020). Green checks indicate genes that appear functional.
FIGURE 3
FIGURE 3
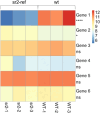
Differential expression of duplicated genes between sr2 and wild‐type plants. Gene numbers refer to those defined in Table 1. Color represents log2 transformed expression value for each gene. **** = less than 0.0001, * = less than 0.05, ns = not significant.
FIGURE 4
FIGURE 4
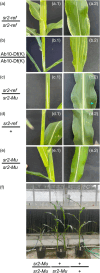
Phenotypes of sr2 mutants. (a) Homozygous sr2‐ref plant grown in the field. (b) Homozygous Ab10‐Df(K) plant grown in the greenhouse. (c) Plant heteroallelic for sr2‐ref/sr2‐Mu grown in the greenhouse. These plants typically had few small leaf margin stripes indicated by the blue arrow. (d) Plant heterozygous for +/sr2‐ref (where + is wild type) grown in the greenhouse. This plant is a sibling of the plant shown in (c). (e) Plant homozygous for sr2‐Mu grown in the greenhouse. (f) Sibling plants demonstrating the severe phenotype in sr2‐Mu/sr2‐Mu homozygous plants relative to siblings.

Similar articles

Cited by

References

    1. Anders, S. , Pyl, P. T. , & Huber, W. (2015). HTSeq‐a Python framework to work with high‐throughput sequencing data. Bioinformatics, 31, 166–169. 10.1093/bioinformatics/btu638 - DOI - PMC - PubMed
    1. Bioinformatics B (2014). FastQC. https://www.bioinformatics.babraham.ac.uk/projects/fastqc/
    1. Birky, C. W. Jr. (1983). Relaxed cellular controls and organelle heredity. Science, 222, 468–475. 10.1126/science.6353578 - DOI - PubMed
    1. Bolger, A. M. , Lohse, M. , & Usadel, B. (2014). Trimmomatic: A flexible trimmer for Illumina sequence data. Bioinformatics, 30, 2114–2120. 10.1093/bioinformatics/btu170 - DOI - PMC - PubMed
    1. Bray, N. L. , Pimentel, H. , Melsted, P. , & Pachter, L. (2016). Near‐optimal probabilistic RNA‐seq quantification. Nature Biotechnology, 34, 525–527. 10.1038/nbt.3519 - DOI - PubMed