Effects of leaf herbivory and autumn seasonality on plant secondary metabolites: A meta-analysis
- PMID: 38357594
- PMCID: PMC10864732
- DOI: 10.1002/ece3.10912
Effects of leaf herbivory and autumn seasonality on plant secondary metabolites: A meta-analysis
Abstract
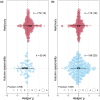
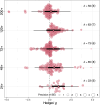
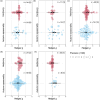
Plant secondary metabolites (PSMs) are produced by plants to overcome environmental challenges, both biotic and abiotic. We were interested in characterizing how autumn seasonality in temperate and subtropical climates affects overall PSM production in comparison to herbivory. Herbivory is commonly measured between spring to summer when plants have high resource availability and prioritize growth and reproduction. However, autumn seasonality also challenges plants as they cope with limited resources and prepare survival for winter. This suggests a potential gap in our understanding of how herbivory affects PSM production in autumn compared to spring/summer. Using meta-analysis, we recorded overall production of 22 different PSM subgroups from 58 published papers to calculate effect sizes from herbivory studies (absence to presence) and temperate to subtropical seasonal studies (summer to autumn), while considering other variables (e.g., plant type, increase in time since herbivory, temperature, and precipitation). We also compared production of five phenolic PSM subgroups - hydroxybenzoic acids, flavan-3-ols, flavonols, hydrolysable tannins, and condensed tannins. We wanted to detect a shared response across all PSMs and found that herbivory increased overall PSM production in herbaceous plants. Herbivory was also found to have a positive effect on individual PSM subgroups, such as flavonol production, while autumn seasonality was found to have a positive effect on flavan-3-ol and condensed tannin production. We discuss how these responses might stem from plants producing some PSMs constitutively, whereas others are induced only after herbivory, and how plants produce metabolites with higher costs only during seasons when other resources for growth and reproduction are less available, while other phenolic PSM subgroups serve more than one function for plants and such functions can be season dependent. The outcome of our meta-analysis is that autumn seasonality changes some PSM production differently from herbivory, and we see value in further investigating seasonality-herbivory interactions with plant chemical defense.
Keywords: autumn seasonality; flavonoids; herbivory; phenolics; plant chemical defense; plant secondary metabolites.
© 2024 The Authors. Ecology and Evolution published by John Wiley & Sons Ltd.
Conflict of interest statement
The authors have no relevant financial or non‐financial interests to disclose.
Figures


References
-
- Agerbirk, N. , Olsen, C. E. , & Nielsen, J. K. (2001). Seasonal variation in leaf glucosinolates and insect resistance in two types of Barbarea vulgaris ssp. arcuata. Phytochemistry, 58, 91–100. - PubMed
-
- Agrawal, A. A. (1998). Induced responses to herbivory and increased plant performance. Science, 279, 1201–1202. - PubMed
-
- Agrell, J. , Oleszek, W. , Stochmal, A. , Olsen, M. , & Anderson, P. (2003). Herbivore‐induced responses in alfalfa (Medicago sativa). Journal of Chemical Ecology, 29, 303–320. - PubMed
-
- Alborn, H. T. , Röse, U. S. , & McAuslane, H. J. (1996). Systemic induction of feeding deterrents in cotton plants by feeding of Spodoptera spp. larvae. Journal of Chemical Ecology, 22, 919–932. - PubMed
LinkOut - more resources
Full Text Sources
Miscellaneous

