. 2024 Apr 30;149(18):1435-1456.
doi: 10.1161/CIRCULATIONAHA.123.065143. Epub 2024 Feb 15.

Directed Differentiation of Human Induced Pluripotent Stem Cells to Heart Valve Cells

Affiliations

Directed Differentiation of Human Induced Pluripotent Stem Cells to Heart Valve Cells

Ziwen Cai et al. Circulation. .

Abstract

Background: A main obstacle in current valvular heart disease research is the lack of high-quality homogeneous functional heart valve cells. Human induced pluripotent stem cells (hiPSCs)-derived heart valve cells may help with this dilemma. However, there are no well-established protocols to induce hiPSCs to differentiate into functional heart valve cells, and the networks that mediate the differentiation have not been fully elucidated.

Methods: To generate heart valve cells from hiPSCs, we sequentially activated the Wnt, BMP4, VEGF (vascular endothelial growth factor), and NFATc1 signaling pathways using CHIR-99021, BMP4, VEGF-165, and forskolin, respectively. The transcriptional and functional similarity of hiPSC-derived heart valve cells compared with primary heart valve cells were characterized. Longitudinal single-cell RNA sequencing was used to uncover the trajectory, switch genes, pathways, and transcription factors of the differentiation.

Results: An efficient protocol was developed to induce hiPSCs to differentiate into functional hiPSC-derived valve endothelial-like cells and hiPSC-derived valve interstitial-like cells. After 6-day differentiation and CD144 magnetic bead sorting, ≈70% CD144+ cells and 30% CD144- cells were obtained. On the basis of single-cell RNA sequencing data, the CD144+ cells and CD144- cells were found to be highly similar to primary heart valve endothelial cells and primary heart valve interstitial cells in gene expression profile. Furthermore, CD144+ cells had the typical function of primary heart valve endothelial cells, including tube formation, uptake of low-density lipoprotein, generation of endothelial nitric oxide synthase, and response to shear stress. Meanwhile, CD144- cells could secret collagen and matrix metalloproteinases, and differentiate into osteogenic or adipogenic lineages like primary heart valve interstitial cells. Therefore, we identified CD144+ cells and CD144- cells as hiPSC-derived valve endothelial-like cells and hiPSC-derived valve interstitial-like cells, respectively. Using single-cell RNA sequencing analysis, we demonstrated that the trajectory of heart valve cell differentiation was consistent with embryonic valve development. We identified the main switch genes (NOTCH1, HEY1, and MEF2C), signaling pathways (TGF-β, Wnt, and NOTCH), and transcription factors (MSX1, SP5, and MECOM) that mediated the differentiation. Finally, we found that hiPSC-derived valve interstitial-like cells might derive from hiPSC-derived valve endothelial-like cells undergoing endocardial-mesenchymal transition.

Conclusions: In summary, this is the first study to report an efficient strategy to generate functional hiPSC-derived valve endothelial-like cells and hiPSC-derived valve interstitial-like cells from hiPSCs, as well as to elucidate the differentiation trajectory and transcriptional dynamics of hiPSCs differentiated into heart valve cells.

Keywords: cell differentiation; endothelial cells; heart valves; induced pluripotent stem cells; single-cell gene expression analysis.


Conflict of interest statement

Disclosures None.

Figures

Figure 1.
Figure 1.
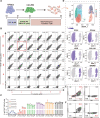
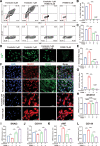
Generation of CD144+ cells and CD144 cells from hiPSCs. A, Schematic of the differentiation protocol. B, Representative flow cytometric analysis of the day 6 cells. C, Percentage of CD31+CD144+ cells on day 6 generated from various differentiation protocols (2-way ANOVA with Bonferroni post hoc test, the group of VEGF 200 ng/ml, forskolin 1 µmol/L is the control, n=3 per group). D, UMAP plots were generated using data from cells sampled on day 6 for single-cell RNA sequencing. The plots showed the key marker gene expression levels of the population. E, Representative flow cytometric analysis of cells on day 6. F, Representative flow cytometric analysis of CD144+ cells (left) and CD144 cells (right) on day 6 after CD144 magnetic beads sorting. *P<0.05, **P<0.01, ***P<0.001, and ****P<0.0001. CHIR indicates CHIR-99021; FITC, fluorescein isothiocyanate; hiCLPM, human induced pluripotent stem cell–derived cardiac lateral plate mesoderm; hiPSC, human induced pluripotent stem cells; UMAP, uniform manifold approximation and projection; and VEGF, vascular endothelial growth factor.
Figure 2.
Figure 2.
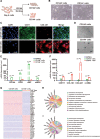
CD144+ cells are endothelial cells and CD144 cells are interstitial cells. A, Schematic of CD144 magnetic beads sorting. B, Morphology of CD144+ cells and CD144 cells. C, Immunofluorescence staining of CD144+ cells and CD144 cells for endothelial cell marker CD31 and interstitial cell marker COL1A1. D, Tube formation assay of CD144+ cells and CD144 cells. E, Reverse transcription quantitative polymerase chain reaction analysis of the expression of endothelial cells marker genes in CD144+ cells and CD144 cells (1-way ANOVA, n=4 per group). F, Reverse transcription quantitative polymerase chain reaction analysis of the expression of interstitial cell marker gene expression in CD144+ cells and CD144 cells (1-way ANOVA, n=4 per group). G, Heatmap of differentially expressed genes of CD144+ cells and CD144 cells. H, Gene Ontology chord plot of differentially expressed mRNAs in CD144+ cells. I, Gene Ontology chord plot of differentially expressed mRNAs in CD144 cells. *P<0.05, **P<0.01, *** P<0.001, and **** P<0.0001. DAPI indicates 4′,6-diamidino-2-phenylindole; eNOS, endothelial nitric oxide synthase; hiPSC, human induced pluripotent stem cells; α-SMA, α-smooth muscle actin; and vWF, von Willebrand factor.
Figure 3.
Figure 3.
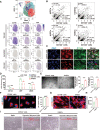
CD144+ cells are highly similar to hVECs in gene expression profile and function. A, UMAP plots showing data from CD144+ cells on day 6. The plots showed the expression levels of valvular, lymphatic, and vascular key marker genes of the population. B, Dot plot of a normalized mean expression value for each of the 37 320 genes detected in the whole single-cell RNA sequencing database in CD144+ cells versus hVECs, hCAECs, hLECs, and hAECs (Kolmogorov-Smirnov test and Pearson correlation test). C, Immunofluorescence staining of CD144+ cells for markers of valve endothelial cells, compared with hVECs. D, Reverse transcription quantitative polymerase chain reaction analysis of the expression of valve endothelial cells marker gene expression in CD144+ cells compared with hVECs (1-way ANOVA, n=3 per group). E, Tube formation assay of CD144+ cells and hVECs. Left, Representative image; right, the quantification of capillary-like structures in terms of tube length and area by ImageJ (unpaired t test, n=5 per group). F, Low-density lipoprotein (LDL) uptake assay of CD144+ cells and hVECs. Left, Representative image; right, the quantification of LDL uptake rate by ImageJ (unpaired t test, n=5 per group). G, Immunofluorescence staining of eNOS in CD144+ cells and hVECs. H, ELISA detection of the eNOS concentration in the supernatant of CD144+ cells and hVECs (unpaired t test, n=6 per group). I, The arrangement of CD144+ cells and hVECs in static and dynamic culture states. *P<0.05, **P<0.01, ***P<0.001, ****P<0.0001. DAPI indicates 4′,6-diamidino-2-phenylindole; eNOS, endothelial nitric oxide synthase; hAECs, human aortic endothelial cells; hCAECs, human coronary artery endothelial cells; hLECs, human lymphatic endothelial cells; hVECs, human primary valve endothelial cells; UMAP, uniform manifold approximation and projection; and vWF, von Willebrand factor.
Figure 4.
Figure 4.
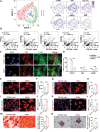
CD144 cells are highly similar to hVICs in gene expression profile and function. A, UMAP plots showing data from CD144 cells. The plots show the expression patterns of key interstitial cells marker genes. B, Dot plot of a normalized mean expression value for each of the 37 320 genes detected in the whole single-cell RNA sequencing database in CD144 cells versus hVICs, hCAFBs, hCASMCs, hAFBs, and hASMCs (Kolmogorov-Smirnov test and Pearson correlation test). C, Immunofluorescence staining of CD144 cells for markers of valve interstitial cells, compared with hVICs. D, Reverse transcription quantitative polymerase chain reaction analysis of the expression of valve interstitial cell marker genes expression in CD144 cells compared with hVICs (1-way ANOVA, n=3 per group). E, Immunofluorescence staining of COL1A1 in CD144 cells and hVICs. F, ELISA detection of the COL1A1 concentration in the supernatant of CD144 and hVICs (unpaired t test, n=6 per group). G, Immunofluorescence staining of COL3A1 in CD144 cells and hVICs. H, ELISA detection of the COL3A1 concentration in the supernatant of CD144 cells and hVICs (unpaired t test, n=6 per group). I, Immunofluorescence staining of CD144 cells and hVICs for MMP-2. J, ELISA showing the MMP-2 concentration in the supernatant of CD144 cells and hVICs (unpaired t test, n=6 per group). K, Immunofluorescence staining of CD144 cells and hVICs for MMP-9. L, ELISA showing the MMP-9 concentration in the supernatant of CD144 cells and hVICs (unpaired t test, n=6 per group). M, Alizarin red staining of mineralization nodules in CD144 cells and hVICs. Left, Representative image; Right, the quantification of percentage of Alizarin red-positive area by ImageJ (unpaired t test, n=4 per group). N, Oil red staining of lipid droplets in hiVICs and hVICs. Left, Representative image; Right, the quantification of percentage of oil red-positive area by ImageJ (unpaired t test, n=4 per group). *P<0.05, **P<0.01, ***P<0.001, ****P<0.0001. DAPI indicates 4′,6-diamidino-2-phenylindole; hAFBs, human primary aortic fibroblasts; hASMCs, human primary aortic smooth muscle cells; hCAFBs, human primary coronary artery fibroblasts; hCASMCs, human primary coronary smooth muscle cells; hiPSC, human induced pluripotent stem cells; hVICs, human primary valve interstitial cells; MMP-2, matrix metalloproteinase-2; MMP-9, matrix metalloproteinase-9; α-SMA, α-smooth muscle actin; and UMAP, uniform manifold approximation and projection;
Figure 5.
Figure 5.
Forskolin promotes the generation of hiVECs and hiVICs from hiCLPM by activating NFATc1 signaling. A, Representative flow cytometric analysis of cells on day 6 induced by 4 conditions (VEGF-165 200 ng/mL + forskolin 0 μmol/L, VEGF-165 200 ng/mL+ forskolin 1 μmol/L, VEGF-165 200 ng/mL + forskolin 1 μmol/L + FK506 10 μmol/L, VEGF-165 200 ng/mL + FK506 10 μmol/L). B, Quantification of the percentage of CD31+CD144+ cells on day 6 after treatment with 4 conditions (1-way ANOVA, n=5 per group). C, Quantification of the percentage of VIM-CD144+ cells on day 6 after treatment with the 3 conditions (1-way ANOVA, n=5 per group). D, Immunofluorescence staining of Ca2+ in day 6 cells after treatment with the 4 conditions. E, Quantification of day 6 cells Ca2+ fluorescence intensity mean value in the 4 conditions (1-way ANOVA, n=5 per group). F, Immunofluorescence staining of NAFTc1 and CD144 in day 6 cells after treatment with the 4 conditions. G, Quantification of the NFATc1 nuclear/cytoplasmic (Nuc/Cyto) ratio in the 4 conditions (1-way ANOVA, n=5 per group). H, Reverse transcription quantitative polymerase chain reaction analysis of the expression of NFATc1 in day 6 cells after treatment with the 4 conditions (1-way ANOVA, n=7 per group). I and J, Reverse transcription quantitative polymerase chain reaction analysis of the expression of SNAI2 and CDH11 in hiVECs after treatment with forskolin/FK506 (1-way ANOVA, n=4 per group). K and L, Reverse transcription quantitative polymerase chain reaction analysis of the expression of vWF and CD144 in hiVECs after treatment with forskolin/FK506 (1-way ANOVA, n=4 per group). *P<0.05, **P<0.01, ***P<0.001, and ****P<0.0001. DAPI indicates 4′,6-diamidino-2-phenylindole; hiVECs, human induced pluripotent stem cell–derived valve endothelial-like cells; and vWF, von Willebrand factor.
Figure 6.
Figure 6.
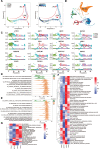
Longitudinal single-cell RNA sequencing reveals the developmental pathway of hiVECs and hiVICs from hiPSCs. A, Pseudotime trajectory of hiPSCs, hiCLPM, hiVECs, and hiVICs. The arrows show the direction of pseudotime trajectories. B, Partition-based graph abstraction plot showing the developmental path of hiVECs and hiVICs. C, Expression changes of known pluripotency markers and key markers associated with heart valve development in pseudotime trajectory. D, GeneSwitches showing function pathway changes in the pseudotime trajectory P1. E, GeneSwitches showing function pathway changes in the pseudotime trajectory P2. F, Hallmark enrichment analysis of hiPSCs, hiCLPM, hiVECs, and hiVICs. Hallmark terms are labeled with name and sorted by –log10(P) value. G, Kyoto Encyclopedia of Genes and Genomes enrichment analysis of hiPSCs, hiCLPM, hiVECs, and hiVICs. Kyoto Encyclopedia of Genes and Genomes terms are labeled with name and sorted by –log10(P) value. hiCLPM indicates human induced pluripotent stem cell–derived cardiac lateral plate mesoderm; hiPSCs, human induced pluripotent stem cells; hiVECs, human induced pluripotent stem cell–derived valve endothelial like cells; and hiVICs, human induced pluripotent stem cell–derived valve interstitial like cells.
Figure 7.
Figure 7.
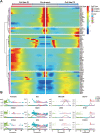
Characterization of transcription factor expression changes during the differentiation of hiVECs and hiVICs by pseudotime analysis. A, Differential transcription factors expression variance over pseudotime of hiPSCs differentiation trajectory branches. B, Spline plots showing the expression of novel transcription factors across pseudotime during hiVEC and hiVIC differentiation. hiCLPM indicates human induced pluripotent stem cell–derived cardiac lateral plate mesoderm; hiPSCs, human induced pluripotent stem cells; hiVECs, human induced pluripotent stem cell–derived valve endothelial-like cells; and hiVICs, human induced pluripotent stem cell–derived valve interstitial-like cells.
Figure 8.
Figure 8.
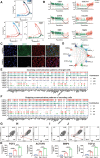
hiVICs may be derived from hiVECs undergoing EndoMT. A, Pseudotime trajectory of hiVECs and hiVICs. The arrows show the direction of the pseudotime trajectory. B, Expression changes of valve endothelial markers and valve interstitial markers in the pseudotime trajectory. C, Immunofluorescence staining of CD31 and VIM in hiVECs and hiVICs. D, Communication patterns between hiVECs and hiVICs. E, Incoming communication patterns of hiVECs and hiVICs. F, Outgoing communication patterns of hiVECs and hiVICs. G, Representative flow cytometric analysis of day 5 CD144+ cells after CD144 magnetic beads sorting. H, Representative flow cytometric analysis of day 5 CD144+ cells after 2 days culture with heart valve cells differentiation medium. I, Representative flow cytometric analysis of day 6 CD144+ cells after CD144 magnetic beads sorting. J, Representative flow cytometric analysis of day 6 CD144+ cells after 2-day culture with heart valve cells differentiation medium. K, ELISA showing the FGF2, Activin, BMP4, and TGF-β concentrations in the supernatant of day 5 cells and day 6 cells compared with heart valve cell differentiation medium (1-way ANOVA, n=6 per group). ****P<0.0001. BMP indicates bone morphogenetic protein; FGF2, fibroblast growth factor 2; TGF-β, transforming growth factor β; CON, concentration; DAPI, 4′,6-diamidino-2-phenylindole; hiVECs, human induced pluripotent stem cell–derived valve endothelial-like cells; and hiVICs, human induced pluripotent stem cell–derived valve interstitial like cells.

Comment in

References

    1. Yadgir S, Johnson CO, Aboyans V, Adebayo OM, Adedoyin RA, Afarideh M, Alahdab F, Alashi A, Alipour V, Arabloo J, et al. ; Global Burden of Disease Study 2017 Nonrheumatic Valve Disease Collaborators. Global, regional, and national burden of calcific aortic valve and degenerative mitral valve diseases, 1990–2017. Circulation. 2020;141:1670–1680. doi: 10.1161/CIRCULATIONAHA.119.043391 - PubMed
    1. Coffey S, Cox B, Williams MJ. Lack of progress in valvular heart disease in the pre-transcatheter aortic valve replacement era: increasing deaths and minimal change in mortality rate over the past three decades. Am Heart J. 2014;167:562–567.e2. doi: 10.1016/j.ahj.2013.12.030 - PubMed
    1. Chen J, Li W, Xiang M. Burden of valvular heart disease, 1990–2017: Results from the Global Burden of Disease Study 2017. J Glob Health. 2020;10:020404. doi: 10.7189/jogh.10.020404 - PMC - PubMed
    1. Coffey S, Roberts-Thomson R, Brown A, Carapetis J, Chen M, Enriquez-Sarano M, Zühlke L, Prendergast BD. Global epidemiology of valvular heart disease. Nat Rev Cardiol. 2021;18:853–864. doi: 10.1038/s41569-021-00570-z - PubMed
    1. Tsao CW, Aday AW, Almarzooq ZI, Alonso A, Beaton AZ, Bittencourt MS, Boehme AK, Buxton AE, Carson AP, Commodore-Mensah Y, et al. . Heart disease and stroke statistics-2022 update: a report from the American Heart Association. Circulation. 2022;145:e153–e639. doi: 10.1161/CIR.0000000000001052 - PubMed

Publication types

MeSH terms