. 2024 Apr;11(15):e2307040.
doi: 10.1002/advs.202307040. Epub 2024 Feb 15.

Loss of Endothelial Annexin A1 Aggravates Inflammation-Induched Vascular Aging

Affiliations

Loss of Endothelial Annexin A1 Aggravates Inflammation-Induched Vascular Aging

Qinyi You et al. Adv Sci (Weinh). 2024 Apr.

Abstract

Chronic inflammation is increasingly considered as the most important component of vascular aging, contributing to the progression of age-related cardiovascular diseases. To delay the process of vascular aging, anti-inflammation may be an effective measure. The anti-inflammatory factor annexin A1 (ANXA1) is shown to participate in several age-related diseases; however, its function during vascular aging remains unclear. Here, an ANXA1 knockout (ANXA1-/-) and an endothelial cell-specific ANXA1 deletion mouse (ANXA1△EC) model are used to investigate the role of ANXA1 in vascular aging. ANXA1 depletion exacerbates vascular remodeling and dysfunction while upregulates age- and inflammation-related protein expression. Conversely, Ac2-26 (a mimetic peptide of ANXA1) supplementation reverses this phenomenon. Furthermore, long-term tumor necrosis factor-alpha (TNF-α) induction of human umbilical vein endothelial cells (HUVECs) increases cell senescence. Finally, the senescence-associated secretory phenotype and senescence-related protein expression, rates of senescence-β-galactosidase positivity, cell cycle arrest, cell migration, and tube formation ability are observed in both ANXA1-knockdown HUVECs and overexpressed ANXA1-TNF-α induced senescent HUVECs. They also explore the impact of formyl peptide receptor 2 (a receptor of ANXA1) in an ANXA1 overexpression inflammatory model. These data provide compelling evidence that age-related inflammation in arteries contributes to senescent endothelial cells that promote vascular aging.

Keywords: annexin A1; endothelial cell; inflammaging; vascular aging.


Conflict of interest statement

The authors declare no conflict of interest.

Figures

Figure 1
Figure 1
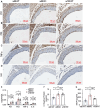
Age‐associated decreases in ANXA1 levels in both humans and mice. A) The level of ANXA1 in serum collected from elderly people (>65 years old, n = 43) was significantly lower than that in serum collected from young people (18–44 years old, n = 42) or middle‐aged people (45–64 years old, n = 48). B) The serum ANXA1 level was negatively correlated with age in humans (n = 133). C) The serum level of ANXA1 in mice (n = 6 mice per group) was significantly decreased with increasing age. D,E) The serum ANXA1 level was negatively correlated with age and the PWV in mice (n = 24). F,G) Representative images of ANXA1 immunohistochemical staining in aortas from 26‐ and 86‐week‐old mice (n = 6). Bars = 100 and 20 µm, respectively. The zoomed‐in views showed age‐associated decreased ANXA1 expression in mouse aortas. H,I) Western blotting of mouse aortas showed that ANXA1 expression was decreased in 26‐ and 86‐week‐old mice (n = 6). J) Aortas from 26‐ and 86‐week‐old mice were subjected to immunofluorescence staining for ANXA1; representative images are shown (n = 6). The arrows show that the decrease in ANXA1 expression was manifested mainly in the vascular endothelium. Bars = 50 µm. Lu, lumen. The data are presented as the means ± SEMs (G,I) and means ± SDs (A,C). The Kruskal–Wallis test (A), one‐way ANOVA (C), and Mann–Whitney U test (G,I) were used to compare the data. * p < 0.05, ** p < 0.01, *** p < 0.001, **** p < 0.0001; p > 0.05 is not indicated. Correlations were determined by Spearman (B) and Pearson correlation analyses (D,E).
Figure 2
Figure 2
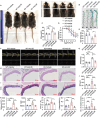
Age‐related alterations in the aorta aggravates in ANXA1 KO mice. A) Reduced lifespan was observed in ANXA1 KO mice, as determined by Kaplan–Meier survival analysis (n = 6). B) The PP was elevated in 68‐week‐old (w68) KO mice as well as 100‐week‐old (w100) WT mice compared to w68 WT mice (n = 8). C,D) ACH‐induced endothelium‐dependent relaxation of thoracic aortic rings was reduced in both w68 KO mice and w100 WT mice (n = 6). E) SA‐β‐gal staining of the aorta showed a larger positive area in w68 KO mice and w100 WT mice (n = 6). F,G) The aortic PWV was higher than that in w100 WT mice (n = 6). H–N) w68 KO mice and w100 WT mice showed enlargement of the lumen and thickening of the aortic intima and media compared to w68 WT mice. The data also showed increases in collagen deposition and elastin breaks in both w68 KO mice and w100 WT mice. Vascular remodeling indicators, such as the MT, MA, LD, collagen area/MA, and number of elastin breaks, were analyzed by HE staining and VVG staining of mouse aortas. Bars = 100 µm. The data are presented as the means ± SEMs (B,F) and means ± SDs (A,D,J–N). Kaplan–Meier survival analysis (A), one‐way ANOVA followed by the Bonferroni post hoc test (B,D,F,J–N), and multiple repeated measures ANOVA followed by the Bonferroni post hoc test (C) were used for the analyses. *p < 0.05, **p < 0.01, ***p < 0.001, ****p < 0.0001. ns, p > 0.05.
Figure 3
Figure 3
Inflammaging‐related protein elevates in 68‐week‐old ANXA1 KO mice. A–E) w68 KO mice, as well as w100 WT mice, showed higher expression of senescence indicators, such as P21 and P53, and inflammatory cytokines, such as TNF‐α and IL‐6, than control mice. Expression levels were measured by immunohistochemical staining (n = 6). Bars = 100 µm. F,G) CRP (n = 8) and MCP1 (n = 6) levels were elevated in the serum of w68 KO and w100 WT mice compared to those in the serum of w68 WT mice. The data are presented as the means ±SEMs (F,G) and means ± SDs (E). One‐way ANOVA followed by the Bonferroni post hoc test (E–G) was used for the analyses. *p < 0.05, **p < 0.01, ***p < 0.001, ****p < 0.0001. ns, p > 0.05.
Figure 4
Figure 4
Treatment with Ac2‐26 alleviates the aging process in ANXA1 KO mice. A) Ac2‐26 treatment improved the appearance of ANXA1 KO mice. B) The area of positive SA‐β‐gal staining in the aorta was reduced in ANXA1 KO mice treated with Ac2‐26 (n = 6). C) The PP in ANXA1 KO mice was reduced by Ac2‐26 treatment (n = 6). D,E) ACH‐induced endothelium‐dependent relaxation of thoracic aortic rings was rescued by Ac2‐26 treatment in KO mice. Maximum relaxation induced by ACH (n = 6). F,G) The decreased PWV indicated that the degree of aortic stiffness was decreased with the Ac2‐26 treatment compared to that in the ANXA1 KO group (n = 8). H–K) Collagen accumulation and elastin breaks were also improved by Ac2‐26 with HE staining and VVG staining. Enlargement of the lumen, intima‐media thickening, collagen accumulation, and breaks in elastin were improved after Ac2‐26 treatment in KO mice. The data are presented as the means ±SEMs (C,G) and means ±SDs (D,E,J,K). Two‐way ANOVA followed by the Bonferroni post hoc test (C,E,G,J,K) and multiple repeated measures ANOVA followed by the Bonferroni post hoc test (D) were used for the analyses. Bars = 100 µm. *p < 0.05, **p < 0.01, ***p < 0.001, ****p < 0.0001. ns, p > 0.05.
Figure 5
Figure 5
Treatment with Ac2‐26 alleviates inflammaging in ANXA1 KO mice. A–H) The expression of P21 and P53 and SASP factors, such as TNF‐α and IL‐6, was reduced with Ac2‐26 treatment in KO mice, as shown by immunohistochemical staining (n = 6). The data are presented as the means ±SDs (E–H). Two‐ way ANOVA followed by the Bonferroni post hoc test (E–H) was used for the analyses. *p < 0.05, **p < 0.01, ***p < 0.001, ****p < 0.0001. ns, p > 0.05.
Figure 6
Figure 6
Age‐related alterations and inflammatory factors in the aorta aggravate in ANXA1△EC mice. A) Identification of ANXA1△EC mice aorta with immunofluorescence for ANXA1; representative images are shown (n = 6). Green represents CD31 and red represents ANXA1 with blue for the nucleus. Bars = 50 µm. B) SA‐β‐gal staining of the aorta showed a larger positive area in the endothelium of ANXA1△EC mice (n = 6). C) The PP was elevated in ANXA1△EC mice compared to ANXA1fl/fl mice (n = 6). D,E) ACH‐induced endothelium‐dependent relaxation of thoracic aortic rings was reduced in ANXA1△EC mice (n = 6). F,G) The aortic PWV was higher than that in ANXA1△EC mice (n = 6). H) The expression of inflammation‐related cytokines, such as Complement component 5a (C5a), Granulocyte colony‐stimulating factor (G‐CSF), Intercellular cell adhesion molecule‐1 (ICAM‐1), Interferon‐γ(IFN‐γ), IL‐1α, IL‐1β, IL‐1ra, IL‐3, IL‐16, IL‐17, IL‐27, C‐X‐C motif chemokine ligand‐10 (CXCL10), Macrophage colony‐stimulating factor (M‐CSF), Monocyte chemoattractant protein‐1 (MCP1), CXCL9, CCL5, CXCL12, TNF‐α, and Human myeloid cell trigger receptor‐1 (TREM‐1) were increased in ANXA1△EC mice group, as shown by proteome profiler mouse cytokine array kit (n = 6). I–P) ANXA1△EC mice showed enlargement of the lumen and thickening of the aortic intima and media compared to w68 WT mice. The data also showed increases in collagen deposition and elastin breaks in ANXA1△EC mice. Vascular remodeling indicators, such as the MT, MA, LD, MT/LD, collagen area/MA, and number of elastin breaks, were analyzed by HE staining and VVG staining of mouse aortas. Bars = 200 µm. The data are presented as the means ± SEMs (C,F,H) and means ± SDs (E,F,K–P). Two‐tailed unpaired Student's t‐test (C,E,F,H,K–P), and multiple repeated measures ANOVA followed by the Bonferroni post hoc test (D) were used for the analyses. *p < 0.05, **p < 0.01, ***p < 0.001, ****p < 0.0001. ns, p > 0.05.
Figure 7
Figure 7
TNF‐α induces senescence and replicative senescence in HUVEC. A) Representative images of ANXA1 and ANXA1 downregulation in the TNF‐α group obtained by semiquantitative western blot analysis (n = 4). B) The mRNA expression of ANXA1 was decreased in the TNF‐α group, as semiquantitatively determined by qRT‐PCR (n = 4). C) Representative immunofluorescence images showing a decline in ANXA1 expression in the TNF‐α‐induced endothelial senescence group. Bars = 100 µm. D,E) Representative images of SA‐β‐gal staining. The higher number of positive‐stained (blue) cells indicated that cellular senescence was increased in the TNF‐α group (n = 3). Bars = 100 µm. F,G) Representative images of SA‐β‐gal staining in HUVECs at different passages. Young HUVECs, passage 7; old HUVECs, passage 25. Positive cells were stained blue and quantified (n = 4). The number of positive cells was obviously increased in the old HUVECs group. Bars = 100 µm. H,I) Representative western blot images and semiquantitative analysis of ANXA1 expression showed a decline in ANXA1 expression in the replicative senescence model (n = 3). Young HUVECs and old HUVECs are denoted as described above. J–R) The protein levels of P21, γH2AX, P16, NF‐κB, and VCAM‐1 were elevated in the TNF‐α‐induced endothelial senescence group (n = 4‐7). S) The mRNA transcript levels of P21, P53, and P16 (n = 3) were elevated in the TNF‐α group. The data are presented as the means ±SEMs. Two‐tailed unpaired Student's t‐test (A,B,E,F,I,N,S) was used for the analyses. *p < 0.05, **p < 0.01, ***p < 0.001, ****p < 0.0001. ns, p > 0.05.
Figure 8
Figure 8
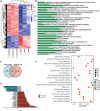
RNA sequencing reveals that knockdown of ANXA1 leads to a senescence phenotype in HUVECs. A) DEG clusters in the sh‐NC and sh‐ANXA1 groups are shown in a heatmap. B) Top 30 enriched GO terms. C) Intersection of genes from the Aging Atlas and DEGs identified by our RNA sequencing analysis. D) Overlapping age‐associated genes are shown with respect to upregulated terms and downregulated terms. E) KEGG enrichment analysis revealed that ANXA1 knockdown was correlated with the cell senescence pathway.
Figure 9
Figure 9
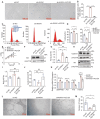
Inflammaging in ANXA1 knockdown HUVECs is reversed by Ac2‐26 treatment. A,B) Representative photographs of SA‐β‐gal staining demonstrating that Ac2‐26 can attenuate senescence in HUVECs (n = 3). C,D) G0/G1 arrest was reversed by Ac2‐26 treatment, as determined by flow cytometric analysis (n = 3). E) Cumulative population doubling level (CPDL) of the three groups. F,G) Representative western blot images showing that the expression of P21 was reduced by Ac2‐26 treatment (n = 3). H–J) Representative western blot images showing that the expression of Rb and Cyclin E1 were reduced by Ac2‐26 treatment (n = 3). K) mRNA transcript levels of SERPINE1, P21, P16, and SASP as the TGFβ2 level decreased with Ac2‐26 treatment, as quantified by qRT‐PCR (n = 3). L,M) Representative images of the tube formation assay. The number of tubes formed by HUVECs was restored by Ac2‐26 treatment (n = 5). The data are presented as the means ±SEMs (B,D,E,G,I,J,K) and means ±SDs (M). One‐way ANOVA followed by the Bonferroni post hoc test (B,D,E,G,I,J,K) was used for the analyses. Bars = 200 µm. *p < 0.05, **p < 0.01, ***p < 0.001, ****p < 0.0001. ns, p > 0.05.
Figure 10
Figure 10
Overexpression of ANXA1 in HUVECs indicates that ANXA1 may exert an anti‐inflammaging effect through its receptor: A,C) Representative photographs of SA‐β‐gal staining and quantification of the positive area indicated that overexpression of ANXA1 in HUVECs reversed TNF‐α‐induced senescence, while treatment with an inhibitor of its receptor FPR2 (WRW4) abolished this beneficial effect (n = 3). Bars = 200 µm. B,D) Alleviation of cell cycle arrest was observed in the ANXA1 overexpression group by flow cytometry (n = 3). F–J) Representative western blot images showing that the expression levels of P21, P16, VCAM‐1, ICAM‐1, and ANXA1 were significantly decreased in the ANXA1 overexpression treating with TNF‐α group (n = 3). The data are presented as the means ±SEMs. One‐way ANOVA followed by the Bonferroni post hoc test (C,D,F–J) was used for the analyses. *p < 0.05, **p < 0.01, ***p < 0.001, ****p < 0.0001. ns, p > 0.05.

References

    1. Biwas I., Rezaie A., Aging 2018, 10, 3634. - PMC - PubMed
    1. Dantas A. P., Jimenez‐Altayo F., Vila E., Front. Physiol. 2012, 3, 325. - PMC - PubMed
    1. Zhang C., Tao J., S. o. G. C. M. A. Cardiovascular Group , Aging. Med. (Milton) 2018, 1, 228. - PMC - PubMed
    1. Ungvari Z., Tarantini S., Donato A. J., Galvan V., Csiszar A., Circ. Res. 2018, 123, 849. - PMC - PubMed
    1. Ke Y., Li D., Zhao M., Liu C., Liu J., Zeng A., Shi X., Cheng S., Pan B., Zheng L., Hong H., Free Radical Biol. Med. 2018, 116, 88. - PubMed

LinkOut - more resources