

From the outer space to the inner cell: deconvoluting the complexity of Bacillus subtilis disulfide stress responses by redox state and absolute abundance quantification of extracellular, membrane, and cytosolic proteins
- PMID: 38358275
- PMCID: PMC10986503
- DOI: 10.1128/spectrum.02616-23
From the outer space to the inner cell: deconvoluting the complexity of Bacillus subtilis disulfide stress responses by redox state and absolute abundance quantification of extracellular, membrane, and cytosolic proteins
Abstract
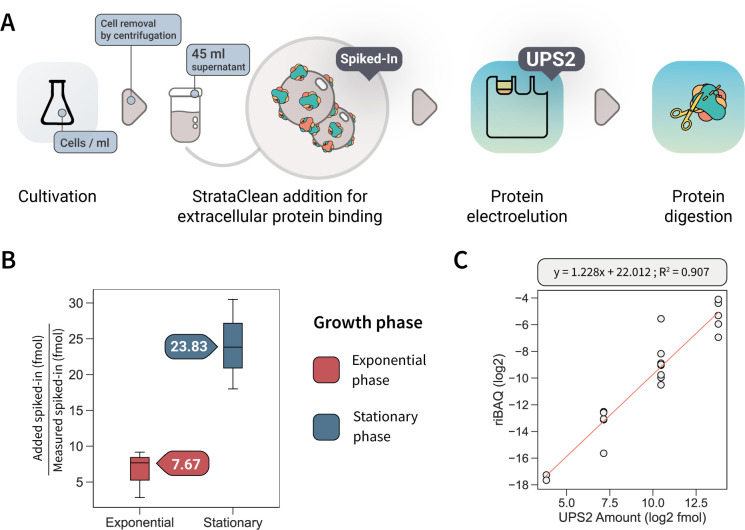
Understanding cellular mechanisms of stress management relies on omics data as a valuable resource. However, the lack of absolute quantitative data on protein abundances remains a significant limitation, particularly when comparing protein abundances across different cell compartments. In this study, we aimed to gain deeper insights into the proteomic responses of the Gram-positive model bacterium Bacillus subtilis to disulfide stress. We determined proteome-wide absolute abundances, focusing on different sub-cellular locations (cytosol and membrane) as well as the extracellular medium, and combined these data with redox state determination. To quantify secreted proteins in the culture medium, we developed a simple and straightforward protocol for the absolute quantification of extracellular proteins in bacteria. We concentrated extracellular proteins, which are highly diluted in the medium, using StrataClean beads along with a set of standard proteins to determine the extent of the concentration step. The resulting data set provides new insights into protein abundances in different sub-cellular compartments and the extracellular medium, along with a comprehensive proteome-wide redox state determination. Our study offers a quantitative understanding of disulfide stress management, protein production, and secretion in B. subtilis.
Importance: Stress responses play a crucial role in bacterial survival and adaptation. The ability to quantitatively measure protein abundances and redox states in different cellular compartments and the extracellular environment is essential for understanding stress management mechanisms. In this study, we addressed the knowledge gap regarding absolute quantification of extracellular proteins and compared protein concentrations in various sub-cellular locations and in the extracellular medium under disulfide stress conditions. Our findings provide valuable insights into the protein production and secretion dynamics of B. subtilis, shedding light on its stress response strategies. Furthermore, the developed protocol for absolute quantification of extracellular proteins in bacteria presents a practical and efficient approach for future studies in the field. Overall, this research contributes to the quantitative understanding of stress management mechanisms and protein dynamics in B. subtilis, which can be used to enhance bacterial stress tolerance and protein-based biotechnological applications.
Keywords: Bacillus subtilis; absolute protein quantification; disulfide stress; redox proteomics; subcellular fractionation.
Conflict of interest statement
The authors declare no conflict of interest.
Figures
Similar articles
-
Systems-wide temporal proteomic profiling in glucose-starved Bacillus subtilis.Nat Commun. 2010;1:137. doi: 10.1038/ncomms1137. Nat Commun. 2010. PMID: 21266987 Free PMC article.
-
Comprehensive absolute quantification of the cytosolic proteome of Bacillus subtilis by data independent, parallel fragmentation in liquid chromatography/mass spectrometry (LC/MS(E)).Mol Cell Proteomics. 2014 Apr;13(4):1008-19. doi: 10.1074/mcp.M113.032631. Epub 2014 Jan 31. Mol Cell Proteomics. 2014. PMID: 24696501 Free PMC article.
-
Ariadne's Thread in the Analytical Labyrinth of Membrane Proteins: Integration of Targeted and Shotgun Proteomics for Global Absolute Quantification of Membrane Proteins.Anal Chem. 2019 Sep 17;91(18):11972-11980. doi: 10.1021/acs.analchem.9b02869. Epub 2019 Sep 3. Anal Chem. 2019. PMID: 31424929
-
A proteomic view of cell physiology of Bacillus subtilis--bringing the genome sequence to life.Adv Biochem Eng Biotechnol. 2003;83:57-92. doi: 10.1007/3-540-36459-5_3. Adv Biochem Eng Biotechnol. 2003. PMID: 12934926 Review.
-
Proteomics of protein secretion by Bacillus subtilis: separating the "secrets" of the secretome.Microbiol Mol Biol Rev. 2004 Jun;68(2):207-33. doi: 10.1128/MMBR.68.2.207-233.2004. Microbiol Mol Biol Rev. 2004. PMID: 15187182 Free PMC article. Review.
Cited by
-
Alpaca. A Simplified and Reproducible Python-Based Pipeline for Absolute Proteome Quantification Data Mining.Proteomics. 2025 May;25(9-10):e202400417. doi: 10.1002/pmic.202400417. Epub 2025 Apr 26. Proteomics. 2025. PMID: 40285550 Free PMC article.
References
-
- Mori M, Zhang Z, Banaei-Esfahani A, Lalanne J-B, Okano H, Collins BC, Schmidt A, Schubert OT, Lee D-S, Li G-W, Aebersold R, Hwa T, Ludwig C. 2021. From coarse to fine: the absolute Escherichia coli proteome under diverse growth conditions. Mol Syst Biol 17:e9536. doi:10.15252/msb.20209536 - DOI - PMC - PubMed
MeSH terms
Substances
Grants and funding
LinkOut - more resources
Full Text Sources
Miscellaneous
