. 2024 May 6;223(5):e202304042.
doi: 10.1083/jcb.202304042. Epub 2024 Feb 15.

VPS13C regulates phospho-Rab10-mediated lysosomal function in human dopaminergic neurons

Affiliations

VPS13C regulates phospho-Rab10-mediated lysosomal function in human dopaminergic neurons

Leonie F Schrӧder et al. J Cell Biol. .

Abstract

Loss-of-function mutations in VPS13C are linked to early-onset Parkinson's disease (PD). While VPS13C has been previously studied in non-neuronal cells, the neuronal role of VPS13C in disease-relevant human dopaminergic neurons has not been elucidated. Using live-cell microscopy, we investigated the role of VPS13C in regulating lysosomal dynamics and function in human iPSC-derived dopaminergic neurons. Loss of VPS13C in dopaminergic neurons disrupts lysosomal morphology and dynamics with increased inter-lysosomal contacts, leading to impaired lysosomal motility and cellular distribution, as well as defective lysosomal hydrolytic activity and acidification. We identified Rab10 as a phospho-dependent interactor of VPS13C on lysosomes and observed a decreased phospho-Rab10-mediated lysosomal stress response upon loss of VPS13C. These findings highlight an important role of VPS13C in regulating lysosomal homeostasis in human dopaminergic neurons and suggest that disruptions in Rab10-mediated lysosomal stress response contribute to disease pathogenesis in VPS13C-linked PD.


Conflict of interest statement

Disclosures: D. Krainc is the founder and scientific advisory board chair of Vanqua Bio; serves on the scientific advisory boards of The Silverstein Foundation, Intellia Therapeutics, and AcureX Therapeutics; and is a venture partner at OrbiMed. No other disclosures were reported.

Figures

Figure 1.
Figure 1.
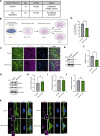
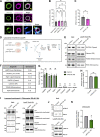
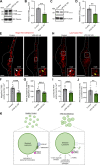
Loss of VPS13C disrupts lysosomal morphology in hiPSC-derived dopaminergic neurons. (A and B) Representative immunoblot and quantification of VPS13C KD efficiency in hiPSC-derived dopaminergic neurons (day 70) after 14 days of treatment with control and VPS13C shRNA. (C) Representative live-cell confocal images of LAMP1-mGFP (green) -positive vesicles in control (upper) and VPS13C KD (lower) neurons with insets showing smaller lysosomes (white arrow) in control condition versus enlarged lysosomes (yellow arrow) in VPS13C KD condition. Dashed line represents the outline of the cell (scale bar: 10 µm, inset: 1 µm). (D) Quantification of the percentage of cell area occupied by lysosomes from LAMP1-mGFP live-cell confocal imaging (N = 4, from n = 15 cells). (E and F) Quantification and histogram distribution of average lysosomal size in control and VPS13C KD dopaminergic neurons (N = 4, from n = 15 cells). (G) Representative images of PFA-fixed dopaminergic neurons with LAMP1-mGFP expression (green) and co-staining with TH (magenta) and DAPI (blue), with insets showing smaller lysosomes in control condition (upper panel, white arrow) and enlarged clustered lysosomes in VPS13C KD neurons (lower panel, yellow arrow) (scale bar: 10 µm, inset: 1 µm). Data are represented as mean ± SEM; unpaired two-tailed t test (B, D, and E); *P < 0.05 (D), ****P < 0.0001 (B and E). Source data are available for this figure: SourceData F1.
Figure S1.
Figure S1.
Characterization of hiPSC-derived dopaminergic neurons in control and VPS13C KD condition. (A) Table with information on the hiPSC lines obtained from Northwestern University Biorepository and Coriell Institute. (B) Schematic of the differentiation process from hiPSCs to dopaminergic neurons and treatment with lentiviral shRNA (14 days) for a non-targeting control and shRNA specifically targeting VPS13C at day 56 with MOI 2. Neurons were harvested on day 70 for the assessment of VPS13C KD efficiency and downstream readouts. Schematic was generated with http://BioRender.com. (C) Representative confocal images from fixed iPSC-derived dopaminergic control and VPS13C KD neurons showing immunostaining of TH (green), βIII-tubulin (magenta), and DAPI (blue) (scale bar: 20 µm). (D) Quantification of the percentage of TH-positive neurons (N = 3). (E and F) (E) Representative immunoblot of TH protein levels in control and VPS13C KD neurons and (F) relative quantification of TH levels. (G–J) Representative immunoblots and relative quantifications of neuronal synaptic marker VMAT2 (* unspecific protein band), neuronal marker βIII-tubulin, and GAPDH with relative quantifications (N = 3). (K) Representative confocal images of immunostaining for endogenous LAMP1 (magenta), TH (green), and DAPI (blue) in control neurons showing smaller LAMP1-positive vesicles (white arrow) in comparison to VPS13C KD neurons showing enlarged and clustered LAMP1-positive vesicles (yellow arrow) (D70) (scale bar: 10 µm, inset: 1 µm). Data represented as mean ± SEM; unpaired two-tailed t test (D, F, H, I, and J); ns: not significant (H, I, and J), *P < 0.05 (D and F). Source data are available for this figure: SourceData FS1.
Figure 2.
Figure 2.
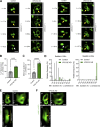
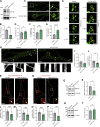
VPS13C deficiency disrupts inter-lysosomal contacts in hiPSC-derived dopaminergic neurons. (A) Time-lapse images of L-L contacts showing tethered lysosomes (yellow arrows) that untether at 42 and 29 s, respectively (white arrows), in control conditions but remain tethered in VPS13C KD neurons until 129 and 147 s, respectively. The majority of lysosomes in VPS13C KD neurons stay in contact until 180 s. Scale bar: 1 µm. (B) Quantification of the percentage of lysosomes in stable L-L contacts (≥10 s). (C and D) Quantification and histogram distribution of the minimum duration of L-L contacts. (N = 4, from n = 12 cells). (E and F) Representative 3D confocal images of L-L contacts in control neurons (E) and VPS13C KD neurons (F). Yellow arrows indicate the point of contact between two lysosomes in xy, yz, and xz projection (scale bar: 0.5 µm). Data represented as mean ± SEM; unpaired two-tailed t test (B and C); ****P < 0.0001 (B and C).
Figure S2.
Figure S2.
VPS13C deficiency alters ER-lysosome and mitochondria-lysosome contact sites in iPSC-derived dopaminergic neurons. (A and B) Representative live-cell confocal images showing lysosome-ER contact sites in control (A) and VPS13C KD (B) dopaminergic neurons expressing LAMP1-mGFP (green) and Halo-KDEL (gray) (scale bar: 10 µm, inset: 1 µm). (C) Quantification of the percentage of stable ER-lysosome contacts (≥10 s) (N = 4, from n = 15 cells). (D and E) Quantification and histogram distribution of the minimum duration of ER-lysosome contacts (N = 4, from n = 15 cells). (F) Quantification of the percentage of cell area occupied by ER (N = 4, from n = 15 cells). (G) Representative time-lapse confocal images showing mitochondria-lysosome contact sites in iPSC-derived dopaminergic neurons expressing LAMP1-mGFP (green) and mAppleTOMM20 (gray). Tethered mitochondria with lysosomes (yellow arrow) untether at 59 and 56 s, respectively, in control conditions (white arrow) but remain tethered in VPS13C KD neurons (yellow arrow) until 153 and 135 s, respectively (scale bar: 1 µm). (H) Quantification of the percentage of stable mitochondria-lysosome contacts (≥10 s) (N = 4, from n = 15 cells). (I) Quantification of the minimum contact duration of mitochondria-lysosome (M-L) contacts (N = 4, from n = 15 cells). Data represented as mean ± SEM; unpaired two-tailed t test (C, D, F, H, and I); ns: not significant (D and F), **P < 0.01 (C and H), ****P < 0.0001 (I).
Figure 3.
Figure 3.
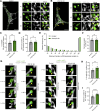
Increased lysosomal tethering affects lysosomal motility and distribution in VPS13C-deficient dopaminergic neurons. (A and B) Representative live-cell confocal images from control (A; Video 1) and VPS13C KD (B; Video 2) neurons showing LAMP1-positive vesicles (green, upper panel) and lysosomal motility demonstrated by kymographs (bottom panels). Dashed line represents the outline of the cell. Scale bar: 10 µm, kymograph scale bar: x = 1 µm, y = 20 s. (C–E) Quantification of the average distance traveled by lysosomes in 60 s and quantification of the average lysosomal motility with histogram distribution. N = 4, from n = 11 cells (control) and n = 13 cells (VPS13C KD). (F) Histogram distribution of the average lysosomal distance to the nucleus. N = 4, from n = 15 cells (control) and n = 18 cells (VPS13C KD). (G) Quantification of the percentage of lysosomes in the perinuclear region (<7 µm distance from nuclear membrane). (H) Quantification of distal lysosomes (≥7 µm distance from nuclear membrane). Data represented as mean ± SEM; unpaired two-tailed t test (C, D, G, and H); *P < 0.05 (D, G, and H), **P < 0.01 (C).
Figure 4.
Figure 4.
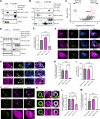
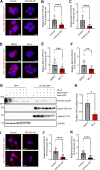
VPS13C interacts with Rab10 in a phospho-dependent manner on the lysosomal membrane. (A) Representative immunoblot of immunoprecipitated VPS13C-Myc and co-immunoprecipitated Rab10-GFP (N = 4). (B) Representative immunoblot of immunoprecipitated Rab10-GFP and co-immunoprecipitated VPS13C-Myc and endogenous VPS13C (N = 1). (C) Volcano plot of AP-MS data comparing interactors of phosphomimetic Rab10-T73E versus phosphodeficient Rab10-T73A (significant hits shown in magenta), highlighting previously confirmed interaction partners GDI1/2 show higher affinity for phosphodeficient Rab10-T73A, and newly identified interactor VPS13C show higher affinity for phosphomimetic Rab10-T73E (N = 3) (Data S1). (D and E) Confirmation of phospho-dependent interaction of Rab10-GFP and endogenous VPS13C via co-IP. Representative immunoblot of immunoprecipitated Rab10-GFP variants (WT, T73E, T73A) and co-immunoprecipitated endogenous VPS13C with (E) quantification of the VPS13C co-IP efficiency normalized by Rab10-GFP levels in IP fraction (N = 4). (F and G) Representative live-cell confocal images showing mCherry-Rab10 WT and TE, but not mCherry-Rab10 TA (magenta) colocalized with lysosomes (LAMP1-mGFP, green) and ER (BFP-KDEL, blue) in COS7 cells with zoom-out (F) and zoom-in (G) (scale bar: zoom-out: 10 µm, zoom-in: 1 µm). Yellow arrows indicate co-localization. (H) Quantification of the percentage of LAMP1-positive vesicles that colocalize with Rab10 (N = 3, from n > 10 cells). (I) Quantification of the percentage of cells with Rab10-positive ER (N = 3; from WT: n = 18 cells, T73E: n = 43 cells, T73A: n = 39 cells). (J and K) Representative live-cell confocal images showing colocalization of VPS13C-mClover (green) with Rab10 WT and Rab10 T73E, but not with Rab10 T73A (magenta) in COS7 cells (zoom-out [J]; zoom-in [K]) (scale bar: zoom-out: 10 µm, zoom-in: 1 µm). Yellow arrows indicate co-localization. (L) Pearson correlation coefficient of VPS13C and Rab10 colocalization comparing Rab10 WT, Rab10 T73E, and Rab10 T73A mutants (N = 3, from n = 13 cells). (M) Quantification of the percentage of VPS13C-positive vesicles colocalized with Rab10 WT, Rab10 T73E, and Rab10 T73A (N = 3, from n > 9 cells). Data are represented as mean ± SEM; one-way ANOVA with Tukey multiple comparison test (E, H, I, L, and M); *P < 0.05 (E), ****P < 0.0001 (E, H, I, L, and M). Source data are available for this figure: SourceData F4.
Figure S3.
Figure S3.
Loss of VPS13C impairs phospho-Rab10-mediated lysosomal stress response. (A) Representative live-cell confocal images showing localization of VPS13C (VPS13C^mClover3, green) on the lysosomal membrane (LAMP1-RFP, magenta) and at lysosome-ER contact sites (LAMP1-RFP and mCherry-ER [magenta] or BFP-KDEL [blue]). Yellow arrows indicate co-localization. N = 3, from n ≥ 20 cells. Scale bar: 1 µm. (B) Quantification of the number of VPS13C-positive vesicles with or without overexpression of Rab10 WT, Rab10 T73E, and Rab10 T73A (N = 3, from n > 10 cells). (C) Quantification of the number of Rab10-positive vesicles with and without overexpression of VPS13C (N = 3, from n > 10 cells). VPS13C and Rab10 do not regulate each other’s recruitment. (D) Schematic of the isolation and enrichment of lysosomes from HEK-293 FT cells expressing LAMP1-RFP-3xHA. Pulldown of lysosomes via anti-HA-magnetic beads. Schematic was generated with http://BioRender.com. (E) Representative immunoblot of protein markers for cytosol, ER, mitochondria, and peroxisomes in enriched lysosomal fractions. (F and G) Quantification of relative enrichment of lysosomal markers compared with other organelle markers from LysoIP fractions showing the purity in lysosomal fractions (N = 3). (H) Quantification of total Rab10 protein levels from lysosomal fractions (N = 4). (I) Representative immunoblot from LysoIP after CQ treatment (100 µM, 16 h) showing lysosomal enrichment. (J) Representative immunoblots of phospho-Rab10 (pRab10) and total Rab10 protein levels from LysoIP after CQ treatment. (K) Quantification of lysosomal phospho-Rab10 protein levels (N = 4). The effect of VPS13C KD on lysosomal phospho-Rab10 under CQ-induced lysosomal stress is comparable with that under basal conditions. Data represented as mean ± SEM; one-way ANOVA with Tukey multiple comparison test (B), unpaired two-tailed t test (C and H), multiple unpaired t test (G), one-sample t test (K); ns: not significant (B, C, G, and H), *P < 0.05 (K). Source data are available for this figure: SourceData FS3.
Figure 5.
Figure 5.
Endogenous interaction between VPS13C and Rab10 depends on LRRK2-mediated Rab10 phosphorylation. (A) Representative confocal images showing PLA signal (red) from VPS13C and Rab10 in control (left) and VPS13C KD (right) cells with DAPI staining (blue) (scale bar: 10 µm). (B and C) Relative quantification of PLA puncta per cell (B) and PLA area per cell (C) (N = 3, from n = 25 images [control] and n = 24 images [VPS13C KD]), confirming the interaction between VPS13C and Rab10 under physiological conditions. (D) Representative confocal images showing PLA signal (red) from MLi-2 treated control cells in comparison to vehicle (DMSO) treatment (scale bar: 10 µm). (E and F) Relative quantification of PLA punta per cell (E) and PLA area per cell (F) (N = 3, from n = 27 images), which validates the phospho-dependent interaction between VPS13C and Rab10 and indicates that the interaction depends on LRRK2-kinase activity. (G) Representative immunoblot of immunoprecipitated Rab10-GFP and co-immunoprecipitated endogenous VPS13C after treatment with MLi-2 in HEK293 FT cells. (H) Relative quantification of co-IP efficiency of VPS13C with or without MLi2 treatment (N = 3). (I) Representative confocal images showing PLA signal (red) from VPS13C and Rab10 in control (left) and VPS13C KD (right) dopaminergic neurons (scale bar: 10 µm). (J and K) Relative quantification of PLA puncta per cell (J) and PLA area per cell (K) (N = 4, from n = 30 images [control] and n = 31 images [VPS13C KD]), confirming that VPS13C and Rab10 interact in dopaminergic neurons. Data represented as mean ± SEM; unpaired two-tailed t test (B, C, E, F, H, J, and K); *P < 0.05 (H), **P < 0.01 (F), ***P < 0.001 (E), ****P < 0.0001 (B, C, J, and K). Source data are available for this figure: SourceData F5.
Figure 6.
Figure 6.
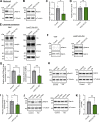
VPS13C deficiency decreases lysosomal phospho-Rab10 and impairs phospho-Rab10-mediated lysosomal stress response. (A–D) Representative immunoblot showing phospho-Rab10 (pRab10; T73) (A) and total Rab10 (B) protein levels from whole-cell lysates of HEK-293 FT cells and (C and D) relative quantification of pRab10 and total Rab10 protein levels (N = 4). (E) Representative immunoblot of lysosomal enrichment using LysoIP (anti-HA magnetic beads for LAMP1-RFP-3xHA pulldown). Immunoblot showing lysosomal enrichment efficiency using antibodies against HA, LAMP2 as a lysosomal membrane marker, and GCase as a luminal lysosome marker (equal loading of input and LysoIP fraction) (N = 4). (F and G) (F) Representative immunoblot of pRab10 and total Rab10 protein levels from LysoIP and (G) quantification of protein levels from LysoIP fractions (N = 4). (H–K) Representative immunoblot of pRab10 and total Rab10 protein levels in HEK-293 FT cells treated with the lysosomotropic compound CQ (H) (100 µM, 16 h) or pH-independent lysosomal stressor LLOMe (J) (500 µM, 1 h). Relative quantification of pRab10 normalized to total Rab10 protein levels under CQ (I) or LLOMe (K) treatment (N = 6). Data represented as mean ± SEM; unpaired two-tailed t test (C, D, G, I, and K); ns: not significant (D), *P < 0.05 (C and I), **P < 0.01 (G and K). Source data are available for this figure: SourceData F6.
Figure S4.
Figure S4.
VPS13C KD does not influence LRRK2 recruitment to lysosomes or its kinase activity. (A–C) Representative immunoblots and relative quantification of LRRK2 and LRRK2-S935 protein levels in LysoIP fractions at baseline condition (N = 4). (D–F) Representative immunoblots and relative quantifications of LRRK2 and LRRK2-S935 protein levels in lysosomal fractions after treatment with CQ (100 μM, 16 h) (N = 4). LRRK2 and LRRK2-S935 protein levels in lysosomal fractions are unchanged at baseline and under lysosomal stress conditions. (G and H) Representative immunoblot and relative protein quantification of Rab10 downstream effector protein EHBP1. (I and J) Representative immunoblot and relative protein quantification of Rab10 phosphatase PPM1H. (K) Representative live-cell confocal images of LAMP1-mGFP (green) in LRRK2 PD mutant (R1441G, lower) and isogenic control (upper) dopaminergic neurons with insets showing smaller lysosomes (yellow arrow) in LRRK2 PD-mutant neurons in comparison to the isogenic control (white arrow) (scale bar: 10 µm, inset: 1 µm). Dashed line represents the outline of the cell. (L) Quantification of average lysosomal size in isogenic control and LRRK2 PD-mutant neurons (N = 3, from n = 11 cells). Data represented as mean ± SEM; unpaired two-tailed t test (B, C, E, F, H, J, and L); ns: not significant (B, C, E, F, H, and J), **P < 0.01 (L). Source data are available for this figure: SourceData FS4.
Figure 7.
Figure 7.
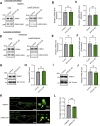
Loss of VPS13C impairs lysosomal hydrolytic activity and acidification in dopaminergic neurons. (A–D) Representative immunoblots showing protein levels of mature cathepsin B (CTSB) (A) and mature cathepsin D (CTSD) (C) with relative protein quantifications, respectively (B and D) (N = 3). (E) Representative live-cell confocal images of Magic Red cathepsin B staining in control neurons showing stronger cathepsin B intensity (white arrow) and in VPS13C KD neurons showing lower cathepsin B intensity (yellow arrow). Scale bar: 10 µm, inset: 1 µm. Dashed line represents the outline of the cell. (F and G) Quantification of the number of Magic Red cathepsin B-positive puncta per cell area (F) and the mean fluorescence intensity of Magic Red cathepsin B-positive puncta (G) (N = 4, from n = 22 cells [control] and n = 19 cells [VPS13C KD]). (H) Representative live-cell confocal images of LysoTracker Red DND-99 staining in control neurons showing stronger LysoTracker intensity (white arrow) and in VPS13C KD neurons showing reduced LysoTracker intensity (yellow arrow). Scale bar: 10 µm, inset: 1 µm. Dashed line represents the outline of the cell. (I and J) Quantification of the number of LysoTracker Red–positive puncta per cell area (I) and the mean fluorescence intensity of LysoTracker Red-positive puncta (J) (N = 4, from n = 19 cells). (K) Schematic of lysosomal phenotypes in VPS13C deficiency in comparison with healthy control. VPS13C-deficient cells have enlarged lysosomes that tether together, are less motile, and have impaired lysosomal hydrolytic activity and acidification. Our data suggests that VPS13C regulates lysosomal homeostasis through the regulation of phospho-Rab10 on the lysosomal membrane. Data represented as mean ± SEM; unpaired two-tailed t test (B, D, F, G, I, and J); **P < 0.01 (B, D, and J), ****P < 0.0001 (F, G, and I). Source data are available for this figure: SourceData F7.
Figure S5.
Figure S5.
Validation of lysosomal phenotypes with additional independent shRNA targeting VPS13C in iPSC-derived dopaminergic neurons. (A and B) Representative immunoblot and quantification of VPS13C KD (KD-2) efficiency in hiPSC-derived dopaminergic neurons (day 70) after 14 days of control and VPS13C shRNA treatment (N = 3). (C) Representative live-cell confocal images of LAMP1-mGFP (green) -positive vesicles in control (upper) and VPS13C KD-2 (lower) neurons with insets showing enlarged lysosomes (yellow arrow) in VPS13C KD-2 condition in comparison with lysosomes in control condition (white arrow) (scale bar: 10 µm, inset: 1 µm). (D) Quantification of the average lysosomal size (N = 4, from n = 17 cells). (E) Time-lapse images of L-L contacts showing tethered lysosomes (yellow arrows) that untether at 37 s (white arrows) in control condition but remain tethered in VPS13C KD-2 neurons until 140 s (yellow arrow) (scale bar: 1 µm). (F) Quantification of the percentage of lysosomes in stable L-L contacts (≥10 s). (G) Quantification of the minimum duration of L-L contacts (N = 4, from n = 12 cells). (H) Representative live-cell confocal images showing LAMP1-positive vesicles (green) and examples of lysosomal motility demonstrated by kymographs (bottom panels) in control and VPS13C KD-2 neurons (scale bar: 10 µm, kymograph scale bar: x = 1 µm, y = 20 s). (I and J) Quantification of the average distance traveled by lysosomes in 60 s and the average lysosomal motility N = 4, from n = 11 cells (control) and n = 13 cells (VPS13C KD-2). (K) Representative live-cell confocal images of Magic Red cathepsin B staining in control neurons showing stronger cathepsin B intensity (white arrow) and in VPS13C KD-2 neurons showing reduced cathepsin B intensity (yellow arrow) Scale bar: 10 µm, inset: 1 µm. (L and M) Quantification of the number of Magic Red cathepsin B-positive puncta per cell area (L) and the mean fluorescence intensity of Magic Red cathepsin B-positive puncta (M) (N = 4, from n = 22 cells). (N) Representative live-cell confocal images of LysoTracker Red DND-99 staining in control neurons showing stronger LysoTracker intensity (white arrow) and in VPS13C KD-2 neurons showing reduced LysoTracker intensity (yellow arrows). Scale bar: 10 µm, inset: 1 µm. (O and P) Quantification of the number of LysoTracker Red-positive puncta per cell area (O) and the mean fluorescence intensity of LysoTracker Red-positive puncta (P) (N = 4, from n = 19 cells). (Q–T) Representative immunoblots and quantifications of phospho-Rab10 (pRab10) and total Rab10 protein levels from whole cell HEK-293 FT lysates (N = 4). Dashed lines in C, H, K, and N represent the outline of the cell. Data collected for the non-targeting control condition were used for the comparison between control and KD-1 in Figs. 1, 2, 3, 6, and 7, and for the comparison between control and KD-2 in Fig. S5. Data represented as mean ± SEM; unpaired two-tailed t test (B, D, F, G, I, J, L, M, O, P, S, and T); ns: not significant (T), *P < 0.05 (D, I, J, and S), **P < 0.01 (B), ***P < 0.001 (F), ****P < 0.0001 (G, L, M, O, and P). Source data are available for this figure: SourceData FS5.

References

    1. Abu-Remaileh, M., Wyant G.A., Kim C., Laqtom N.N., Abbasi M., Chan S.H., Freinkman E., and Sabatini D.M.. 2017. Lysosomal metabolomics reveals V-ATPase- and mTOR-dependent regulation of amino acid efflux from lysosomes. Science. 358:807–813. 10.1126/science.aan6298 - DOI - PMC - PubMed
    1. Ballabio, A., and Bonifacino J.S.. 2020. Lysosomes as dynamic regulators of cell and organismal homeostasis. Nat. Rev. Mol. Cell Biol. 21:101–118. 10.1038/s41580-019-0185-4 - DOI - PubMed
    1. Berndsen, K., Lis P., Yeshaw W.M., Wawro P.S., Nirujogi R.S., Wightman M., Macartney T., Dorward M., Knebel A., Tonelli F., et al. . 2019. PPM1H phosphatase counteracts LRRK2 signaling by selectively dephosphorylating Rab proteins. Elife. 8:e50416. 10.7554/eLife.50416 - DOI - PMC - PubMed
    1. Bonet-Ponce, L., Beilina A., Williamson C.D., Lindberg E., Kluss J.H., Saez-Atienzar S., Landeck N., Kumaran R., Mamais A., Bleck C.K.E., et al. . 2020. LRRK2 mediates tubulation and vesicle sorting from lysosomes. Sci. Adv. 6:eabb2454. 10.1126/sciadv.abb2454 - DOI - PMC - PubMed
    1. Britton, S., Dernoncourt E., Delteil C., Froment C., Schiltz O., Salles B., Frit P., and Calsou P.. 2014. DNA damage triggers SAF-A and RNA biogenesis factors exclusion from chromatin coupled to R-loops removal. Nucleic Acids Res. 42:9047–9062. 10.1093/nar/gku601 - DOI - PMC - PubMed

Publication types