. 2024 Feb 15;9(6):e173337.
doi: 10.1172/jci.insight.173337.

Single-cell analyses of metastatic bone marrow in human neuroblastoma reveals microenvironmental remodeling and metastatic signature

Affiliations

Single-cell analyses of metastatic bone marrow in human neuroblastoma reveals microenvironmental remodeling and metastatic signature

Shenglin Mei et al. JCI Insight. .

Abstract

Neuroblastoma is an aggressive pediatric cancer with a high rate of metastasis to the BM. Despite intensive treatments including high-dose chemotherapy, the overall survival rate for children with metastatic neuroblastoma remains dismal. Understanding the cellular and molecular mechanisms of the metastatic tumor microenvironment is crucial for developing new therapies and improving clinical outcomes. Here, we used single-cell RNA-Seq to characterize immune and tumor cell alterations in neuroblastoma BM metastases by comparative analysis with patients without metastases. Our results reveal remodeling of the immune cell populations and reprogramming of gene expression profiles in the metastatic niche. In particular, within the BM metastatic niche, we observed the enrichment of immune cells, including tumor-associated neutrophils, macrophages, and exhausted T cells, as well as an increased number of Tregs and a decreased number of B cells. Furthermore, we highlighted cell communication between tumor cells and immune cell populations, and we identified prognostic markers in malignant cells that are associated with worse clinical outcomes in 3 independent neuroblastoma cohorts. Our results provide insight into the cellular, compositional, and transcriptional shifts underlying neuroblastoma BM metastases that contribute to the development of new therapeutic strategies.

Keywords: Bone biology; Bone marrow; Cancer; Oncology.


Figures
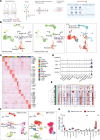
Figure 1
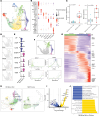
Figure 1. Overview of tumor microenvironment of neuroblastoma nonmetastatic and bone metastatic tumors.
(A) An illustration depicting the experimental design. (B) Integrative analysis of scRNA-Seq samples from 15 NB BM samples visualized using a common UMAP embedding for NB bone metastatic (left), NB bone nonmetastatic samples (middle), and sample fraction. (C) Heatmap showing expression of markers for major cell populations. (D) Violin plot showing representative marker gene expression for tumor cells. (E) Inferred CNV profile of tumor cells from NB bone metastatic tumor. (F) UMAP embedding showing joint integration of cells from NB bone metastatic tumor (left; n = 15) and NB primary tumor (middle; n = 17). (G) Box plot comparing proportion of major cell populations between metastatic (n = 8) and non- metastatic (n = 7) samples. Significance was assessed using 2-sided Wilcoxon ranked-sum test (*P < 0.05, **P < 0.01). For box plots, the center line represents the median, box limits represent upper and lower quartiles, and whiskers depicts 1.5 × the interquartile range (IQR).
Figure 2
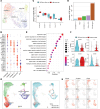
Figure 2. Myeloid cells characterization, enrichment, and differentiation trajectory.
(A) Joint embedding represent the detailed annotation of myeloid cell subpopulations. (B) Dot plot demonstrating marker gene expression across different myeloid subpopulations. The color represents scaled average expression of marker genes in each cell type, and the size indicates the proportion of cells expressing marker genes. (C) Comparison of Neutrohil-1 and Neutrohil-2 proportion in NB bone metastatic (n = 7) and NB bone nonmetastatic (n = 7) samples. Statistics are accessed with 2-sided Wilcoxon ranked-sum test (*P < 0.05). For box plots, the center line represents the median, box limits represent upper and lower quartiles, and whiskers depicts 1.5 × the interquartile range (IQR). (D) UMAP embedding showing representative gene expression for neutrophiles. (E) Violin plot showing representative marker gene expression for 2 neutrophil subpopulations. (F) Estimated trajectory tree moving from promyeloid cells to Neutrophil-1 and Neutrophil-2 (top). Trajectory analysis demonstrates MKI67, CAMP, VNN2, and CMTM2 expression across pseudotime (bottom). (G) Heatmap showing the gene expression dynamics with pseudotime. Representative genes are shown for each cellular state along the cell differentiation. (H) Joint alignment of myeloid cells from NB bone metastatic tumor and NB primary tumor, visualized in UMAP embedding. (I) DEGs of macrophage comparing NB bone metastatic tumor with NB primary tumor, shown as volcano plot. The vertical dashed lines show the cut-off for gene filtering (log2FC 2 and −2), and the horizontal dashed lines signify adjusted P values of 0.01. (J) Enriched GO terms for DEGs from I. The statistical analysis was done using a hypergeometric test.
Figure 3
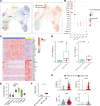
Figure 3. Increased abundance of tumor-infiltrating CTLs and Tregs in NB bone metastasis tumor.
(A) UMAP embedding demonstrating T cell subpopulations (left) and sample fraction (right). (B) Dot plot demonstrating marker gene expression across different T cell populations. The color represents scaled average expression of marker genes in each cell type, and the size indicates the proportion of cells expressing marker genes. (C) Heatmap showing DEG in CTL-1 and CTL-2. (D) Comparison of CTL-1 and CTL-2 abundance in NB bone metastatic (n = 7) and NB bone nonmetastatic (n = 6) samples. Statistics are accessed with 2-sided Wilcoxon ranked-sum test (*P < 0.05). (E) Box plots showing T cell exhaustion score among different T cell subpopulations. Statistics are accessed with Wilcoxon ranked-sum test and Benjamini-Hochberg multiple-comparison correction (*P < 0.05). (F) Box plots illustrate significant increase of Treg activity in the metastatic tumor (NB bone metastatic, n = 7; nonmetastatic, n = 7). Statistics are accessed using 2-sided Wilcoxon ranked-sum test (*P < 0.05). For box plots (DF), the center line represents the median, box limits represent upper and lower quartiles, and whiskers depicts 1.5 × the interquartile range (IQR). (G) Violin plots showing scaled log-normalized expression values of key genes in Tregs. A 2-sided Wilcoxon ranked-sum test was used for statistical analysis.
Figure 4
Figure 4. Characterization of B and NK cell subpopulations.
(A) UMAP embedding of NK cells, color-coded by the cell subtypes. (B) Dot plot signifying marker gene expression across different NK cell subpopulations. The color represents scaled average expression of marker genes in each cell type, and the size indicates the proportion of cells expressing marker genes. (C) Box plot illustrating proportion of NK cell subpopulations in NB bone metastatic (n = 6) and NB bone nonmetastatic (n = 5) samples. Statistics significances are accessed using a 2-sided Wilcoxon ranked-sum test. For box plot, the center line represents the median, box limits represent upper and lower quartiles, and whiskers depicts 1.5 × the interquartile range (IQR). (D) Bar plot showing number of DEGs (adjust P < 0.05) for each NK cell subpopulation comparing NB bone metastatic and NB bone nonmetastatic samples. (E) Gene ontology showing the biological processes enriched in top 200 downregulated genes of CD56bright NK cells comparing NB bone metastatic with NB bone nonmetastatic tumor. The color represents scaled average proportion marker genes in each cell, and the size indicates the number of CD56bright cells. (F) Violin plots showing scaled log-normalized expression values of key genes in CD56bright cell. A 2-sided Wilcoxon ranked-sum test was used for statistical analysis (*P < 0.05). ****P < 0.0001. (G) UMAP embedding demonstrating B cell subpopulations (left) and sample fraction (right). (H) Expression of key marker genes for B cell subpopulations.
Figure 5
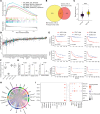
Figure 5. Metastatic signature predicts neuroblastoma patient overall survival.
(A) Gene set enrichment (GSEA) plot depicting the enrichment pathways of genes upregulated in bone metastatic tumor cells against to primary NB tumor cells. (B) A Venn diagram illustrating the overlap of upregulated genes in bone metastatic tumor cells compared with non-malignant cells and primary NB tumor cells (see method). (C) Boxplot representing metastatic signature score in low-risk (n = 273) and high-risk (n = 172) patients with NB (GSE49711). Significance was assessed using 2-sided Wilcoxon ranked-sum test (***P < 0.001). (D) Boxplot showing the CRIPSR screen effect score of metastatic signature genes in neuroblastoma cell lines (n = 35). Effect Scores indicate whether gene knockout (gene loss) has a positive or negative effect on the growth or survival of cancer cells. (E) KM survival curves showing patients with NB with higher metastatic signature gene expression have worse overall survival in 3 independent NB data sets (GSE49711 n = 488, Target n = 247, GSE16476 n = 76). Patients were stratified into 2 groups based on the gene expression (binary: top 25% versus bottom 25%). Statistics are accessed by 2-side log-rank test. (F) Boxplot showing cell growth of neuroblastoma cell line (TET21N) on day3 after shRNA infection (n = 3). (G) Barplot showing relative mRNA expression (n = 3). Data are expressed using the 2−ΔΔCt method. Gene expression levels were normalized to the sh control. Statistical significance determined using 2-sided t-test. (H) Overview of potential ligand-receptor interactions of cell subpopulations. (I) Dot plot showing significant ligand (tumor cells and T cell subsets) and receptor (myeloid cell subsets) expression. Dot size indicates expression ratio, color represents average gene expression (Methods). Boxplots include center line, median; box limits, upper and lower quartiles; whiskers are highest and lowest values no greater than 1.5× IQR. ****P < 0.0001.

References

    1. Johnsen JI, et al. Neuroblastoma-a neural crest derived embryonal malignancy. Front Mol Neurosci. 2019;12:9. doi: 10.3389/fnmol.2019.00009. - DOI - PMC - PubMed
    1. Lazic D, et al. Landscape of bone marrow metastasis in human neuroblastoma unraveled by transcriptomics and deep multiplex imaging. Cancers (Basel) 2021;13(17):4311. doi: 10.3390/cancers13174311. - DOI - PMC - PubMed
    1. Pinto NR, et al. Advances in risk classification and treatment strategies for neuroblastoma. J Clin Oncol. 2015;33(27):3008–3017. doi: 10.1200/JCO.2014.59.4648. - DOI - PMC - PubMed
    1. Basta NO, et al. Factors associated with recurrence and survival length following relapse in patients with neuroblastoma. Br J Cancer. 2016;115(9):1048–1057. doi: 10.1038/bjc.2016.302. - DOI - PMC - PubMed
    1. Smith V, Foster J. High-risk neuroblastoma treatment review. Children (Basel) 2018;5(9):114. - PMC - PubMed

Publication types