. 2024 Feb 14;16(4):3531-3553.
doi: 10.18632/aging.205544. Epub 2024 Feb 14.

Senescence-related genes analysis in breast cancer reveals the immune microenvironment and implications for immunotherapy

Affiliations

Senescence-related genes analysis in breast cancer reveals the immune microenvironment and implications for immunotherapy

Hua Zhong et al. Aging (Albany NY). .

Abstract

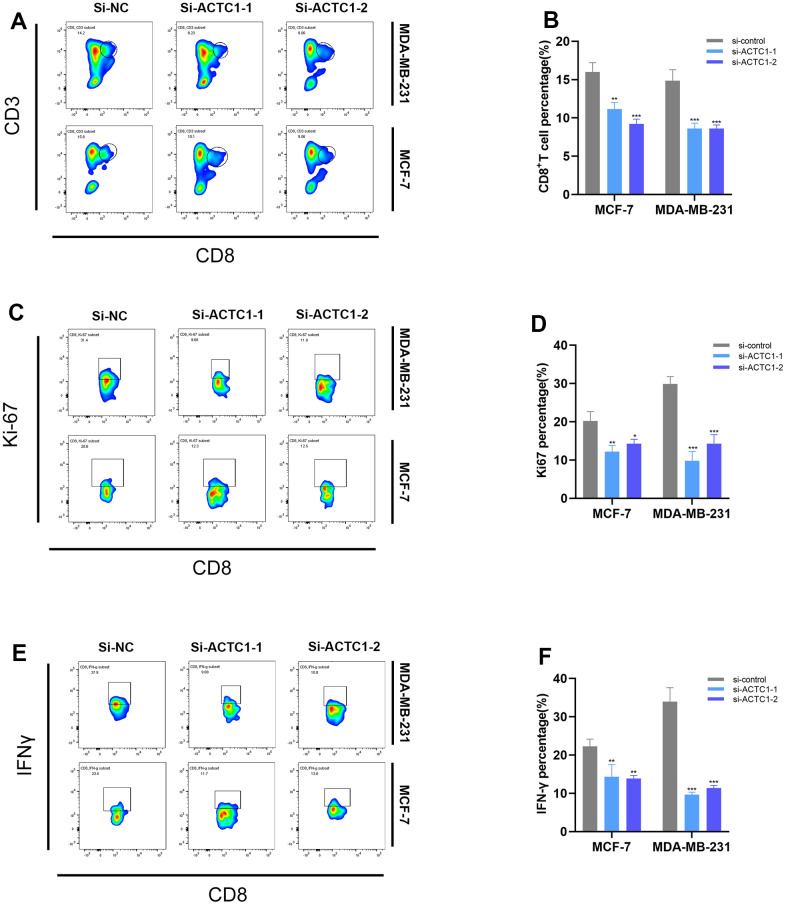
Despite the advent of precision therapy for breast cancer (BRCA) treatment, some individuals are still unable to benefit from it and have poor survival prospects as a result of the disease's high heterogeneity. Cell senescence plays a crucial role in the tumorigenesis, progression, and immune regulation of cancer and has a major impact on the tumor microenvironment. To find new treatment strategies, we aimed to investigate the potential significance of cell senescence in BRCA prognosis and immunotherapy. We created a 9-gene senescence-related signature. We evaluated the predictive power and the role of signatures in the immune microenvironment and infiltration. In vitro tests were used to validate the expression and function of the distinctive critical gene ACTC1. Our risk signature allows BRCA patients to receive a Predictive Risk Signature (PRS), which may be used to further categorize a patient's response to immunotherapy. Compared to conventional clinicopathological characteristics, PRS showed strong predictive efficacy and precise survival prediction. Moreover, PRS subgroups were examined for altered pathways, mutational patterns, and possibly useful medicines. Our research offers suggestions for incorporating senescence-based molecular classification into risk assessment and ICI therapy decision-making.

Keywords: breast cancer; immune microenvironment; immunotherapy; risk signature; senescence.


Conflict of interest statement

CONFLICTS OF INTEREST: The authors declare that the research was conducted in the absence of any commercial or financial relationships that could be construed as potential conflicts of interest.

Figures

Figure 1
Figure 1
The flowchart of our study.
Figure 2
Figure 2
Construction of the prognostic model. (A) Differentially expressed genes between normal and tumor groups. (B) The top 20 differentially expressed genes were shown in the heatmap. (C) The forest plot of prognosis-related genes contained the Hazard Ratio (HR) and its 95% confidence interval. (D) Correlations between the prognosis-related genes. (E, F) The potential prognostic genes were subjected to LASSO-Cox regression in the training cohort to generate a prognostic risk signature.
Figure 3
Figure 3
The distribution of the risk scores, outcome status, and gene profiles of the gene signature in the training, testing, all, and GEO cohort were shown. (AL) The risk group successfully predicted the outcomes of the patients in both the training and validation cohorts, with significantly more events found in the high-risk group. (EH) In the 9-gene risk signature, genes ACTC1, WT1, IVL, SHCBP1, and MAEL showed higher expression in the high-risk group. (IL) The survival analysis is based on the prognostic model. (MP) To further test the confidence of the risk model, a survival analysis was performed between the high-risk group and low-risk group among the training cohort, the testing cohort, all cohort, and the GEO cohort.
Figure 4
Figure 4
Identification of the reliability of the model. (AD) The ROC curve of patients’ survival over different years in the training, testing, all, and GEO cohort showed that the model had a potent predicting ability. (E, F) Univariate and Multivariate Cox regression revealed that the risk score was an independent prognostic factor in BRCA patients. (G) Nomogram for predicting overall survival. (H) The calibration curves for 1-,3-, and 5-year OS. (IL) The PCA 3D scatterplot of sample distribution is based on all genes, senescence-related genes, and model senescence-related genes in TCGA and GEO, respectively.
Figure 5
Figure 5
Enrichment analysis in the TCGA all cohort. (A, B) Bar plot and bubble plot of the Gene ontology (GO) enrichment. The results were divided into the biological process (BP), cell component (CC), and biological function (MF). The top five significant GO enrichment results are shown. (C, D) Bar plot and bubble plot of Kyoto Encyclopedia of Genes and Genomes enrichment. (KEGG) (E) Gene Set Enrichment Analysis (GSEA) revealed that the cell cycle was active in the high-risk group. (F) A protein-protein interaction network was generated to reveal interactions among the top ten genes involved in the “cell cycle”. (G) CHEK1 expression analysis between high and low-risk groups (P<0.05). (H) Gene Set Enrichment Analysis (GSEA) revealed that the “T cell receptor signaling pathway” was active in a low-risk group. (I) Representative genes involved in the “T cell receptor signaling pathway” were used to construct a protein-protein interaction network. (J) The expression profile of a critical checkpoint gene IKBKG was investigated in normal and tumor groups (P<0.05). (K) Survival analysis was performed on patients aged >=65.
Figure 6
Figure 6
Analysis related to immune between two groups. (A) Immune cell bubble plot of risk groups. More immune cells were associated with the high-risk group. (B) Correlations between risk score and immune cell types. (C, D) ssGSEA scores of immune cells and immune functions between high and low-risk groups. ssGSEA scores were lower in the high-risk group. (E) Correlations between immune cells/functions and risk signature genes. (F) The immune checkpoint genes were expressed differently in the two groups, and the gene tended to be lower in the high-risk group (***P<0.001).
Figure 7
Figure 7
Immunotherapy response analysis. (A) A heatmap was drawn to illustrate the relationship between immune cell expression and stromal score, immune score, estimate score, and tumor purity. Immune cell expressions were lower in the high-risk group. (B) The stromal score was lower in the high-risk group than in the low-risk group (P<0.001). (C) The immune score was lower in the high-risk group than in the low-risk group (P<0.001). (D) The ESTIMATE score was lower in the high-risk group than in the low-risk group (P<0.001). (E) Patients in the high-risk group had higher tumor purity scores than those in the low-risk group (P<0.001). (FI) The low-risk subtype has significantly greater IPS.
Figure 8
Figure 8
Mutation analysis and sensitivity difference of antitumor drugs of BRCA. (A, B) The landscape map of the top 15 genes with the highest mutation frequency, among which PIK3CA, TP53, and TTN genes are more prone to mutation. (C) Variance analysis revealed that high-risk groups have a higher tumor mutation burden. (D) K–M survival curves between the high-TMB and low-TMB sets. (E) K-M survival curves between H-H/H-L/L-H/L-L sets. (FI) Boxplot showed the differential IC50 of our previously established high-risk and low-risk groups in the TCGA cohort. The high-risk group was more sensitive to antitumor drugs, including BI.D1870, CMK, PF.4708671, and PHA.665752. (J) Variance analysis of ACTC1 between tumor and normal groups. (K) Survival analysis of ACTC1 in high and low-risk groups. (L) Association of ACTC1 and immune checkpoints. (M) After ACTC1 siRNA transfection into MDA-MB-231 and MCF-7 cell lines, the ACTC1 expression level was significantly reduced.
Figure 9
Figure 9
ACTC1 knockdown in vitro experiment. (A) RT-qPCR analysis was performed to verify the knockdown of ACTC1. (B) Expression analysis of ACTC1 in 20 pairs of BRCA tissue samples. (C, D) CCK-8 experiments. The activity of MDA-MB-231 and MCF-7 cell lines decreased significantly. (E) The cloning ability of MDA-MB-231 and MCF-7 cell lines decreased significantly. (F) EdU test. After ACTC1 knockdown, the proliferation ability of MDA-MB-231 and MCF-7 cell lines decreased significantly. (G) Healing test. After ACTC1 knockdown, the migration ability of MDA-MB-231 and MCF-7 cell lines decreased significantly. (H) Transwell assay. The migration and invasion abilities of MDA-MB-231 and MCF-7 cell lines were significantly decreased (*P<0.05, **P < 0.01, P***<0.001).
Figure 10
Figure 10
Flow cytometry. Representative plots (A) and a representative histogram (B) of the percentages of CD8+ T cells. Representative plots (C) and a representative histogram (D) of the percentages of Ki67. Representative plots (E) and a representative histogram (F) of the percentages of IFN-γ.

Similar articles

Cited by

References

    1. Sung H, Ferlay J, Siegel RL, Laversanne M, Soerjomataram I, Jemal A, Bray F. Global Cancer Statistics 2020: GLOBOCAN Estimates of Incidence and Mortality Worldwide for 36 Cancers in 185 Countries. CA Cancer J Clin. 2021; 71:209–49. 10.3322/caac.21660 - DOI - PubMed
    1. Waks AG, Winer EP. Breast Cancer Treatment: A Review. JAMA. 2019; 321:288–300. 10.1001/jama.2018.19323 - DOI - PubMed
    1. Slamon DJ, Leyland-Jones B, Shak S, Fuchs H, Paton V, Bajamonde A, Fleming T, Eiermann W, Wolter J, Pegram M, Baselga J, Norton L. Use of chemotherapy plus a monoclonal antibody against HER2 for metastatic breast cancer that overexpresses HER2. N Engl J Med. 2001; 344:783–92. 10.1056/NEJM200103153441101 - DOI - PubMed
    1. Xin Yu J, Hodge JP, Oliva C, Neftelinov ST, Hubbard-Lucey VM, Tang J. Trends in clinical development for PD-1/PD-L1 inhibitors. Nat Rev Drug Discov. 2020; 19:163–4. 10.1038/d41573-019-00182-w - DOI - PubMed
    1. Ahn HK, Sim SH, Suh KJ, Kim MH, Jeong JH, Kim JY, Lee DW, Ahn JH, Chae H, Lee KH, Kim JH, Lee KS, Sohn JH, et al.. Response Rate and Safety of a Neoadjuvant Pertuzumab, Atezolizumab, Docetaxel, and Trastuzumab Regimen for Patients With ERBB2-Positive Stage II/III Breast Cancer: The Neo-PATH Phase 2 Nonrandomized Clinical Trial. JAMA Oncol. 2022; 8:1271–7. 10.1001/jamaoncol.2022.2310 - DOI - PMC - PubMed

Publication types