. 2024 Feb 15;73(6):124-130.
doi: 10.15585/mmwr.mm7306a2.

Routes of Drug Use Among Drug Overdose Deaths - United States, 2020-2022

Routes of Drug Use Among Drug Overdose Deaths - United States, 2020-2022

Lauren J Tanz et al. MMWR Morb Mortal Wkly Rep. .

Abstract

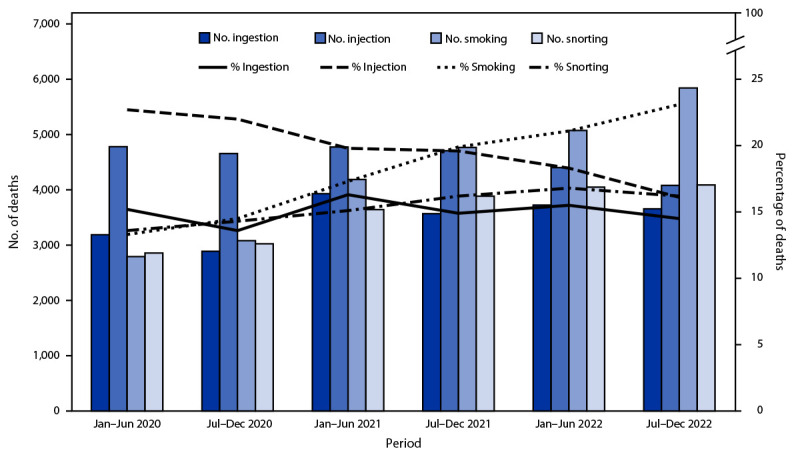
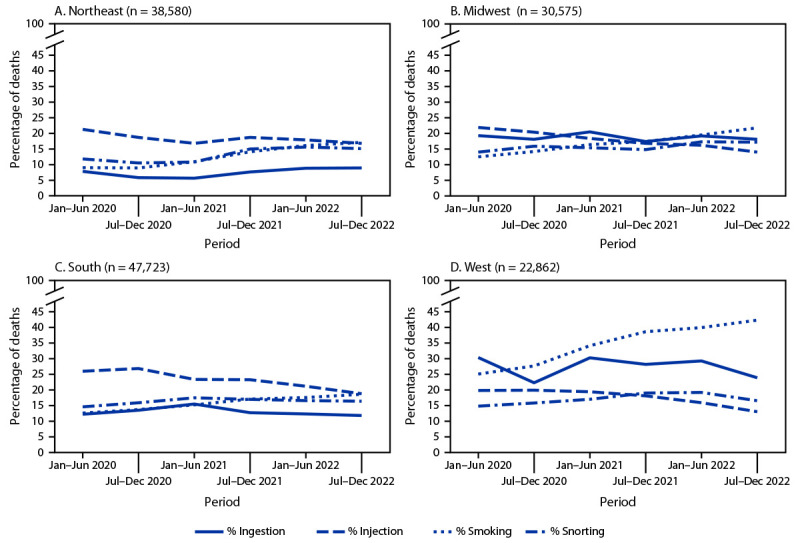
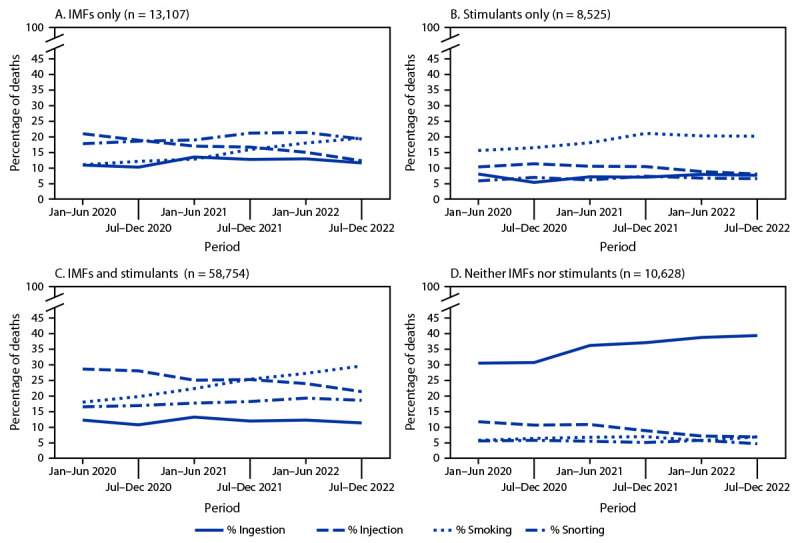
Preliminary reports indicate that more than 109,000 drug overdose deaths occurred in the United States in 2022; nearly 70% of these involved synthetic opioids other than methadone, primarily illegally manufactured fentanyl and fentanyl analogs (IMFs). Data from the western United States suggested a transition from injecting heroin to smoking IMFs. CDC analyzed data from the State Unintentional Drug Overdose Reporting System to describe trends in routes of drug use in 27 states and the District of Columbia among overdose deaths that occurred during January 2020-December 2022, overall and by region and drugs detected. From January-June 2020 to July-December 2022, the percentage of overdose deaths with evidence of injection decreased 29.1%, from 22.7% to 16.1%, whereas the percentage with evidence of smoking increased 73.7%, from 13.3% to 23.1%. The number of deaths with evidence of smoking increased 109.1%, from 2,794 to 5,843, and by 2022, smoking was the most commonly documented route of use in overdose deaths. Trends were similar in all U.S. regions. Among deaths with only IMFs detected, the percentage with evidence of injection decreased 41.6%, from 20.9% during January-June 2020 to 12.2% during July-December 2022, whereas the percentage with evidence of smoking increased 78.9%, from 10.9% to 19.5%. Similar trends were observed among deaths with both IMFs and stimulants detected. Strengthening public health and harm reduction services to address overdose risk related to diverse routes of drug use, including smoking and other noninjection routes, might reduce drug overdose deaths.


Conflict of interest statement

All authors have completed and submitted the International Committee of Medical Journal Editors form for disclosure of potential conflicts of interest. No potential conflicts of interest were disclosed.

Figures

FIGURE 1
FIGURE 1
Number and percentage of drug overdose deaths with evidence of selected routes of drug use,,by 6-month period of death (N = 139,740) — State Unintentional Drug Overdose Reporting System, 28 jurisdictions,, January 2020–December 2022 Abbreviation: SUDORS = State Unintentional Drug Overdose Reporting System. * Percentages with evidence of other routes (i.e., buccal, sublingual, suppository, or transdermal) (583; 0.4%) are not presented because of small sample sizes; decedents with drug use via these routes are included in the denominators. In addition, percentages of decedents with no information on route (68,260; 48.8%) are not shown; these decedents are also included in the denominators. Routes of drug use are not mutually exclusive; decedents might have used multiple routes. § Alaska, Arizona, Colorado, Connecticut, Delaware, District of Columbia, Georgia, Illinois, Kansas, Kentucky, Maine, Maryland, Massachusetts, Minnesota, Nebraska, New Hampshire, New Jersey, North Carolina, Ohio, Oklahoma, Oregon, Pennsylvania, Rhode Island, Utah, Vermont, Virginia, Washington, and West Virginia. Illinois and Washington reported deaths from counties that accounted for ≥75% of drug overdose deaths in the respective state in 2017, per SUDORS funding requirements; all other jurisdictions reported deaths from the full jurisdiction. Jurisdictions were included if medical examiner or coroner reports and toxicology reports were available for ≥75% of deaths during January 2020–December 2022. Analysis was restricted to deaths with an available medical examiner or coroner report (139,740; 95.8% of all deaths).
FIGURE 2
FIGURE 2
Percentage of drug overdose deaths with evidence of selected routes of drug use, by U.S. Census Bureau region and 6-month period of death (N = 139,740) — State Unintentional Drug Overdose Reporting System, 28 jurisdictions, January 2020–December 2022 * Percentages with evidence of other routes (i.e., buccal, sublingual, suppository, or transdermal) are not presented because of small sample sizes (Panel A [Northeast]: 136, 0.4%; Panel B [Midwest]: 121, 0.4%; Panel C [South]: 223, 0.5%; and Panel D [West]: 103, 0.5%); decedents with drug use via these routes are included in the denominators. In addition, percentages of decedents with no information on route are not shown (Panel A: 22,541, 58.4%; Panel B: 15,381, 50.3%; Panel C: 22,571, 47.3%; and Panel D: 7,767, 34.0%); these decedents are also included in the denominators. Analysis included some, but not all, of the jurisdictions in each U.S. Census Bureau region. Northeast: Connecticut, Maine, Massachusetts, New Hampshire, New Jersey, Pennsylvania, Rhode Island, and Vermont; Midwest: Illinois, Kansas, Minnesota, Nebraska, and Ohio; South: Delaware, District of Columbia, Georgia, Kentucky, Maryland, North Carolina, Oklahoma, Virginia, and West Virginia; West: Alaska, Arizona, Colorado, Oregon, Utah, and Washington. § Jurisdictions were included if medical examiner or coroner reports and toxicology reports were available for ≥75% of deaths during January 2020–December 2022. Analysis was restricted to deaths with an available medical examiner or coroner report (139,740; 95.8% of all deaths).
FIGURE 3
FIGURE 3
Percentage of drug overdose deaths with evidence of selected routes of drug use, by drugs detected,,,, and 6-month period of death — State Unintentional Drug Overdose Reporting System, 28 jurisdictions,§§ January 2020–December 2022 Abbreviations: IMFs = illegally manufactured fentanyls; SUDORS = State Unintentional Drug Overdose Reporting System. * Percentages with evidence of other routes (i.e., buccal, sublingual, suppository, or transdermal) are not presented because of small sample sizes (Panel A [IMFs only]: 23, 0.2%; Panel B [Stimulants only]: 11, 0.1%; Panel C [IMFs and stimulants]: 146, 0.2%; and Panel D [Neither IMFs nor stimulants]: 158, 1.5%); decedents with drug use via these routes are included in the denominators. In addition, percentages of decedents with no information on route are not shown (Panel A: 6,802, 51.9%; Panel B: 5,652, 66.3%; Panel C: 25,597, 43.6%; and Panel D: 5,435, 51.1%); these decedents are also included in the denominators. Data on drugs detected come from postmortem toxicology reports; among decedents with a medical examiner or coroner report, analysis was further restricted to decedents with a toxicology report (136,466; 97.7% of decedents with a medical examiner or coroner report). § Ethanol and other selected drugs (e.g., naloxone and cotinine) were not considered a drug for this analysis; deaths categorized as IMFs only (Panel A) or stimulant only (Panel B) might have also had ethanol or these other selected drugs detected. Deaths with IMFs and stimulants detected (Panel C) could also have other drugs detected (e.g., prescription opioids). ** Deaths with neither IMFs nor stimulants detected primarily had prescription opioids (65.3%) or benzodiazepines (37.3%) detected. †† Drug categories are not comprehensive; some deaths are excluded because they contain drug combinations that are not presented in the panels (e.g., deaths with only IMFs and prescription opioids detected). §§ Alaska, Arizona, Colorado, Connecticut, Delaware, District of Columbia, Georgia, Illinois, Kansas, Kentucky, Maine, Maryland, Massachusetts, Minnesota, Nebraska, New Hampshire, New Jersey, North Carolina, Ohio, Oklahoma, Oregon, Pennsylvania, Rhode Island, Utah, Vermont, Virginia, Washington, and West Virginia. Illinois and Washington reported deaths from counties that accounted for ≥75% of drug overdose deaths in the respective state in 2017, per SUDORS funding requirements; all other jurisdictions reported deaths from the full jurisdiction.

References

    1. Mattson CL, Tanz LJ, Quinn K, Kariisa M, Patel P, Davis NL. Trends and geographic patterns in drug and synthetic opioid overdose deaths—United States, 2013–2019. MMWR Morb Mortal Wkly Rep 2021;70:202–7. 10.15585/mmwr.mm7006a4 - DOI - PMC - PubMed
    1. Bradley H, Hall EW, Asher A, et al. Estimated number of people who inject drugs in the United States. Clin Infect Dis 2023;76:96–102. 10.1093/cid/ciac543 - DOI - PMC - PubMed
    1. Kral AH, Lambdin BH, Browne EN, et al. Transition from injecting opioids to smoking fentanyl in San Francisco, California. Drug Alcohol Depend 2021;227:109003. 10.1016/j.drugalcdep.2021.109003 - DOI - PMC - PubMed
    1. Valasek CJ, Streuli SA, Pines HA, et al. “A lotta people switched playing hard ball to playing Russian roulette”: experiences with rising overdose incidence caused by drug supply changes during the COVID-19 pandemic in the San Diego-Tijuana border metroplex. Drug Alcohol Depend Rep 2023;7:100154. 10.1016/j.dadr.2023.100154 - DOI - PMC - PubMed
    1. Megerian CE, Bair L, Smith J, et al. Health risks associated with smoking versus injecting fentanyl among people who use drugs in California. Drug Alcohol Depend 2024;255:111053. 10.1016/j.drugalcdep.2023.111053 - DOI - PubMed

MeSH terms