. 2024 Feb 16;383(6684):eadg0564.
doi: 10.1126/science.adg0564. Epub 2024 Feb 16.

The lipid globotriaosylceramide promotes germinal center B cell responses and antiviral immunity

Affiliations

The lipid globotriaosylceramide promotes germinal center B cell responses and antiviral immunity

Pankaj Sharma et al. Science. .

Abstract

Influenza viruses escape immunity owing to rapid antigenic evolution, which requires vaccination strategies that allow for broadly protective antibody responses. We found that the lipid globotriaosylceramide (Gb3) expressed on germinal center (GC) B cells is essential for the production of high-affinity antibodies. Mechanistically, Gb3 bound and disengaged CD19 from its chaperone CD81, permitting CD19 to translocate to the B cell receptor complex to trigger signaling. Moreover, Gb3 regulated major histocompatibility complex class II expression to increase diversity of T follicular helper and GC B cells reactive with subdominant epitopes. In influenza infection, elevating Gb3, either endogenously or exogenously, promoted broadly reactive antibody responses and cross-protection. These data demonstrate that Gb3 determines the affinity and breadth of B cell immunity and has potential as a vaccine adjuvant.


Conflict of interest statement

Competing interests: The authors declare that they have no competing financial interests. F.W. and P.S. are listed as inventors on a patent application filed by Boston Children’s Hospital (provisional application number: 63/452,962), which covers the use of the lipid Gb3 in vaccination.

Figures

Fig. 1.
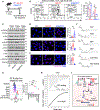
Fig. 1.. Gb3 promotes the formation of germinal centers and antibody maturation.
(A) Diagrammatic representation of the experimental setup. WT, Gla-KO, or A4galt-KO mice were immunized with NP-OVA adsorbed on alum. (B) FACS plots and percentage of GC B cells and plasma cells in the spleen on day 10 after NP-OVA immunization. The data shown are representative of three independent experiments with seven or eight mice per group. (C) Confocal microscopy of frozen sections from the spleen on day 10 after immunization. IgD (blue: naïve B cells), CD3 (red: T cells), and GL7 (yellow: GC B cells). GL7 staining was used to identify GCs, and the GC area was calculated in relation to the whole section. Bar graph depicts the percentage of GC area to the total section area from five mice per group. Scale bars, 200 μm. (D) Serological analysis of immunoglobulin concentrations of indicated isotypes based on endpoint titers using ELISA on day 13 after immunization. Experiment was repeated three times with eight mice per group, and graph shows data from one representative experiment. (E) Avidity index of NP-OVA–specific IgG was measured by ELISA and expressed as the percentage of the endpoint titer values obtained with sodium thiocyanate treatment (2 M) compared with PBS on day 13 after immunization. Experiment was repeated twice with eight mice per group, and graph shows data from one representative experiment. (F) Antibody affinity assay. Sera were analyzed by ELISA, and high-affinity antibodies were measured as a ratio of antibodies binding to BSA conjugated with NP4 (low valency) to NP30 (high valency). The graph shows data from one representative experiment repeated twice with eight mice per group. (G) Pie charts representing the distribution of productive VH1–72 clonotypes in the GCs of each mouse. Colors indicate the dominant clonotypes found among three different mouse genotypes. (H) Somatic hypermutation profiles of VH1–72 segments of the dominant clonotypes compared with background intrinsic mutation pattern of nonproductive VH1–72 alleles. Data are plotted as the percentage of reads containing mutations at each nucleotide. The VH sequences cover the CDR1 region containing a point mutation at position 98 that corresponds to the NP-specific high-affinity mutation W33L (indicated by arrow). Bar graphs depict frequencies of the W33L mutation in individual mice. Representative junctional structure of each IgH clonotype shown at the top was generated by WebLogo and aligned with germline VH (red), DH (blue), and JH (orange) sequences, with the deleted sequences shown in gray. CDR3 nucleotide sequences are shown in black, purple denotes amino acid sequences, and the clonotype consensus is shown in sequence-logo pictures comprising CDR3 nucleotide sequences with matching V and J segments, identical CDR3 length, and >90% sequence similarity. AID target hotspot motifs AGCT, TCGA, and DGYW (where D stands for G, T, or A; G stands for mutations at G-C pairs; Y stands for a pyrimidine base; and W stands for A or T) are highlighted, and the green color represents the error bar. In (G) and (H), the data are from three mice in WT and Gla-KO groups and four mice in the A4galt-KO group. All graphs represent mean ± SD, and data points in bar graphs represent individual mice. Significance was calculated by using Kruskal-Wallis H test with Dunn’s multiple comparison test. *P ≤ 0.05, **P ≤ 0.01, and ***P ≤ 0.001.
Fig. 2.
Fig. 2.. Gb3 binds to CD19 for translocation to the BCR complex and efficient signaling.
(A) Diagrammatic representation of the experimental setup. WT, Gla-KO, or A4galt-KO mice were immunized with NP-OVA adsorbed on alum. (B) FACS plots and percentages of centroblasts (CB) and centrocytes (CC) in the spleen gated on GL7+, CD95+, and IgD GC B cells on day 10 after immunization. The experiment was repeated three times (four or five mice per group). (C) Immunoblot showing BCR and CD19 downstream signaling molecules and transcription factors. Anti-IgM antibodies [IgM-F(ab)2] were used to stimulate FACS-sorted GC B cells for 2 or 5 min. U, unstimulated. (D) Proximity ligation assay performed on GC B cells to probe for vicinity between CD81 and CD19 (top panel; blue, DAPI; red, CD19:CD81 PLA signal), and BCR and CD19 (bottom panel; blue, DAPI; red, CD19:BCR PLA signal). Scale bars, 10 μm. (E) PLA performed on FACS-sorted GC B cells to probe for proximity between CD19 and Gb3 (blue, DAPI; red, CD19:Gb3 PLA signal). PLA signal was captured by confocal microscopy, and images were processed and analyzed by ImageJ software. Scale bars, 10 μm. In (D) and (E), experiments were repeated at least three times, and signals on more than 30 cells in different fields were calculated for statistical analysis. (F) Structures of different lipids and Gb3 analog used in the study. (G) FACS-sorted GC B cells from A4galt-KO mice were seeded with a complex of lipid and BSA for 2 hours at 37°C (see methods), and Akt phosphorylation was quantified after stimulation of GC B cells with anti-IgM F (ab)2 to examine the effect of lipid reconstitution on Akt phosphorylation in GC B cells from Gb3-deficient mice. Histogram overlay (left) and mean fluorescence intensity (right panel) of pAkt staining measured by phospho-flow in GC B cells cultured with different lipids. The experiment was repeated twice with three samples per group. (H) Isothermal titration calorimetry to measure the binding between Gb3 and CD19. CD19 and the Gb3 analog were dissolved in PBS, and thermodynamic analysis of their binding was carried out at 25°C on a MicroCal ITC 200 instrument. (Top) The x axis depicts time, and the y axis represents rate of heat release (microcalories per second). (Bottom) The x axis represents molar ratio between CD19 and Gb3 analog, and the y axis depicts change in enthalpy. (I) A mechanistic scheme of the effect of Gb3 on the CD19 translocation and BCR downstream signaling pathway. All graphs represent mean ± SD. Data points represent individual mice (B), single cells [(D) and (E)], and individual samples (G). Significance was calculated by Kruskal-Wallis H test with Dunn’s multiple comparison test. *P ≤ 0.05, **P ≤ 0.01, and ***P ≤ 0.001.
Fig. 3.
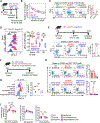
Fig. 3.. Gb3 facilitates the selection of subdominant epitopes.
(A) Schematic representation of the experimental setup. WT, Gla-KO, or A4galt-KO mice were immunized with NP-OVA adsorbed on alum. (B) Rarefaction curves showing the clonotype diversity for the three genotypes (purple, WT; red, Gla-KO; blue, A4galt-KO). The solid dark curves and light shades show the mean and SEM (standard error of the mean) of the calculated diversity for each genotype. One-way ANOVA with Tukey’s HSD method was used to test the difference in diversity across different genotypes at 1000, 3000, and 5000 reads (n = 3 mice for WT and Gla-KO; n = 4 mice for A4galt-KO). (C) FACS plots and percentages of OVA-FITC+ and NP-PE+ among GL7+ and CD95+ GC B cells in the spleen on day 16 after immunization. The data are representative of three independent experiments with at least four mice per group. (D) Histogram overlays depicting the MHC-II expression on naïve B cells, centroblasts, and centrocytes as quantified by flow cytometry. Experiment was repeated at least three times with five mice per group. (E) (Top) Experimental setup of NP-OVA immunization and OT-II T cell transfer. (Bottom) FACS plots and percentages of OT-II TFH cells in the spleen on day 10 after immunization as quantified by flow cytometry. The experiment was repeated at least two times (five or six mice per group). (F) Experimental setup of NP-OVA immunization using different mouse models. (G) MHC-II expression on GC B cells on day 16 after immunization. Data are plotted as mean fluorescence intensity as quantified by flow cytometry (n = 5 mice per group). (H) FACS plots and percentages of OVA-FITC+ and NP-PE+ GC B cells in the spleen on day 16 after immunization. (I) Serological analysis of indicated antigen-specific immunoglobulin concentrations as detected by ELISA on day 16 after immunization. For (G) and (H), experiments were repeated three times with five mice per group. Graphs in (C) to (I) represent mean ± SD, and data points in graphs represent individual mice. Significance was calculated by Kruskal-Wallis H test with Dunn’s multiple comparison test. *P ≤ 0.05, **P ≤ 0.01, and ***P ≤ 0.001; ns, not significant.
Fig. 4.
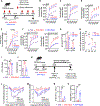
Fig. 4.. Exogenous Gb3 broadens the antibody response in influenza infection.
(A) Experimental setup depicting animal groups, timeline of immunization, and sample collection schedule for rHA immunization. (B to D) Serological analysis of immunoglobulin concentrations of indicated isotypes specific for rHA was performed by ELISA. Graphs represent mean ± SD with five mice per group. The experiment was repeated three times. (E) Avidity of rHA-specific IgG was measured by ELISA and expressed as the percentage of the endpoint titer values obtained with sodium thiocyanate treatment (2 M) compared with PBS. Graphs represent mean ± SD with five mice per group. (F) Serum concentrations of immunoglobulins against rHA head and stalk were detected by ELISA. Graphs represent mean ± SD with five mice per group. (G) Enzyme-linked immunosorbent spot (ELISPOT) showing IgG1- and IgG2c-producing plasma cells recognizing rHA on day 60 after immunization. The experiment was repeated three times (n = 4 mice for each group). (H) Serum concentrations of immunoglobulins against rHA of heterotypic influenza strains were detected by ELISA. The experiment was repeated three times (n = 6 mice for each group). (I and J) H1N1 or H3N2 neutralizing antibody (NA) titers in serum on day 28 after rHA immunization. Serum concentrations of immunoglobulins against rHA of heterotypic influenza strains were detected by ELISA. The experiment was repeated at least three times (n = 5 mice for each group). (K) Experimental setup depicting immunization and infection regimen. Immunized mice were challenged intranasally with 103 PFU of either H1N1 or H3N2 on day 28. i.n., intranasal. (L and M) Weight loss curve after H1N1 (PR8) or H3N2 (HK68, X-31) infection. Data shown in graphs represent three independent experiments with five mice per group. (N and O) H1N1 or H3N2 PFUs in lungs on day 5 after infection. The experiment was repeated twice with five mice per group. All bar graphs represent mean ± SD. Data points in graphs represent individual mice. Statistics were calculated by Kruskal-Wallis H test with Dunn’s multiple comparison test. *P ≤ 0.05, **P ≤ 0.01, and ***P ≤ 0.001.

References

    1. Victora GD, Nussenzweig MC, Germinal centers. Annu. Rev. Immunol 40, 413–442 (2022). doi: 10.1146/annurev-immunol-120419-022408; - DOI - PubMed
    1. Crotty S, T follicular helper cell biology: A decade of discovery and diseases. Immunity 50, 1132–1148 (2019). doi: 10.1016/j.immuni.2019.04.011; - DOI - PMC - PubMed
    1. Angeletti D et al. Defining B cell immunodominance to viruses. Nat. Immunol 18, 456–463 (2017). doi: 10.1038/ni.3680; - DOI - PMC - PubMed
    1. Wei CJ et al. Next-generation influenza vaccines: Opportunities and challenges. Nat. Rev. Drug Discov 19, 239–252 (2020). doi: 10.1038/s41573-019-0056-x; - DOI - PMC - PubMed
    1. Ekiert DC et al. Antibody recognition of a highly conserved influenza virus epitope. Science 324, 246–251 (2009). doi: 10.1126/science.1171491; - DOI - PMC - PubMed

Publication types

LinkOut - more resources