. 2024 Feb 20;121(8):e2319364121.
doi: 10.1073/pnas.2319364121. Epub 2024 Feb 15.

The impact of age and number of mutations on the size of clonal hematopoiesis

Affiliations

The impact of age and number of mutations on the size of clonal hematopoiesis

Kai Wang et al. Proc Natl Acad Sci U S A. .

Abstract

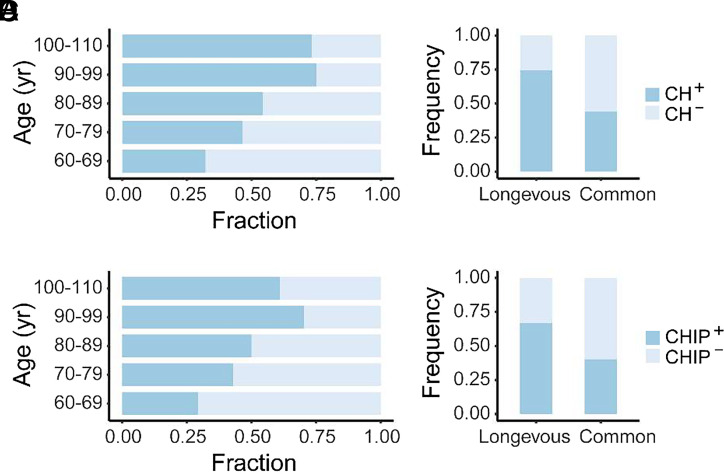
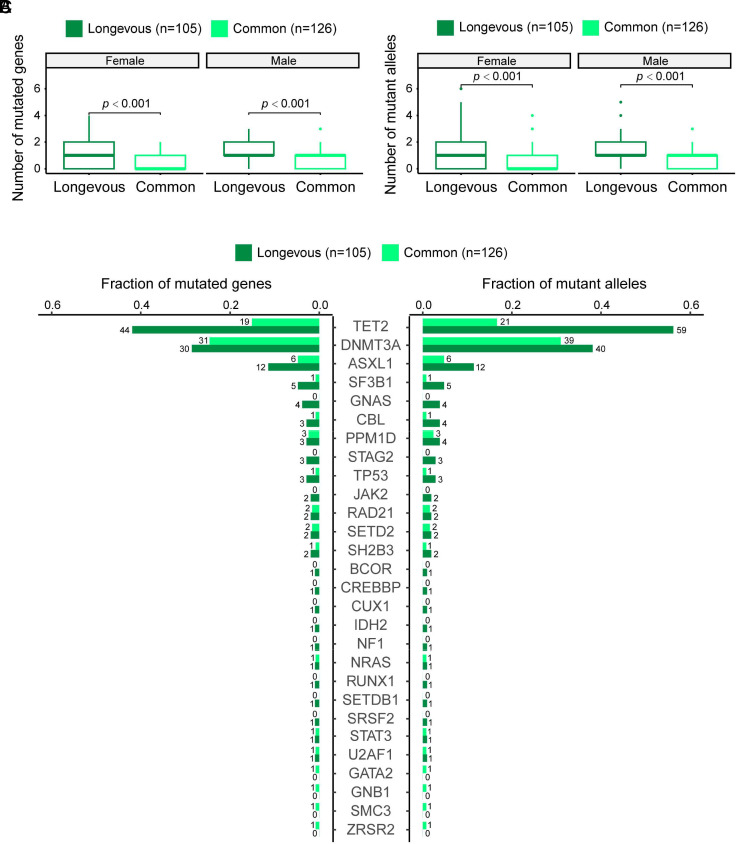
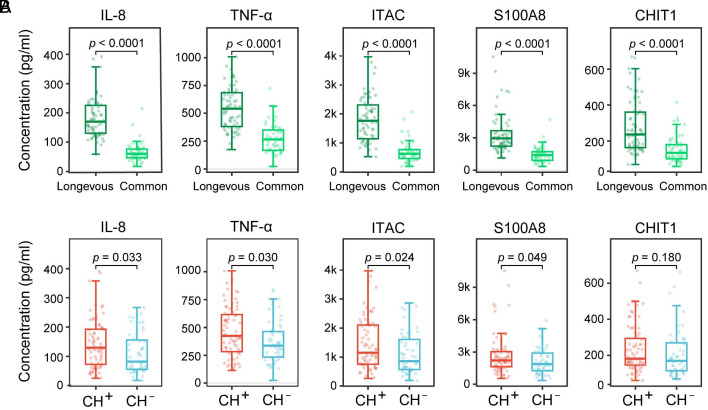
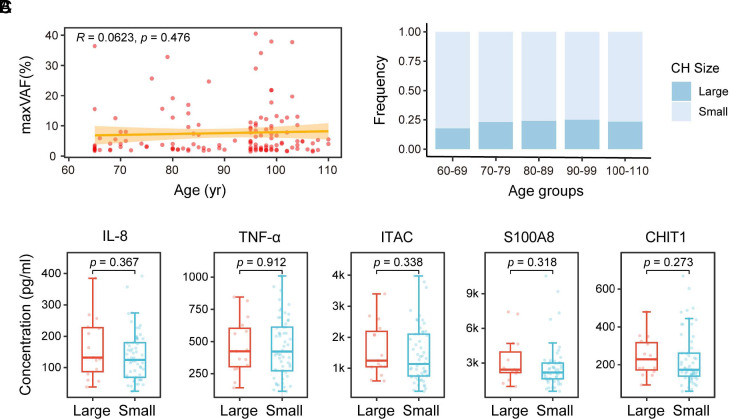
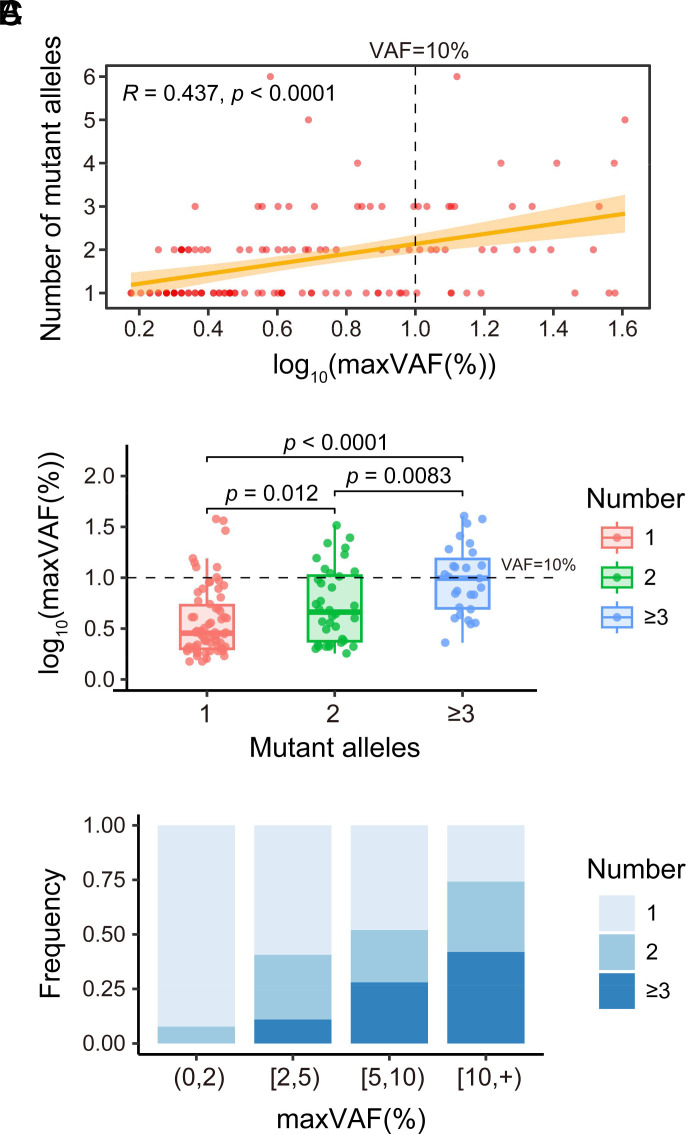
Clonal hematopoiesis (CH) represents the clonal expansion of hematopoietic stem cells and their progeny driven by somatic mutations. Accurate risk assessment of CH is critical for disease prevention and clinical decision-making. The size of CH has been showed to associate with higher disease risk, yet, factors influencing the size of CH are unknown. In addition, the characteristics of CH in long-lived individuals are not well documented. Here, we report an in-depth analysis of CH in longevous (≥90 y old) and common (60~89 y old) elderly groups. Utilizing targeted deep sequencing, we found that the development of CH is closely related to age and the expression of aging biomarkers. The longevous elderly group exhibited a significantly higher incidence of CH and significantly higher frequency of TET2 and ASXL1 mutations, suggesting that certain CH could be beneficial to prolong life. Intriguingly, the size of CH neither correlates significantly to age, in the range of 60 to 110 y old, nor to the expression of aging biomarkers. Instead, we identified a strong correlation between large CH size and the number of mutations per individual. These findings provide a risk assessment biomarker for CH and also suggest that the evolution of the CH is influenced by factor(s) in addition to age.

Keywords: aging; clonal hematopoiesis; mutations; targeted DNA sequencing.


Conflict of interest statement

Competing interests statement:The authors declare no competing interest.

Figures

Fig. 1.
Fig. 1.
CH in longevous elderly group and common elderly group. (A) Proportion of CH in different age intervals. (B) Proportion of CHIP in different age intervals. (C) Stacked bar plot depicting individuals with CH (CH+) and individuals without CH (CH) in the longevous versus common elderly groups. Chi-square test indicates a significant difference between the two age groups (P < 0.001). (D) Stacked bar plot illustrating individuals with (CHIP+) and individuals without CHIP (CHIP) in the longevous versus common elderly groups. Chi-square test indicates a significant difference between the two age groups (P < 0.001).
Fig. 2.
Fig. 2.
CH mutations in the longevous elderly group versus the common elderly group. (A) Comparison of number of mutated genes per individual in the female and male longevous elderlies versus the female and male common elderlies. Statistical analysis was conducted using the Wilcoxon’s rank-sum test. (B) Comparison of the number of mutant alleles per individual in the female and male longevous elderlies versus the female and male common elderlies. Wilcoxon’s rank-sum test was used for statistical analysis. (C) Distribution of mutated genes (Left) and mutant alleles (Right) in the longevous elderly group versus the common elderly groups. The numbers labeled represent the number of individuals harboring the corresponding mutated genes and mutant alleles, respectively.
Fig. 3.
Fig. 3.
Association analysis of CH and age-related biomarkers. (A) Comparison of the expression of aging biomarkers between the longevous elderly group and the common elderly group. Wilcoxon’s rank-sum test was used for statistical analysis, with the resulting P-value labeled for each comparison. (B) Comparison of the expression of aging biomarkers between individuals with CH (CH+) and individuals without CH (CH). Wilcoxon’s rank-sum test was used for statistical analysis, with the resulting P-value labeled for each comparison.
Fig. 4.
Fig. 4.
Correlation between the size of CH versus age and aging biomarkers. (A) Scatter plot illustrating the size of CH (reflected by maxVAF) in each CH-positive individual across age. The relationship between the size of CH and age was assessed by Spearman’s correlation. Calculated correlation coefficient and P-value are labeled. The orange-yellow band represents the 95% CI for the linear regression. (B) Stacked bar plot depicting CH with VAF ≥ 10% (Large) and CH with VAF < 10% (Small) in 5 age groups. Statistical analysis using the chi-square test indicates no significant difference between the groups (P = 0.983). (C) Comparison of the expression of aging biomarkers between individuals harboring CH with VAF ≥ 10% (Large) and individuals harboring CH with VAF < 10% (Small). Wilcoxon’s rank-sum test was used for statistical analysis, with the resulting P-value labeled for each comparison.
Fig. 5.
Fig. 5.
Correlation between the size of CH versus the number of mutant alleles per individual. (A) Scatter plot illustrating the number of mutant alleles per individual and the size of CH [expressed as log10(maxVAF(%))]. The relationship between the number of mutant alleles per individual and the size of CH was assessed by Spearman's correlation. Calculated correlation coefficient and P-value are labeled. The orange-yellow band represents the 95% CI for the linear regression. (B) Comparison of the number of mutant alleles per individual, as indicated, and the size of CH [expressed as log10(maxVAF(%))]. (C) Stacked bar plot depicting CH-positive individuals with different numbers of mutant alleles, as indicated, in 4 different CH size (represented as maxVAF) groups. (0,2), [2,5), [5,10), and [10, +) represent the VAF of CH size groups <2%, ≥2% to <5%, ≥5% to <10%, and ≥10%, respectively.

References

    1. Mitchell E., et al. , Clonal dynamics of haematopoiesis across the human lifespan. Nature 606, 343–350 (2022). - PMC - PubMed
    1. Challen G. A., Goodell M. A., Clonal hematopoiesis: Mechanisms driving dominance of stem cell clones. Blood 136, 1590–1598 (2020). - PMC - PubMed
    1. Genovese G., et al. , Clonal hematopoiesis and blood-cancer risk inferred from blood DNA sequence. N. Engl. J. Med. 371, 2477–2487 (2014). - PMC - PubMed
    1. Jaiswal S., et al. , Age-related clonal hematopoiesis associated with adverse outcomes. N. Engl. J. Med. 371, 2488–2498 (2014). - PMC - PubMed
    1. Khoury J. D., et al. , The 5th edition of the World Health Organization classification of haematolymphoid tumours: Myeloid and histiocytic/dendritic neoplasms. Leukemia 36, 1703–1719 (2022). - PMC - PubMed

LinkOut - more resources