. 2024 Feb 29;187(5):1255-1277.e27.
doi: 10.1016/j.cell.2024.01.027. Epub 2024 Feb 14.

Pan-cancer proteogenomics characterization of tumor immunity

Collaborators, Affiliations

Pan-cancer proteogenomics characterization of tumor immunity

Francesca Petralia et al. Cell. .

Abstract

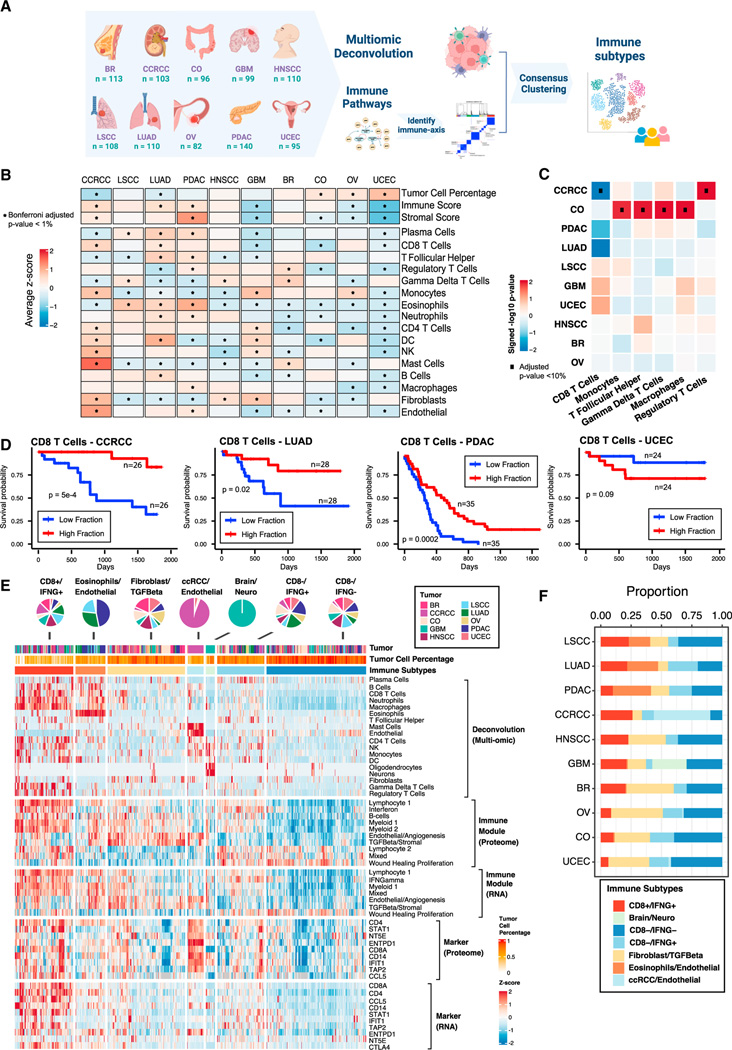
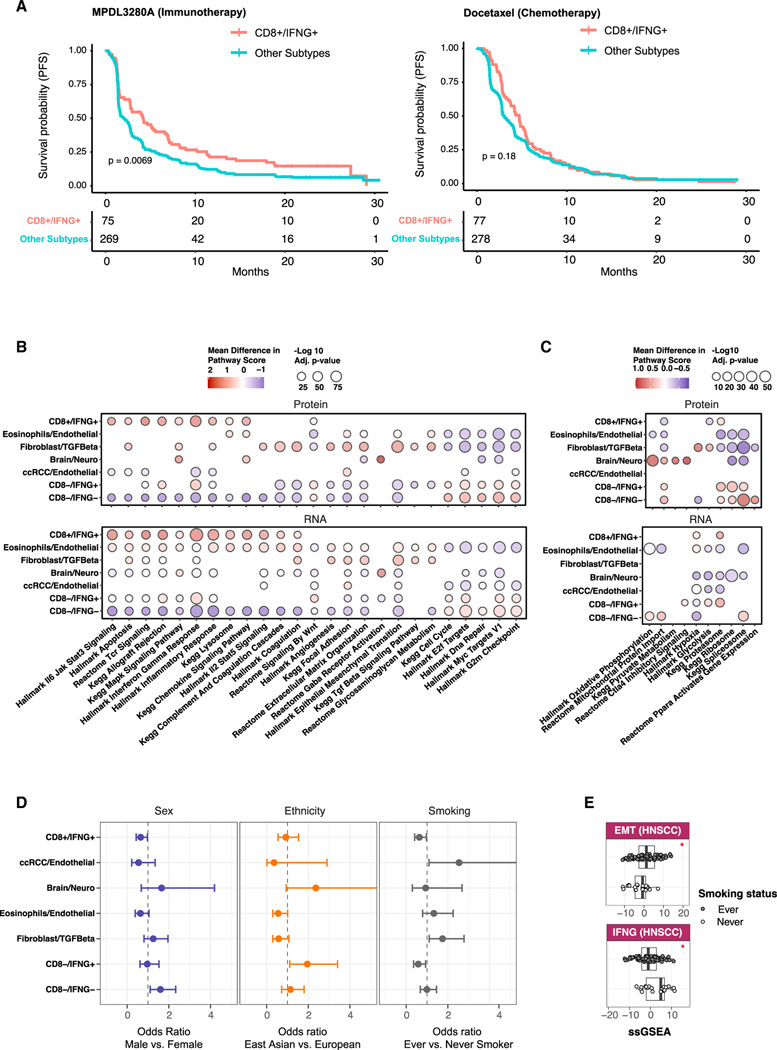
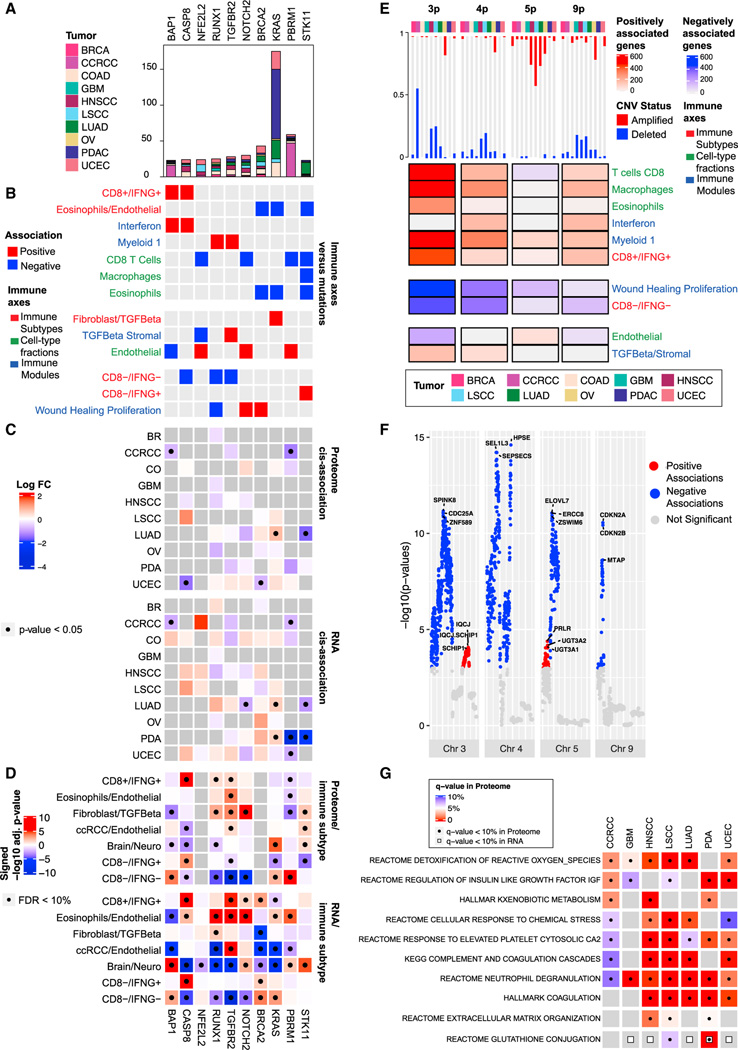
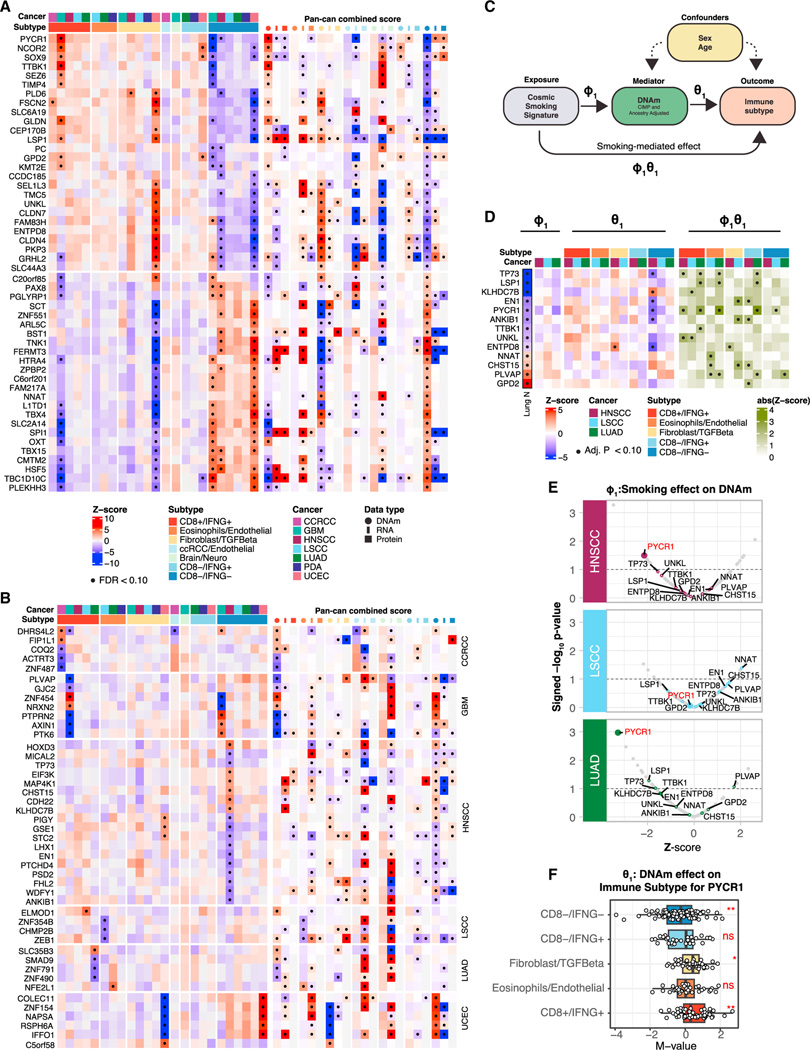
Despite the successes of immunotherapy in cancer treatment over recent decades, less than <10%-20% cancer cases have demonstrated durable responses from immune checkpoint blockade. To enhance the efficacy of immunotherapies, combination therapies suppressing multiple immune evasion mechanisms are increasingly contemplated. To better understand immune cell surveillance and diverse immune evasion responses in tumor tissues, we comprehensively characterized the immune landscape of more than 1,000 tumors across ten different cancers using CPTAC pan-cancer proteogenomic data. We identified seven distinct immune subtypes based on integrative learning of cell type compositions and pathway activities. We then thoroughly categorized unique genomic, epigenetic, transcriptomic, and proteomic changes associated with each subtype. Further leveraging the deep phosphoproteomic data, we studied kinase activities in different immune subtypes, which revealed potential subtype-specific therapeutic targets. Insights from this work will facilitate the development of future immunotherapy strategies and enhance precision targeting with existing agents.

Keywords: histopathology; immune subtype; immunotherapy; kinase activity; multiomic deconvolution; proteogenomics; tumor immunity.


Conflict of interest statement

Declaration of interests R. Sebra is currently a paid consultant and equity holder at GeneDx. L.C.C. is a founder and member of the board of directors of Agios Pharmaceuticals; is a founder and receives research support from Petra Pharmaceuticals; has equity in and consults for Cell Signaling Technologies, Volastra, Larkspur, and 1 Base Pharmaceuticals; and consults for Loxo-Lilly. J.L.J. has received consulting fees from Scorpion Therapeutics and Volastra Therapeutics. T.M.Y. is a co-founder and stockholder of DeStroke.

Figures

Figure 1.
Figure 1.. Derivation of immune subtypes
(A) Outline for the derivation of immune subtypes. First, multi-omic deconvolution was performed based on proteomics and RNA-seq to estimate cell type compositions in each tumor. In parallel, pathway scores of immune-related pathways derived based on proteomics were clustered to define 10 immune pathway modules. Finally, the estimated cell type fractions and the 10 immune module scores were integrated to cluster tumors into different immune subtypes. (B) Heatmap showing, for each cancer, the average of tumor cell percentage, immune and stromal scores, and cell type fractions. Significant differential levels between cancers (Bonferroni’s adjusted p value < 1%) are highlighted with a (*) (STAR Methods). (C) Association between cell type fractions and survival outcomes for each cancer. The heatmap displays p values (signed −log10 scale) from Cox-proportional hazard regression models. Associations significant at 10% FDR are displayed with black dots. (D) Kaplan-Meier curves showing cancer-specific associations between fractions of CD8 T cells and patient survival outcomes. For each cancer, tumors with high and low fractions of CD8 T cells were derived using the 1st and the 3rd quartiles, respectively. p values from logrank test are reported. (E) Heatmap showing, from top to bottom, (1) estimated cell type fractions by deconvolution analysis; (2 and 3) pathway scores of immune modules based on proteome and RNA, respectively; (4 and 5) protein and RNA expressions of cell type markers. The annotation track and the pie-plot on the top show the distribution of different tumors within immune subtypes. (F) Bar plot showing the proportion of samples allocated to different immune subtypes within each cancer.
Figure 2
Figure 2. Associations of immune subtypes with treatment responses, pathway activities, and patient demographic variables
. (A) Kaplen-Meier curves displaying associations between CD8+/IFNG+ and PFS for samples in the immunotherapy (left) and chemotherapy (right) arms in the phase III OAK clinical trial. p values from logrank test are reported. (B) Bubble plot showing summary statistics of association analyses between immune subtypes and biological pathways. Bubble sizes correspond to Benjamini-Hochberg adjusted p values (−log10 scale), while bubble colors correspond to the mean differences between the averaged pathway score for samples in one immune subtype and that of the other subtypes. (C) Bubble plot showing pathway analysis results as in (B), but for pathways found activated solely based on proteomics. (D) Pan-cancer association between immune subtypes and demographic variables. Error bars correspond to 95% confidence intervals of odds ratios. (E) Boxplots for pathway scores of Epithelial Mesenchymal Transition (EMT) and Interferon Gamma Signaling (IFNG) pathways among HNSCC cancers stratified by smoking status. (*) indicates significant p values (< 0.05) based on the Wilcoxon signed rank test.
Figure 3.
Figure 3.. Association of immune subtypes with DNA alterations$$PARABREAKHERE$$(A) Bar plot showing the total number of mutations per gene stratified by cancer.
(B) Pan-cancer association between mutation profiles and immune traits based on elastic-net regressions. Red and blue entries correspond to positive and negative coefficients in the regression model, respectively. (C) Heatmaps showing, for each gene, the association between its mutation status and its RNA/protein expressions in each cancer. Colors in the heatmap correspond to log fold-change (log FC) of the expressions between mutant and wild-type samples. Significant associations (p value from two-sided Mann-Whitney U test < 0.05) are labeled with black dots. (D) Heatmaps showing the association between protein/RNA expression and immune subtype. Colors in the heatmap represent signed −log10 Benjamini-Hochberg adjusted p values. Significant associations (adjusted p value < 10%) are labeled with black dots. (E) Heatmap displaying pan-cancer association between CNV and immune traits. For each cancer, the bar plot on the top shows the proportion of samples with more than 50% of the genes depleted (blue) or amplified (red) in the corresponding chromosome region. The heatmap shows, for each chromosome, the number of genes whose copy-number values were positively or negatively associated with the immune axes, represented in red and blue, respectively. (F) Manhattan plot summarizing the pan-cancer association between gene-level CNV data and the Wound Healing Proliferation module for selected chromosomes. The y axis shows −log10 p value from linear regression. (G) Heatmap displaying, for each cancer, the pathways over-represented in the set of pProteins and eGenes. Significant enrichments at 10% FDR are displayed with a black dot for pProteins and a white square for eGenes.
Figure 4.
Figure 4.. Association of immune subtypes with DNA methylations
(A) Heatmap illustrating DNAm associations with immune subtypes for a set of genes exhibiting significant associations in at least two cancers or in the pan-cancer analysis (STAR Methods). The color gradients represent the average (standardized) DNAm levels within tumors from each immune subtype stratified by cancers (left) or the average Z scores across tumors in each immune subtype across all cancers (right) for different omics (DNAm, RNA, and proteins). Significant associations (FDR < 10%) are labeled with black dots. (B) Heatmap illustrating DNAm associations with immune subtypes as in (A) for the topmost significant genes whose DNAm was associated with immune subtypes in only one cancer (FDR < 10%). (C) Diagram of the mediation analysis. (D) Heatmap illustrating three association analyses for each gene in each cancer: COSMIC smoking signature vs. DNAm (left), DNAm vs. immune subtype (middle), and smoking-mediated DNAm vs. immune subtype (right) for a subset of genes with significant mediation effects. In addition, the Lung N column summarizes DNAm-smoking associations as reported by a previous study on normal human lung tissues. The genes shown in this panel were selected based on consistent association trends between DNAm and smoking in LUAD and in normal lung tissues (Lung N). Significant associations (FDR < 10%) are labeled with black dots. (E) Volcano plots summarizing the association strengths in terms of Z scores (x axis) and signed p value (−log10 scale) (y axis) between DNAm and COSMIC smoking signatures for the subset of genes considered in the mediation analysis. (F) Boxplots showing the distributions of DNAm levels of PYCR1 across immune subtypes, considering the union of HNSCC, LUAD, and LSCC samples. p values from ANOVA test are reported (**p value <0.01; *p value < 0.05, ns, not significant).
Figure 5.
Figure 5.. Associations of immune subtypes with kinases activities
Kinases are reported as gene symbols followed by protein symbols in parenthesis. (A) Left: bubble plot showing pathways associated with different immune subtypes based on RNA-seq and proteomics. Bubble color represents the differential mean of pathway score in each subtype compared with all other subtypes, while the bubble size illustrates the Benjamini-Hochberg adjusted p value (−log10 scale). Middle: for each pathway, the plots show kinases whose activation was found differential across immune subtype at the pan-cancer level (adjusted p value < 10%) via the Kinase Library. The color of the bubble corresponds to the log2 frequency factor from the contingency table (log2 frequency factors [FF]), while the size of the bubble to the adjusted p value. Right: for some key kinases, the cancer-specific activation in CD8+/IFNG+ and CD8−/IFNG− are shown using similar bubble plot. (B) Heatmap showing the associations between KEA3-based kinase activity and immune subtypes in each cancer for selected kinases. Significant associations (adjusted p value < 10%) are highlighted with a black dot. The columns on the left illustrate the overall associations between each kinase and immune subtypes from ANOVA test for each cancer. The columns on the right show the membership of kinases in immune-related pathways. The annotation track on the top illustrates whether adjacent normal tissue was considered for normalization (T/N) or not (T) when deriving KEA3 scores for each cancer.
Figure 6.
Figure 6.. Kinase-TF regulation and cell-type-specific kinase activation
(A) Kinase-TF modules from the top 1% scored kinase-TF pairs for hot and cold tumors. Arrowheads are assigned to consistent up- and down-regulations, and plungers to different signs of associations between kinases and TFs. Each module was labeled according to the most relevant pathway identified by Enrichr. Genes contained in the pathway are highlighted in bold. (B) The diagram at the top depicts the proposed mechanism. The top bar plot (black) displays the number of genes overlapping between the sets of upregulated genes following each kinase CRISPR-Cas knockout and the experimentally determined targets of CEBPB from ENCODE ChIP-seq (STAR Methods). The middle bar plot (gray) shows the p values from Fisher’s exact test for testing whether the overlapping gene sets are significantly larger than what would occur by random chance. The bottom bar plot (blue) illustrates the enrichment of the kinase perturbation L1000 signatures for the Innate Immune System R-HSA-168249 Reactome pathway. The red lines indicate the level of 0.05. Cell line names are listed in parentheses, and their primary disease associations are: A549: lung cancer, AGS: gastric cancer, YAPC: pancreatic cancer, BICR6: head and neck cancer, A375: skin cancer. (C) Cell-type-specific kinase activation via KEA3 and the Kinase Library. The color of the heatmap represents the signed p value (−log10 scale) from enrichment analysis. Red color represents activation in tumor cells; while blue color represents activation in immune/stromal cells. For kinases with a Pearson’s correlation between activity score and RNA expression higher than 0.2, we show the log2 fold-change (log2 FC) of gene expression between tumor cells and immune/stromal cells based on scRNA (right side). Significant associations (FDR < 10%) are displayed with a black dot. From top to bottom, we present deactivation in cold tumor cells, activation in cold tumor cells, deactivation in hot tumor cells, and activation in hot tumor cells. (D) Differential kinase activity changes of FYN between different cell types (purple bars) and fold-changes of FYN gene expression between tumor cells and immune/stromal cells based on scRNA (light gray bars). The differential kinase activity results are displayed as signed p values (−log10 scale).
Figure 7.
Figure 7.. Histopathology assessment of immune subtypes
(A) Bar plots showing AUCs for predicting hot versus cold tumors based on histopathology images across different cancers. For each cancer, both single-cancer and pan-cancer models are reported. Error bars correspond to standard error across 4-fold tests. (B) Based on pan-cancer model, imaging features are extracted from the penultimate layer and separated with tSNE clustering. The top-right plot shows the separation by the model’s prediction scores, and bottom-left is color-coded by the true label. Each point represents a different tile. Tiles are bordered with their respective cancer-type color. Selected tiles are zoomed in (top-left and bottom-right) to appreciate differences with immune infiltration. (C) Bar plot reporting Pearson’s correlation between cell type fractions and image prediction probabilities. (D) tSNE plot color-coded with the cell type scores. (E) Bubble plot showing Pearson’s correlation between cellular morphology and cytokine expression pathways at a pan-cancer level. The size of the bubble corresponds to p value from correlation test.

Similar articles

  • Proteogenomic data and resources for pan-cancer analysis.
    Li Y, Dou Y, Da Veiga Leprevost F, Geffen Y, Calinawan AP, Aguet F, Akiyama Y, Anand S, Birger C, Cao S, Chaudhary R, Chilappagari P, Cieslik M, Colaprico A, Zhou DC, Day C, Domagalski MJ, Esai Selvan M, Fenyö D, Foltz SM, Francis A, Gonzalez-Robles T, Gümüş ZH, Heiman D, Holck M, Hong R, Hu Y, Jaehnig EJ, Ji J, Jiang W, Katsnelson L, Ketchum KA, Klein RJ, Lei JT, Liang WW, Liao Y, Lindgren CM, Ma W, Ma L, MacCoss MJ, Martins Rodrigues F, McKerrow W, Nguyen N, Oldroyd R, Pilozzi A, Pugliese P, Reva B, Rudnick P, Ruggles KV, Rykunov D, Savage SR, Schnaubelt M, Schraink T, Shi Z, Singhal D, Song X, Storrs E, Terekhanova NV, Thangudu RR, Thiagarajan M, Wang LB, Wang JM, Wang Y, Wen B, Wu Y, Wyczalkowski MA, Xin Y, Yao L, Yi X, Zhang H, Zhang Q, Zuhl M, Getz G, Ding L, Nesvizhskii AI, Wang P, Robles AI, Zhang B, Payne SH; Clinical Proteomic Tumor Analysis Consortium. Li Y, et al. Cancer Cell. 2023 Aug 14;41(8):1397-1406. doi: 10.1016/j.ccell.2023.06.009. Cancer Cell. 2023. PMID: 37582339 Free PMC article. Review.
  • A proteogenomics data-driven knowledge base of human cancer.
    Liao Y, Savage SR, Dou Y, Shi Z, Yi X, Jiang W, Lei JT, Zhang B. Liao Y, et al. Cell Syst. 2023 Sep 20;14(9):777-787.e5. doi: 10.1016/j.cels.2023.07.007. Epub 2023 Aug 23. Cell Syst. 2023. PMID: 37619559 Free PMC article.
  • Proteogenomic Characterization of Bladder Cancer Reveals Sensitivity to Apoptosis Induced by Tumor Necrosis Factor-related Apoptosis-inducing Ligand in FGFR3-mutated Tumors.
    Groeneveld CS, Sanchez-Quiles V, Dufour F, Shi M, Dingli F, Nicolle R, Chapeaublanc E, Poullet P, Jeffery D, Krucker C, Maillé P, Vacherot F, Vordos D, Benhamou S, Lebret T, Micheau O, Zinovyev A, Loew D, Allory Y, de Reyniès A, Bernard-Pierrot I, Radvanyi F. Groeneveld CS, et al. Eur Urol. 2024 May;85(5):483-494. doi: 10.1016/j.eururo.2023.05.037. Epub 2023 Jun 27. Eur Urol. 2024. PMID: 37380559
  • Proteogenomic characterization of 2002 human cancers reveals pan-cancer molecular subtypes and associated pathways.
    Zhang Y, Chen F, Chandrashekar DS, Varambally S, Creighton CJ. Zhang Y, et al. Nat Commun. 2022 May 13;13(1):2669. doi: 10.1038/s41467-022-30342-3. Nat Commun. 2022. PMID: 35562349 Free PMC article.
  • Proteogenomic interrogation of cancer cell lines: an overview of the field.
    Tsang O, Wong JWH. Tsang O, et al. Expert Rev Proteomics. 2021 Mar;18(3):221-232. doi: 10.1080/14789450.2021.1914594. Epub 2021 Apr 20. Expert Rev Proteomics. 2021. PMID: 33877947 Review.

Cited by

References

    1. Hanahan D, and Weinberg RA. (2011). Hallmarks of cancer: the next generation. Cell 144, 646–674. - PubMed
    1. Hiam-Galvez KJ, Allen BM, and Spitzer MH. (2021). Systemic immunity in cancer. Nat. Rev. Cancer 21, 345–359. - PMC - PubMed
    1. Li Y, Dou Y, Da Veiga Leprevost F, Geffen Y, Calinawan AP, Aguet F, Akiyama Y, Anand S, Birger C, Cao S, et al. (2023). Proteogenomic data and resources for pan-cancer analysis. Cancer Cell 41, 1397–1406. - PMC - PubMed
    1. Zheng L, Qin S, Si W, Wang A, Xing B, Gao R, Ren X, Wang L, Wu X, Zhang J, et al. (2021). Pan-cancer single-cell landscape of tumor-infiltrating T cells. Science 374, abe6474. - PubMed
    1. Thorsson V, Gibbs DL, Brown SD, Wolf D, Bortone DS, Ou Yang TH, Porta-Pardo E, Gao GF, Plaisier CL, Eddy JA, et al. (2018). The Immune Landscape of Cancer. Immunity 48, 812–830.e14. - PMC - PubMed