

Multiplex Profiling of Biomarker and Drug Uptake in Single Cells Using Microfluidic Flow Cytometry and Mass Spectrometry
- PMID: 38359901
- PMCID: PMC10906074
- DOI: 10.1021/acsnano.3c12803
Multiplex Profiling of Biomarker and Drug Uptake in Single Cells Using Microfluidic Flow Cytometry and Mass Spectrometry
Abstract
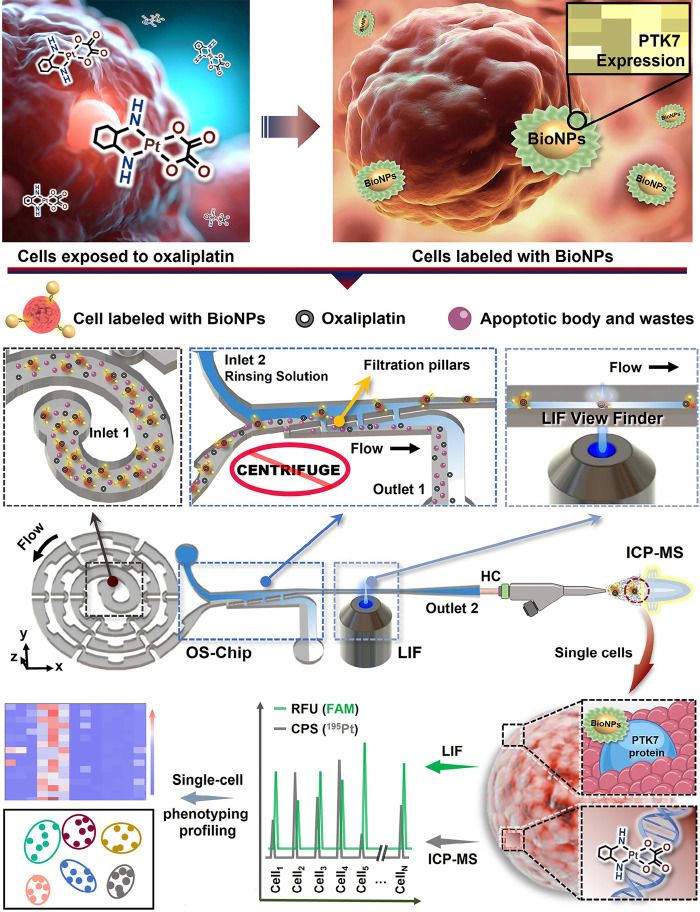
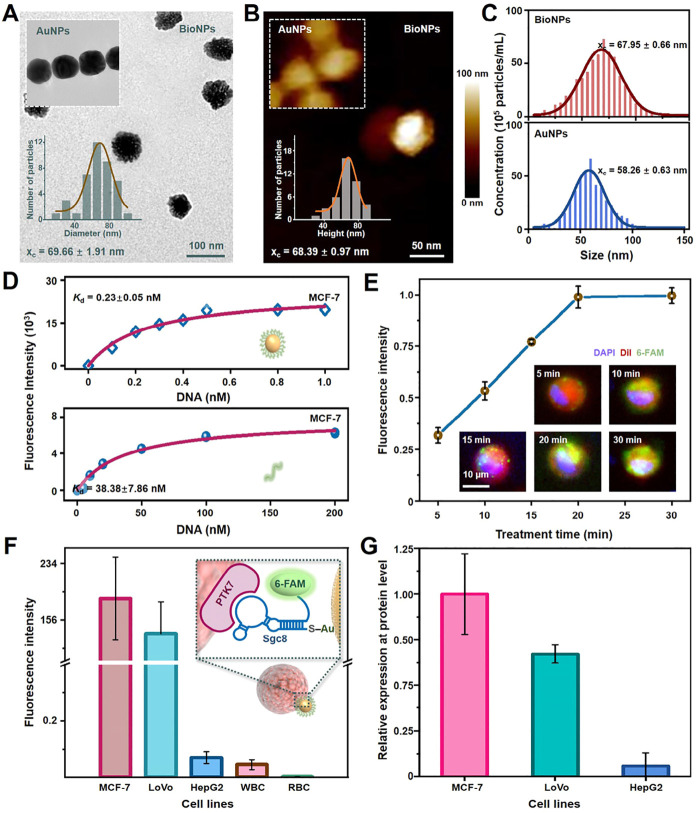
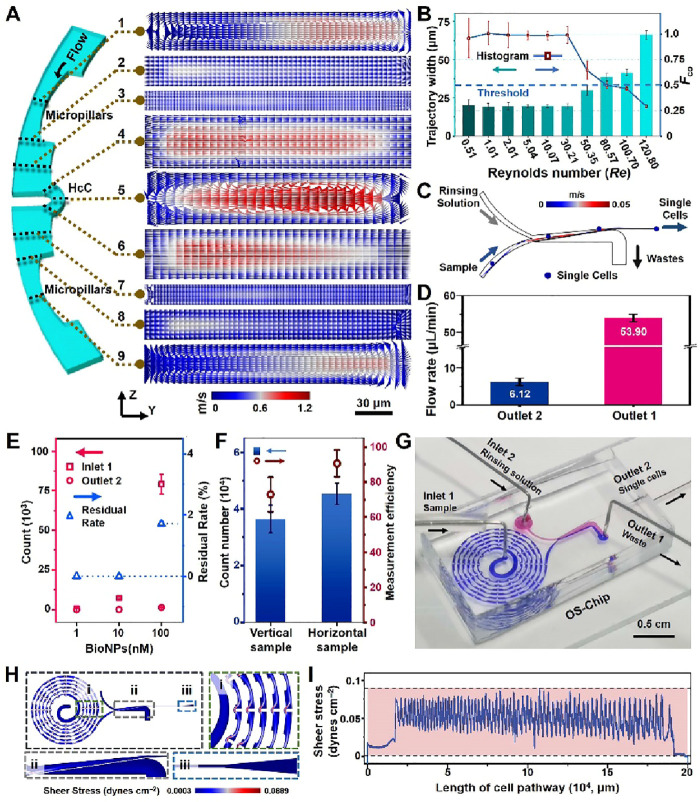
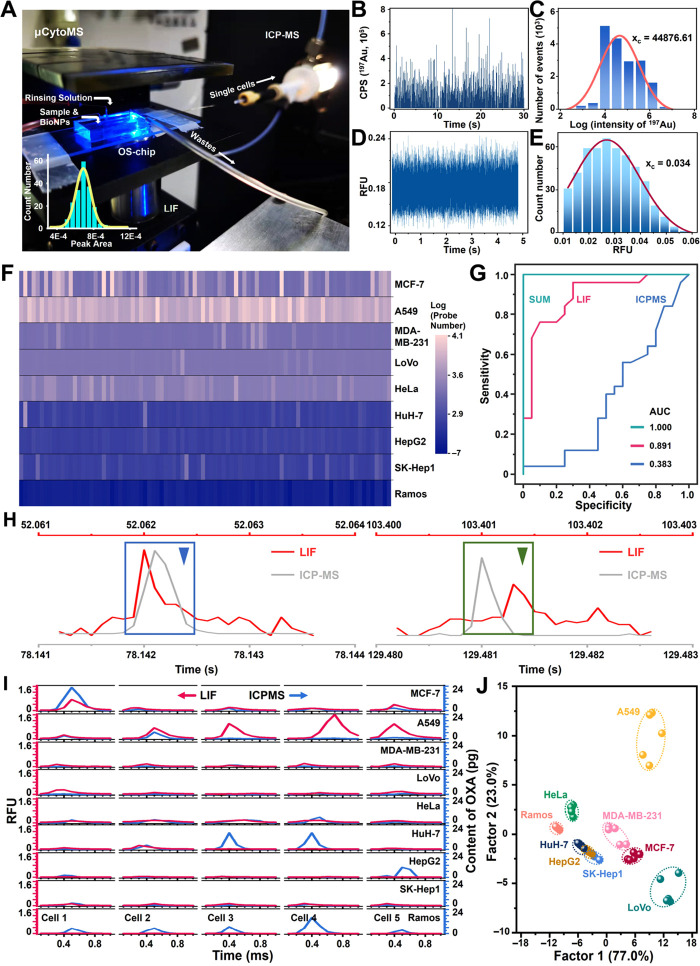
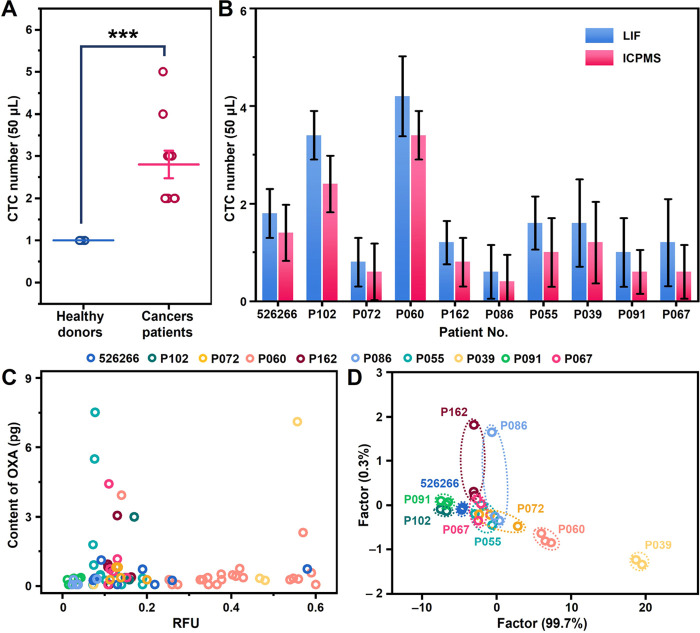
To perform multiplex profiling of single cells and eliminate the risk of potential sample loss caused by centrifugation, we developed a microfluidic flow cytometry and mass spectrometry system (μCytoMS) to evaluate the drug uptake and induced protein expression at the single cell level. It involves a microfluidic chip for the alignment and purification of single cells followed by detection with laser-induced fluorescence (LIF) and inductively coupled plasma mass spectrometry (ICP-MS). Biofunctionalized nanoprobes (BioNPs), conjugating ∼3000 6-FAM-Sgc8 aptamers on a single gold nanoparticle (AuNP) (Kd = 0.23 nM), were engineered to selectively bind with protein tyrosine kinase 7 (PTK7) on target cells. PTK7 expression induced by oxaliplatin (OXA) uptake was assayed with LIF, while ICP-MS measurement of 195Pt revealed OXA uptake of the drug in individual cells, which provided further in-depth information about the drug in relation to PTK7 expression. At an ultralow flow of ∼0.043 dyn/cm2 (20 μL/min), the chip facilitates the extremely fast focusing of BioNPs labeled single cells without the need for centrifugal purification. It ensures multiplex profiling of single cells at a throughput speed of 500 cells/min as compared to 40 cells/min in previous studies. Using a machine learning algorithm to initially profile drug uptake and marker expression in tumor cell lines, μCytoMS was able to perform in situ profiling of the PTK7 response to the OXA at single-cell resolution for tests done on clinical samples from 10 breast cancer patients. It offers great potential for multiplex single-cell phenotypic analysis and clinical diagnosis.
Keywords: biofunctionalized nanoprobes; flow cytometry; mass spectrometry; microfluidic chip; multiplex profiling; single-cell heterogeneity.
Conflict of interest statement
The authors declare no competing financial interest.
Figures
Similar articles
-
Dual-Multivalent-Aptamer-Conjugated Nanoprobes for Superefficient Discerning of Single Circulating Tumor Cells in a Microfluidic Chip with Inductively Coupled Plasma Mass Spectrometry Detection.ACS Appl Mater Interfaces. 2021 Sep 15;13(36):43668-43675. doi: 10.1021/acsami.1c11953. Epub 2021 Sep 2. ACS Appl Mater Interfaces. 2021. PMID: 34473482
-
A chip-based supersonic microfluidic nebulizer for efficient sample introduction into inductively coupled plasma - Mass spectrometry.Anal Chim Acta. 2022 Oct 9;1229:340342. doi: 10.1016/j.aca.2022.340342. Epub 2022 Sep 7. Anal Chim Acta. 2022. PMID: 36156219
-
Aptamer-facilitated mass cytometry.Anal Bioanal Chem. 2018 May;410(13):3047-3051. doi: 10.1007/s00216-018-1011-0. Epub 2018 Mar 20. Anal Bioanal Chem. 2018. PMID: 29556738
-
Continuous microfluidic 3D focusing enabling microflow cytometry for single-cell analysis.Talanta. 2021 Jan 1;221:121401. doi: 10.1016/j.talanta.2020.121401. Epub 2020 Jul 18. Talanta. 2021. PMID: 33076055 Review.
-
Microfluidic flow cytometry for blood-based biomarker analysis.Analyst. 2022 Jun 27;147(13):2895-2917. doi: 10.1039/d2an00283c. Analyst. 2022. PMID: 35611964 Review.
Cited by
-
Microfluidic technologies for wearable and implantable biomedical devices.Lab Chip. 2025 Sep 9;25(18):4542-4576. doi: 10.1039/d5lc00499c. Lab Chip. 2025. PMID: 40836841 Free PMC article. Review.
-
Pharmacokinetics-Pharmacodynamics Modeling for Evaluating Drug-Drug Interactions in Polypharmacy: Development and Challenges.Clin Pharmacokinet. 2024 Jul;63(7):919-944. doi: 10.1007/s40262-024-01391-2. Epub 2024 Jun 18. Clin Pharmacokinet. 2024. PMID: 38888813 Review.
-
Frontier Technologies in Single-Cell Analysis: Synergistic Fusion of Droplet Printing and High-Performance Detection System.Anal Sci Adv. 2025 Sep 6;6(2):e70041. doi: 10.1002/ansa.70041. eCollection 2025 Dec. Anal Sci Adv. 2025. PMID: 40917101 Free PMC article. Review.
-
Application of multivalent aptamers in tumor diagnosis, analysis and therapy (Review).Oncol Lett. 2025 May 2;30(1):325. doi: 10.3892/ol.2025.15071. eCollection 2025 Jul. Oncol Lett. 2025. PMID: 40370647 Free PMC article. Review.
References
-
- Qi L.; Zhang W. C.; Ren X. L.; Xu R. L.; Yang Z. M.; Chen R. Q.; Tu C.; Li Z. H. Cross-Talk of Multiple Types of RNA Modification Regulators Uncovers the Tumor Microenvironment and Immune Infiltrates in Soft Tissue Sarcoma. Frontiers in Immunology 2022, 13, 921223.10.3389/fimmu.2022.921223. - DOI - PMC - PubMed
Publication types
MeSH terms
Substances
LinkOut - more resources
Full Text Sources
Miscellaneous
