. 2024 Feb 15;16(1):44.
doi: 10.1186/s13098-024-01275-2.

Stress-induced hyperglycemia is associated with the mortality of thrombotic thrombocytopenic purpura patients

Affiliations

Stress-induced hyperglycemia is associated with the mortality of thrombotic thrombocytopenic purpura patients

Lingling Hu et al. Diabetol Metab Syndr. .

Abstract

Background: Thrombotic thrombocytopenic purpura (TTP) is a rare thrombotic microangiopathy with a rapid progression and high mortality rate. We aimed to explore early risk factors for mortality in patients with TTP.

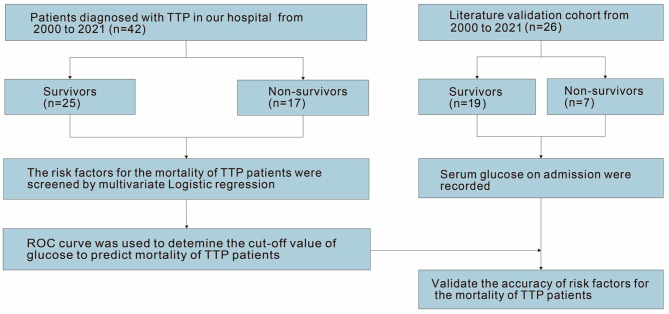
Methods: We conducted a retrospective analysis of 42 TTP patients that were admitted to our hospital between 2000 and 2021, with a median age of 49 (29-63) years. Risk factors for mortality were evaluated using multivariate logistic regression. Receiver operating characteristic curve analysis was used to determine the cut-off value of glucose for predicting mortality in patients, which was validated by comparison to a similar cohort in the published literature.

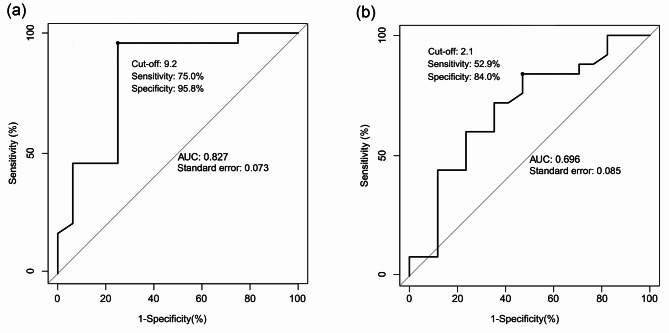
Results: Elevated glucose level and reduced red blood cells (RBC) counts were risk factors for mortality in patients with TTP (glucose, odds ratio and 95% confidence interval: 2.476 [1.368-4.484]; RBC, odds ratio and 95% confidence interval: 0.095 [0.011-0.799]). The area under the curve of glucose was 0.827, and the cut-off value was 9.2 mmol/L, with a sensitivity of 75.0% and specificity of 95.8%. A total of 26 cases from the validation cohort had a sensitivity of 71.0% and a specificity of 84.0%. The change trends of the TTP-related laboratory indices differed during hospitalization.

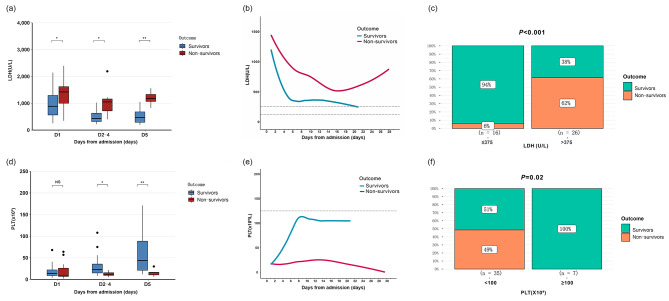
Conclusion: Hyperglycemia at admission and unstable blood glucose levels during hospitalization may be potential predictors of mortality for TTP patients. The improved prognosis was associated with the recovery of platelet counts and a significant decrease in serum lactate dehydrogenase after five days of treatment.

Keywords: Lactate dehydrogenase; Platelet; Prognosis; Thrombotic thrombocytopenic purpura.


Conflict of interest statement

The authors declare no competing financial interests.

Figures

Fig. 1
Fig. 1
Patient diagnosis and treatment flow. Between 2000 and 2021, 42 patients with TTP in our hospital were retrospectively enrolled, they were defined as survivors (25 cases) and non-survivors (17 cases) according to their survival status. A total of 26 TTP cases with serum glucose results on admission from published literature were collected as the external validation cohort, including 19 cases (73%) of survivors and 7 cases (27%) of non-survivors
Fig. 2
Fig. 2
Clinical information, diagnosis and treatment data of patients. The x-axis shows the length of stay, and each row shows information for each patient. The length of stay of the patients is shown with blue bars. The first plasma exchange and sampling time are shown on the blue bar. Comorbidities and other treatments (plasma infusion, glucocorticoid, etc.) are displayed beside the blue bar. Pos ANA: positive antinuclear antibody test
Fig. 3
Fig. 3
TTP risk factors and blood test dynamics during hospitalization. (a) Boxplots of blood glucose according to time distribution. (b) LOWESS chart of blood glucose levels during hospitalization. (c) Scatter plots depicting the relationship between glucose and LDH. (d) Boxplots of RBC according to time distribution. (e) LOWESS chart of RBC during hospitalization. (f) Scatter plots depicting the relationship between RBC and LDH. RBC: Red blood cells; LDH: lactate dehydrogenase. The correlation coefficient was obtained by spearman correlation analysis. * and ** indicate the P values of < 0.05, < 0.01, respectively; NS stands for no statistical difference
Fig. 4
Fig. 4
ROC curves for predicting mortality in patients with thrombotic thrombocytopenic purpura. (A) ROC curve of GLU; (B) ROC curve of RBC. GLU: blood glucose; RBC: red blood cells
Fig. 5
Fig. 5
PLT and LDH level changes between survivors and non-survivors. (a) Boxplots of LDH according to time. (b) LOWESS chart of LDH during hospitalization. (c) Histograms of LDH levels on the 5th day of admission. (d) Boxplots of PLT according to time distribution. (e) LOWESS chart of PLT during hospitalization. (f) Histograms of platelet counts on the 5th day of admission. LDH: lactate dehydrogenase; PLT: platelet counts. * and ** indicate the P values of < 0.05, < 0.01, respectively; NS stands for no statistical difference

Similar articles

References

    1. Sukumar S, Lammle B, Cataland SR. Thrombotic Thrombocytopenic Purpura: Pathophysiology, Diagnosis, and Management. J Clin Med (2021) 10(3). Epub 2021/02/06. 10.3390/jcm10030536. IF: 3.9 Q2 B3 IF: 3.9 Q2 B3 IF: 3.9 Q2 B3 IF: 3.9 Q2 B3 IF: 3.9 Q2 B3 IF: 3.9 Q2 B3 IF: 3.9 Q2 B3. - PMC - PubMed
    1. George JN. Clinical practice. Thrombotic Thrombocytopenic Purpura. N Engl J Med. 2006;354(18):1927–35. 10.1056/NEJMcp053024. IF: 158.5 Q1 B1 IF: 158.5 Q1 B1 IF: 158.5 Q1 B1 IF: 158.5 Q1 B1 IF: 158.5 Q1 B1 IF: 158.5 Q1 B1 IF: 158.5 Q1 B1. Epub 2006/05/05. - PubMed
    1. Joly BS, Coppo P, Veyradier A. Thrombotic Thrombocytopenic Purpura. Blood. 2017;129(21):2836–46. doi: 10.1182/blood-2016-10-709857. - DOI - PubMed
    1. Sadler JE. Pathophysiology of Thrombotic Thrombocytopenic Purpura. Blood. 2017;130(10):1181–8. 10.1182/blood-2017-04-636431. IF: 20.3 Q1 B1 IF: 20.3 Q1 B1 IF: 20.3 Q1 B1 IF: 20.3 Q1 B1 IF: 20.3 Q1 B1 IF: 20.3 Q1 B1 IF: 20.3 Q1 B1. Epub 2017/08/05. - PMC - PubMed
    1. Kremer Hovinga JA, Coppo P, Lammle B, Moake JL, Miyata T, Vanhoorelbeke K. Thrombotic Thrombocytopenic Purpura. Nat Rev Dis Primers (2017) 3:17020. Epub 2017/04/07. 10.1038/nrdp.2017.20. IF: 81.5 Q1 B1 IF: 81.5 Q1 B1 IF: 81.5 Q1 B1 IF: 81.5 Q1 B1 IF: 81.5 Q1 B1 IF: 81.5 Q1 B1 IF: 81.5 Q1 B1. - PubMed

LinkOut - more resources