. 2024 Feb 15;15(2):145.
doi: 10.1038/s41419-024-06503-1.

Cystine deprivation triggers CD36-mediated ferroptosis and dysfunction of tumor infiltrating CD8+ T cells

Affiliations

Cystine deprivation triggers CD36-mediated ferroptosis and dysfunction of tumor infiltrating CD8+ T cells

Chenfeng Han et al. Cell Death Dis. .

Abstract

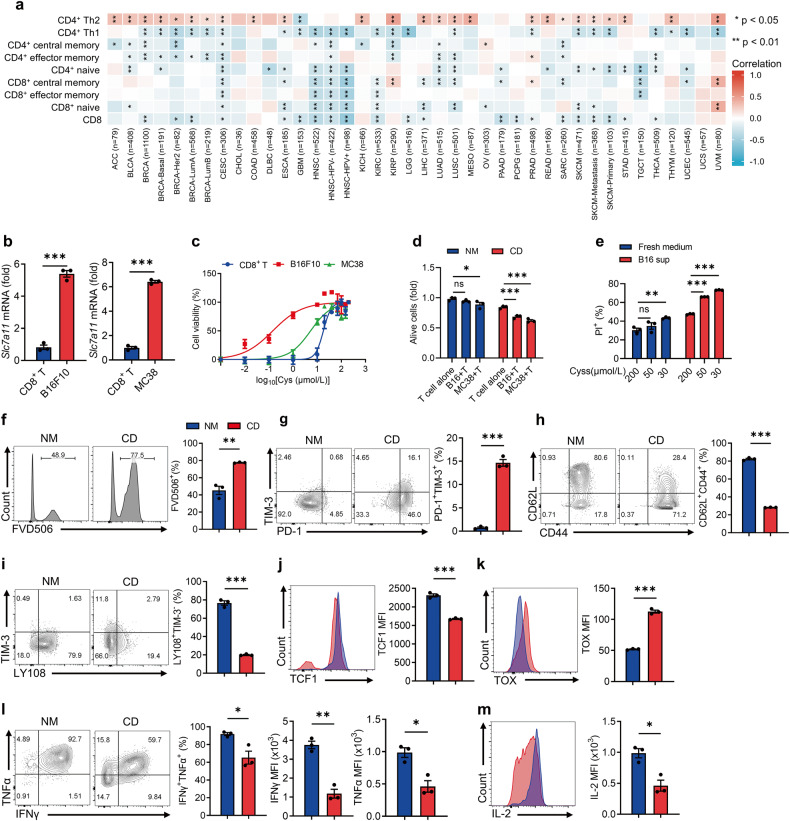
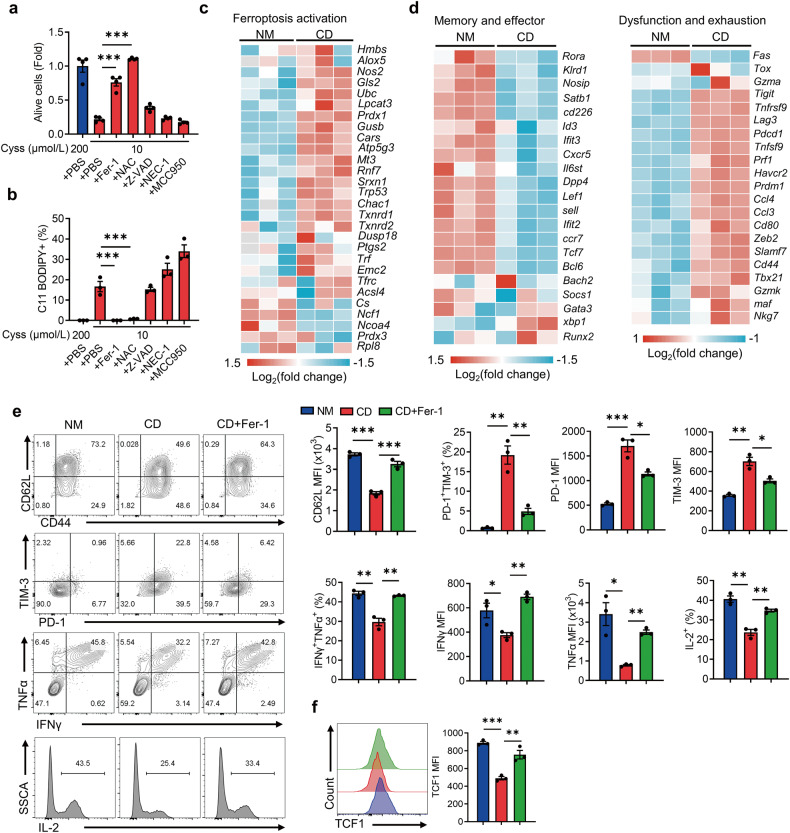
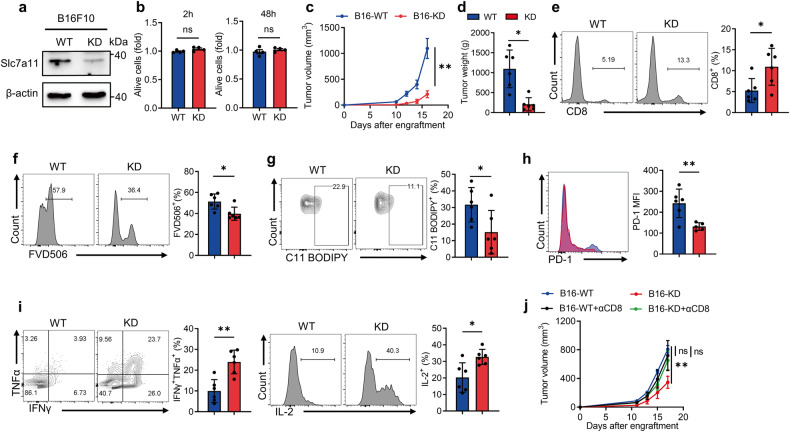
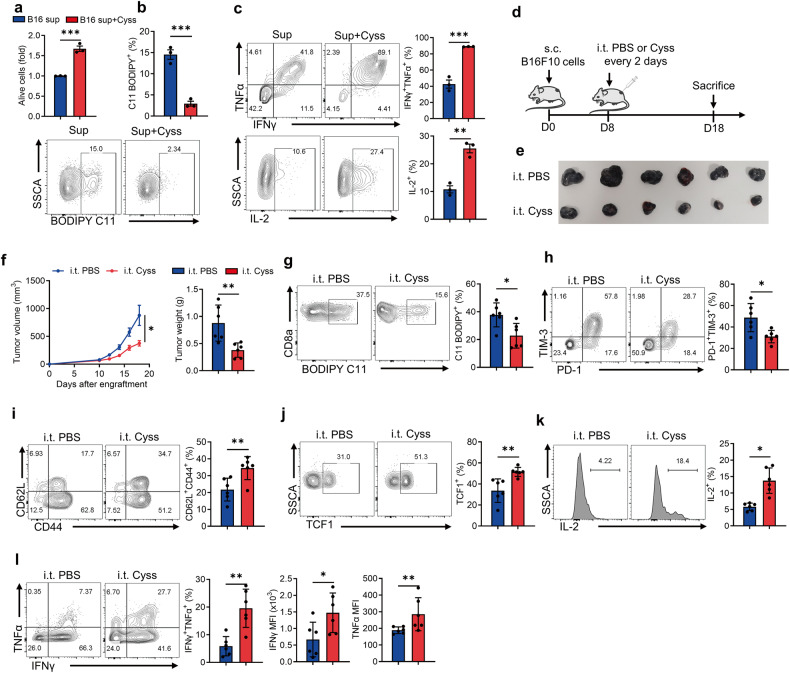
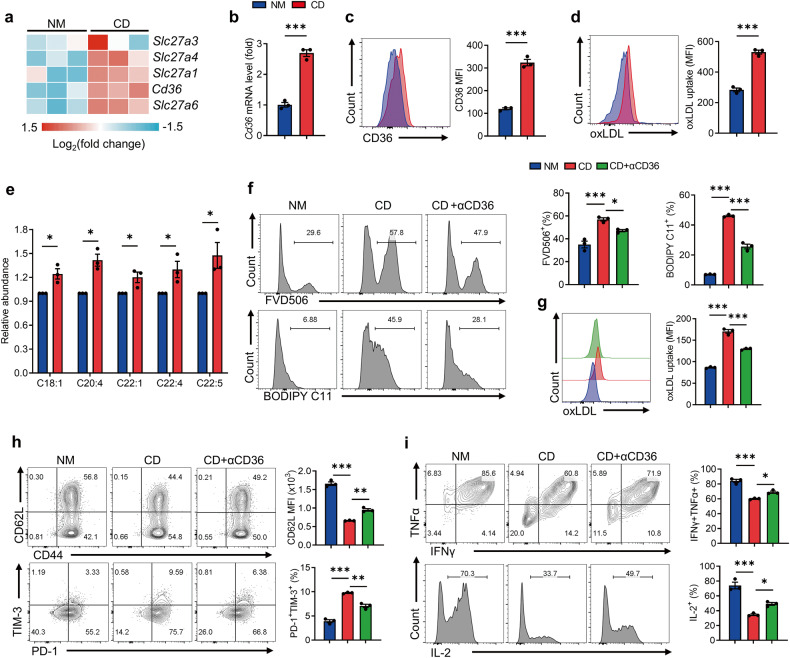
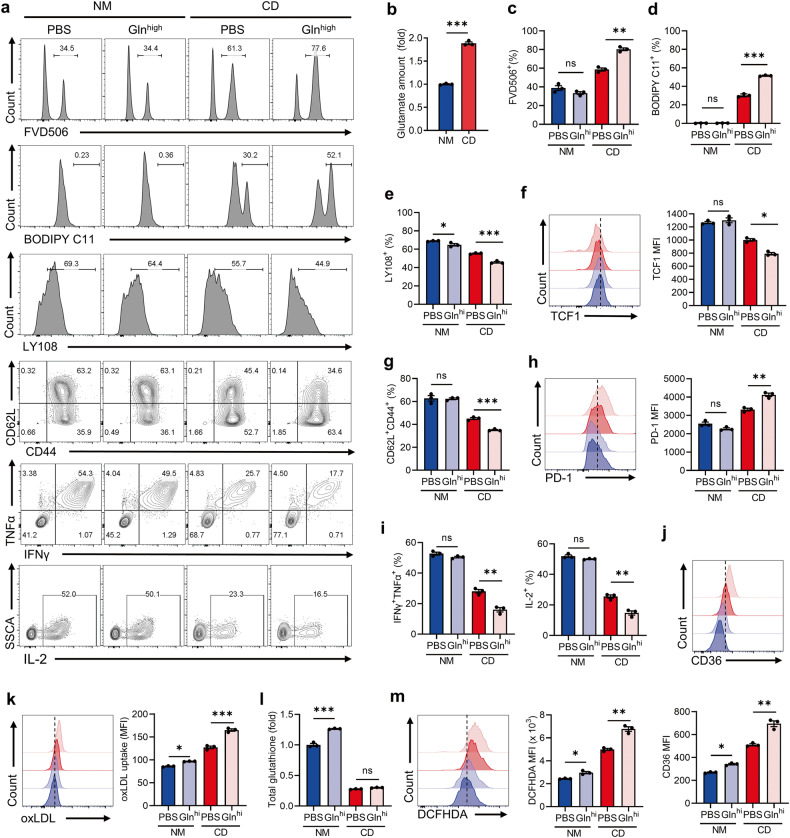
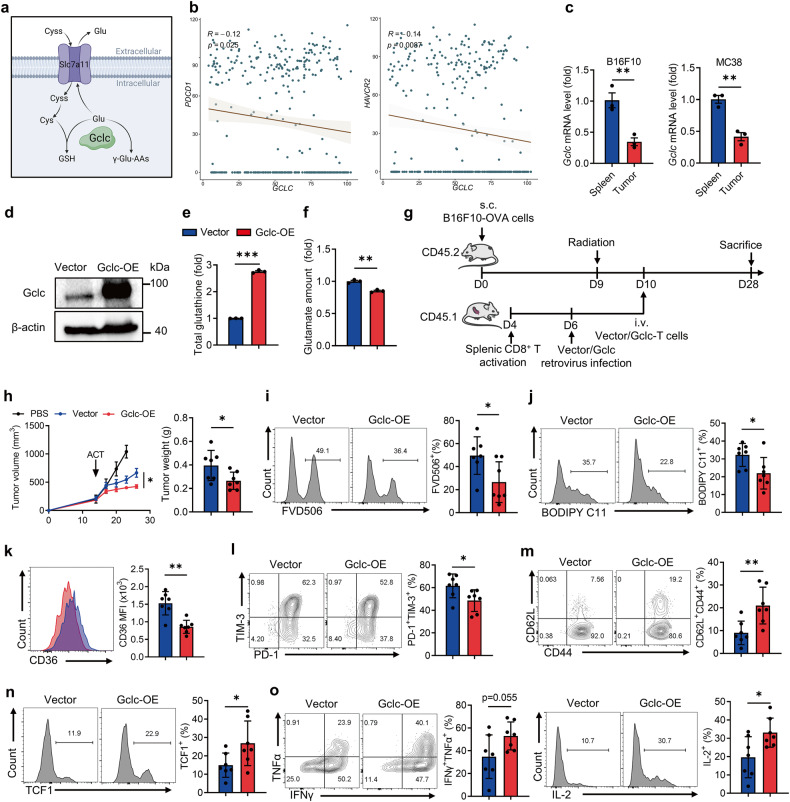
Cancer cells develop multiple strategies to evade T cell-mediated killing. On one hand, cancer cells may preferentially rely on certain amino acids for rapid growth and metastasis. On the other hand, sufficient nutrient availability and uptake are necessary for mounting an effective T cell anti-tumor response in the tumor microenvironment (TME). Here we demonstrate that tumor cells outcompete T cells for cystine uptake due to high Slc7a11 expression. This competition induces T-cell exhaustion and ferroptosis, characterized by diminished memory formation and cytokine secretion, increased PD-1 and TIM-3 expression, as well as intracellular oxidative stress and lipid-peroxide accumulation. Importantly, either Slc7a11 deletion in tumor cells or intratumoral cystine supplementation improves T cell anti-tumor immunity. Mechanistically, cystine deprivation in T cells disrupts glutathione synthesis, but promotes CD36 mediated lipid uptake due to dysregulated cystine/glutamate exchange. Moreover, enforced expression of glutamate-cysteine ligase catalytic subunit (Gclc) promotes glutathione synthesis and prevents CD36 upregulation, thus boosting T cell anti-tumor immunity. Our findings reveal cystine as an intracellular metabolic checkpoint that orchestrates T-cell survival and differentiation, and highlight Gclc as a potential therapeutic target for enhancing T cell anti-tumor function.


Conflict of interest statement

The authors declare no competing interests.

Figures

Fig. 1
Fig. 1. Competitive uptake of cystine by tumor cells leads to T-cell exhaustion and death.
a Analysis of the correlation between immune infiltration and SLC7A11 expression in tumors via TIMER 2.0 database. b Slc7a11 mRNA expression in CD8+ T effector cells and tumor cells (n = 3 per group). c CD8+ T, B16F10, and MC38 cells were cultured with varying cystine concentrations, and cell viability was detected by CCK8 assay (n = 3 per group, CD8+ T EC50 = 18.05, B16F10 EC50 = 0.1444, MC38 EC50 = 5.326). d CD8+ T cells and B16F10 cells were co-cultured at 1:1 for 24 h in NM and CD, and cell viability was detected by CCK8 assay (n = 3 per group). e CD8+ T cells were cultured for 24 h in fresh medium or B16F10 cell supernatant with varying cystine concentrations, and the percentages of dead cells were detected by flow cytometry (n = 3 per group). fm Effects of prolonged cystine starvation on CD8+ T-cell differentiation and death. T cells were cultured in NM or CD for 72 h (n = 3 per group), and the percentages of dead cells (f), PD-1+TIM-3+ subset (g), CD62L+CD44+ subset (h), LY108+TIM-3- subset (i), and the levels of TCF1 (j) and TOX (k) were detected by flow cytometry. IFNγ, TNFα (l), and IL-2 (m) secretion was measured after re-stimulation. Each symbol represents one individual. Data are presented as mean ± s.e.m. p values are measured by two-tailed unpaired Student’s t test (b, fm) and one-way ANOVA with Tukey’s multiple comparison test (d, e). *p < 0.05, **p < 0.01, ***p < 0.001.
Fig. 2
Fig. 2. Cystine deprivation triggers evident ferroptosis and exhaustion of CD8+ T cells.
a, b T cells were cultured in 10 μmol/L cystine medium containing Fer-1, NAC, Z-VAD, NEC-1, and MCC950, respectively (n = 3 per group). Cell viability was detected via CCK8 assay (a), and lipid peroxidation was measured via C11 BODIPY staining (b). c, d RNA-seq analysis of ferroptosis activation-related genes, memory/effector-related genes and dysfunction/exhaustion-related genes of T cells cultured in NM or CD (n = 3 per group). e, f Flow cytometry analysis of CD62L expression, PD-1+TIM-3+ T-cell subset, cytokine secretion (e) and TCF1 expression (f) of the indicated T cells (n = 3 per group). Each symbol represents one individual. Data are presented as mean ± s.e.m. p values are measured by one-way ANOVA with Tukey’s multiple comparison test. *p < 0.05, **p < 0.01, ***p < 0.001.
Fig. 3
Fig. 3. Inhibition of cystine uptake by tumor cells alleviates ferroptosis of CD8+ T cells and enhances anti-tumor immunity.
a Western blot analysis of Slc7a11 expression in WT and Slc7a11-KD B16F10 cells. b CCK8 assay measuring cell viability of WT and KD B16F10 cells after 2 h and 48 h in vitro culturing (n = 4 per group). c, d Tumor volume (c) and tumor weight (d) of WT and KD B16F10 tumors (n = 6 per group). e Flow cytometry measuring the percentages of tumor-infiltrating CD8+ T cells in WT and KD tumors. f The percentages of dead CD8+ T cells in WT and KD tumors. g Lipid peroxidation of CD8+ T cells in WT and KD tumors. h PD-1 expression of CD8+ T cells in WT and KD tumors (one outlier was removed from KD). i Levels of IFNγ, TNFα, and IL-2 secretion of the indicated T cells. j Tumor volume of WT and KD tumors after CD8 antibody administration (WT: n = 4; KO: n = 5; WT + αCD8: n = 5; KD + αCD8: n = 6). Each symbol represents one individual. Data are mean ± s.e.m. p values are measured by two-tailed unpaired Student’s t test. Ns not significant, *p < 0.05, **p < 0.01.
Fig. 4
Fig. 4. Cystine supplementation inhibits CD8+ T-cell ferroptosis and boosts anti-tumor immunity.
ac CD8+ T cells were incubated in B16F10 supernatant with PBS or additional 200 μmol/L cystine for 48 h (n = 3 per group), and cell viability was detected by CCK8 assay (a). The levels of lipid peroxidation were detected using BODIPY C11 staining (b). Cytokine secretion by the indicated T cells was measured by flow cytometry (c). d Diagram of intratumoral injection of PBS or cystine in B16F10 tumors (n = 6 per group). e, f Tumor size (e), tumor volume and tumor weight (f) of the indicated groups. g The levels of lipid peroxidation in the indicated tumor-infiltrating CD8+ T cells. hj Flow cytometry analysis of the percentages of PD-1+TIM-3+ subset (h), CD62L+CD44+ subset (i), and TCF1 expression (j) in the tumor-infiltrating CD8+ T cells. k, l IL-2 (k), IFNγ and TNFα secretion (l) of the indicated T cells. Each symbol represents one individual. Data are mean ± s.e.m. p values are measured by two-tailed unpaired Student’s t test. *p < 0.05, **p < 0.01, ***p < 0.01.
Fig. 5
Fig. 5. Cystine deprivation upregulates CD36 which causes lipid accumulation and ferroptosis in T cells.
a RNA-seq analysis of fatty acid uptake-related genes in the indicated T cells (n = 3 per group). b, c RT-qPCR (b) and flow cytometry (c) analysis of T-cell CD36 expression cultured in NM or CD (n = 3 per group). d oxLDL uptake assay of the indicated CD8+ T cells via oxLDL-DyLight 488 staining (n = 3 per group). e Polyunsaturated fatty acid levels in the indicated CD8+ T cells (n = 3 per group). f CD8+ T cells were cultured in NM, CD, or CD + αCD36 medium for 72 h (n = 3 per group). The levels of cell death and lipid peroxidation in the indicated T cells were assessed by flow cytometry. g, h Flow cytometry analysis of the oxLDL uptake (g), the percentages of CD44+CD62L+ subset, and PD-1+TIM-3+ subset (h) of the indicated T cells. i IFNγ, TNFα and IL-2 secretion of the indicated T cells. Each symbol represents one individual. Data are mean ± s.e.m. p values are measured by two-tailed unpaired Student’s t test (be) and one-way ANOVA with Tukey’s multiple comparison test (fi). *p < 0.05, **p < 0.01, ***p < 0.001.
Fig. 6
Fig. 6. Cystine deprivation triggers glutamate accumulation and CD36 elevation.
a Representative plots of the FVD506+, BODIPY C11+, LY108+, CD62L+CD44+ subsets and cytokine-secretion levels of the indicated T cells (n = 3 per group). b Glutamate content of CD8+ T cells in the indicated groups. ch T cells were cultured in NM, CD, NM-high glutamine and CD-high glutamine for 48 h. The FVD506+ subset (c), BODIPY C11+ subset (d), LY108+ subset (e), TCF1 expression (f), CD62L+CD44+ subset (g), PD-1 expression (h), and the levels of cytokine secretion (i) in the indicated T cells were measured by flow cytometry. j The representative plot (top) and quantitative analysis (bottom) of CD36 expression of the indicated T cells. k Flow cytometry analysis of oxLDL-DyLight-488 MFI of indicated T cells. l Quantification of total glutathione in the indicated T cells. m Intracellular ROS detection of the Indicated T cells incubated with DCFHDA. Each symbol represents one individual. Data are mean ± s.e.m. p values are measured by two-tailed unpaired Student’s t test (b) and one-way ANOVA with Tukey’s multiple comparison test (cm). Ns not significant, *p < 0.05, **p < 0.01, ***p < 0.001.
Fig. 7
Fig. 7. Enforced Gclc expression in CD8+ T cells limits ferroptosis and boosts anti-tumor immunity.
a Diagram of Gclc’s dual role for consuming intracellular glutamate. b Correlation analysis of PDCD1, HAVCR2 and GCLC expression in tumor-infiltrating CD8+ T cells from melanoma patients (GSE120575 [56]). c RT-qPCR analysis of Gclc expression of CD8+ T cells from B16F10 and MC38 tumors and spleens (n = 3 per group). d Western blot assay of Gclc expression of the indicated T cells. e Quantification of total glutathione in vector and Gclc-OE T cells culturing in NM (n = 3 per group). f Glutamate content of vector and Gclc-OE T cells cultured in CD (n = 3 per group). g Diagram of adoptive transfer of vector and Gclc-OE T cells in B16F10-OVA tumors. h Tumor volume and tumor weight of the indicated groups (n = 7 per group). i, j The percentages of FVD506+ subset (i) and BODIPY C11+ subset (j) of the indicated tumor-infiltrating T cells. k CD36 expression of the indicated tumor-infiltrating T cells. lo The percentages of PD-1+TIM-3+ subset (l), CD62L+CD44+ subset (m), TCF1+ subset (n), and the levels of cytokine secretion (o) of the indicated tumor-infiltrating T cells. Each symbol represents one individual. Data are mean ± s.e.m. p values are measured by two-tailed unpaired Student’s t test. *p < 0.05, **p < 0.01.

References

    1. Rosenberg SA, Restifo NP. Adoptive cell transfer as personalized immunotherapy for human cancer. Science. 2015;348:62–8. doi: 10.1126/science.aaa4967. - DOI - PMC - PubMed
    1. Finck AV, Blanchard T, Roselle CP, Golinelli G, June CH. Engineered cellular immunotherapies in cancer and beyond. Nat Med. 2022;28:678–89. doi: 10.1038/s41591-022-01765-8. - DOI - PMC - PubMed
    1. Met Ö, Jensen KM, Chamberlain CA, Donia M, Svane IM. Principles of adoptive T cell therapy in cancer. Semin Immunopathol. 2019;41:49–58. doi: 10.1007/s00281-018-0703-z. - DOI - PubMed
    1. DePeaux K, Delgoffe GM. Metabolic barriers to cancer immunotherapy. Nat Rev Immunol. 2021;21:785–97. doi: 10.1038/s41577-021-00541-y. - DOI - PMC - PubMed
    1. Kishton RJ, Sukumar M, Restifo NP. Metabolic regulation of T cell longevity and function in tumor immunotherapy. Cell Metab. 2017;26:94–109. doi: 10.1016/j.cmet.2017.06.016. - DOI - PMC - PubMed

Publication types

LinkOut - more resources