. 2024 Apr 3;44(14):e1806232024.
doi: 10.1523/JNEUROSCI.1806-23.2024.

GABAergic/Glycinergic and Glutamatergic Neurons Mediate Distinct Neurodevelopmental Phenotypes of STXBP1 Encephalopathy

Affiliations

GABAergic/Glycinergic and Glutamatergic Neurons Mediate Distinct Neurodevelopmental Phenotypes of STXBP1 Encephalopathy

Joo Hyun Kim et al. J Neurosci. .

Abstract

An increasing number of pathogenic variants in presynaptic proteins involved in the synaptic vesicle cycle are being discovered in neurodevelopmental disorders. The clinical features of these synaptic vesicle cycle disorders are diverse, but the most prevalent phenotypes include intellectual disability, epilepsy, movement disorders, cerebral visual impairment, and psychiatric symptoms ( Verhage and Sørensen, 2020; Bonnycastle et al., 2021; John et al., 2021; Melland et al., 2021). Among this growing list of synaptic vesicle cycle disorders, the most frequent is STXBP1 encephalopathy caused by de novo heterozygous pathogenic variants in syntaxin-binding protein 1 (STXBP1, also known as MUNC18-1; Verhage and Sørensen, 2020; John et al., 2021). STXBP1 is an essential protein for presynaptic neurotransmitter release. Its haploinsufficiency is the main disease mechanism and impairs both excitatory and inhibitory neurotransmitter release. However, the disease pathogenesis and cellular origins of the broad spectrum of neurological phenotypes are poorly understood. Here we generate cell type-specific Stxbp1 haploinsufficient male and female mice and show that Stxbp1 haploinsufficiency in GABAergic/glycinergic neurons causes developmental delay, epilepsy, and motor, cognitive, and psychiatric deficits, recapitulating majority of the phenotypes observed in the constitutive Stxbp1 haploinsufficient mice and STXBP1 encephalopathy. In contrast, Stxbp1 haploinsufficiency in glutamatergic neurons results in a small subset of cognitive and seizure phenotypes distinct from those caused by Stxbp1 haploinsufficiency in GABAergic/glycinergic neurons. Thus, the contrasting roles of excitatory and inhibitory signaling reveal GABAergic/glycinergic dysfunction as a key disease mechanism of STXBP1 encephalopathy and suggest the possibility to selectively modulate disease phenotypes by targeting specific neurotransmitter systems.

Keywords: epilepsy; excitation; inhibition; intellectual disability; neurobehavior; synapse.


Figures

Figure 1.
Figure 1.
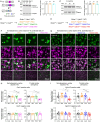
Generation and validation of Viaat-cHet and Vglut2-cHet mice. A, Genomic structures of Stxbp1 WT, tm1c (flox), and tm1d (KO) alleles. In the flox allele, exon 7 is flanked by two loxP sites. Cre-mediated recombination in the flox allele deletes exon 7, resulting in the KO allele with an early stop codon in exon 8. E, exon; FRT, Flp recombination site; loxP, Cre recombination site. B, Left, A representative Western blot of proteins from the brains of WT, Stxbp1f/+, and Stxbp1f/f mice at P0. Stxbp1 was detected by an antibody recognizing its C terminus. Gapdh, a housekeeping protein as loading control. Right, summary data of normalized Stxbp1 protein levels at P0. Stxbp1 levels were first normalized by the Gapdh levels and then by the average Stxbp1 levels of all WT mice from the same blot. Each cross represents one mouse. C, Similar to B, but for the cortices of 3-month-old WT, Stxbp1f/+, and Stxbp1f/f mice. Each filled (male) or open (female) circle represents one mouse. D, E, Stxbp1f/+ mice were crossed to ViaatCre/+ (D) or Vglut2Cre/+ (E) mice to generate different genotypes of mice for experiments. The color scheme is maintained across all figures. F, G, Representative fluorescence images from brain sections labeled by ISH probes against Stxbp1 and Vglut1/2 (F) or Gad1 (G) at P21. The sequences of the probes are provided in Extended Data List 1-1. The bottom row shows the layers 5–6 of the somatosensory cortex, and the top 3 rows show the individual cells from this region. Arrow heads (F) indicate Gad1-positive cells, and arrows (G) indicate Vglut1/2-negative cells. H, Summary data of normalized Stxbp1 mRNA levels in Gad1-positive (top row) and Gad1-negative (bottom row) cells from the somatosensory and frontal cortices. Stxbp1 levels were normalized by the average Stxbp1 levels of WT brain sections that were stained and imaged in parallel. The Stxbp1 levels of Gad1-positive, but not Gad1-negative, cells in Viaat-cHet mice were reduced. Different shapes of symbols represent different mice (3 mice per genotype, filled symbols for males and open symbols for females), and each symbol represents one brain section. The DFISH results from other brain regions are provided in Extended Data Figure 1-2. Stxbp1 protein levels are shown in Extended Data Figure 1-3. I, Similar to H, but for Vglut1/2-positive and Vglut1/2-negative cells in Vglut2-cHet and control mice and four mice per genotype. The DFISH results from other brain regions are provided in Extended Data Figure 1-4. The Stxbp1 protein levels are shown in Extended Data Figure 1-5. The Viaat and Vglut2 protein levels are shown in Extended Data Figure 1-6. Data are mean ± SEM. *p< 0.05, **p < 0.01, ***p < 0.001, ****p < 0.0001 (see the details of all statistical tests in Extended Data Table 1-7).
Figure 2.
Figure 2.
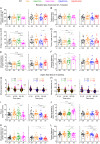
Early lethality, developmental delay, hindlimb clasping, and impaired nesting behavior of Viaat-cHet mice. A, B, Pie charts showing the observed numbers of mice with different genotypes at P14 (A) and P21–28 (B). The total numbers of observed mice are shown in the middle. Viaat-cHet mice were significantly less than Mendelian expectations at P21–28. C, D, Both Viaat-cHet and Vglut2-cHet mice had normal survival rates after P30. Note, only a subset of mice were observed up to P360 for the survival analysis (D). E, The amount of time it took for the pup to flip onto its feet from a supine position as a function of age. The maturation of this surface righting reflex was delayed in Viaat-cHet mice. Note, the filled (male) and open (female) triangles represent those pups that later died between P14 and P21. The results of other developmental milestones are shown in Extended Data Figure 2-1. The cohorts of mice used in the developmental milestone and behavioral experiments are provided in Extended Data Table 2-2. F, Body weight as a function of age. The body weight of Viaat-cHet mice was less than that of control mice. #indicates that Viaat-cHet mice are statistically different (i.e., at least p < 0.05) from at least both Flox and Viaat-Cre mice. G, Viaat-cHet mice showed hindlimb clasping (arrows), and Vglut2-cHet mice showed mild stiffness (Extended Data Video 2-3). H, Hindlimb clasping scores as a function of age. # indicates that Viaat-cHet and Vglut2-cHet mice are statistically different (i.e., at least p < 0.05) from at least both corresponding Flox and Cre mice. I, The fractions of Viaat-cHet and Vglut2-cHet mice with different severities of hindlimb stiffness or clasping. J, K, The quality of the nests was scored according to the criteria in J. Viaat-cHet mice built poor quality nests within 24 h. For different panels, the numbers and ages of tested mice are indicated in the figure. Each filled (male) or open (female) circle represents one mouse. Data in (E, F, H, K) are mean ± SEM. *p < 0.05, **p < 0.01, ***p < 0.001, ****p < 0.0001.
Figure 3.
Figure 3.
Viaat-cHet mice exhibit heightened anxiety-like behaviors and hyperactivity, whereas Vglut2-cHet mice only display increased anxiety-like behaviors. AF, In the elevated plus maze test, the total entries to the arms (A) and travel distance (B) of Viaat-cHet and Vglut2-cHet mice were normal. Viaat-cHet mice, but not Vglut2-cHet mice, entered the open arms less frequently (C), spent less time (D), and traveled shorter distance (E) in the open arms than control mice. In the closed arms, the travel distances of Vglut2-cHet mice were similar to those of control mice, and Viaat-cHet mice traveled slightly longer distances than Flox mice (F). G, H, In the open-field test, Viaat-cHet mice, but not Vglut2-cHet mice, showed an increase in the moving speed (G) and distance (H). The statistical significance between Viaat-cHet and WT, Flox, or Viaat-Cre mice is indicated by black, orange, or green asterisks, respectively. I–K, In the center zone of the arena, Viaat-cHet mice spent less time (I), moved faster (J), and traveled similar distance as the control mice (K), whereas Vglut2-cHet mice spent less time (I) and traveled shorter distance (K). L, Viaat-cHet and Vglut2-cHet mice showed a decrease in the ratio of center moving distances over total moving distance. For different panels, the numbers and ages of tested mice are indicated in the figure. Each filled (male) or open (female) circle represents one mouse. Data are mean ± SEM. *p < 0.05, **p < 0.01, ***p < 0.001, ****p < 0.0001.
Figure 4.
Figure 4.
Reduced motor coordination of Viaat-cHet mice. A, B, Viaat-cHet mice, but not Vglut2-cHet mice, took more time to come down from a vertical pole (A) and made more foot slips per travel distance when walking on a wire grid (B). C, In the rotarod test, Viaat-cHet mice performed better than the control mice, as they were able to stay on the rotating rod for longer time. The statistical significance between Viaat-cHet and WT, Flox, or Viaat-Cre mice is indicated by black, orange, or green asterisks, respectively. Vglut2-cHet mice performed similarly as the control mice except the first trial. The statistical significance between Vglut2-cHet and WT, Flox, or Vglut2-Cre mice is indicated by black, orange, or blue asterisks, respectively. The relationship between rotarod performance and body weight and the results of marble burying test and hole-board test are shown in Extended Data Figure 4-1. For different panels, the numbers and ages of tested mice are indicated in the figure. Each filled (male) or open (female) circle represents one mouse. Data are mean ± SEM. *p < 0.05, **p < 0.01, ***p < 0.001, ****p < 0.0001.
Figure 5.
Figure 5.
Viaat-cHet and Vglut2-cHet mice have normal sensory functions. A, In the hot plate test, Viaat-cHet mice showed slightly shorter latencies than Viaat-Cre mice in response to the high temperature, and the latencies of Vglut2-cHet were similar to those of control mice. B, Viaat-cHet and Vglut2-cHet mice showed similar acoustic startle responses as the control mice at different sound levels. The statistical significance between Viaat-cHet and WT, Flox, or Viaat-Cre mice is indicated by black, orange, or green asterisks, respectively. C, In the prepulse inhibition test, when a weak sound (i.e., prepulse 74, 78, or 82 dB) preceded a loud sound (120 dB), Viaat-cHet and Vglut2-cHet mice showed a similar reduction in the startle responses to the loud sound as the control mice. For different panels, the numbers and ages of tested mice are indicated in the figure. Each filled (male) or open (female) circle represents one mouse. Data are mean ± SEM. *p < 0.05, **p < 0.01, ***p < 0.001.
Figure 6.
Figure 6.
Viaat-cHet mice exhibit normal sociability but increased aggressive behaviors. A, In the three-chamber test, Viaat-cHet, Vglut2-cHet, and the control mice showed a preference for interacting with the partner mouse over the object. BE, In the residentintruder test, male Viaat-cHet mice, but not Vglut2-cHet mice, showed a reduction in the latency to attack the male intruder mice (B). The number (C), average duration (D), and total duration (E) of attacks of Viaat-cHet mice were increased as compared with those of the control mice. For different panels, the numbers and ages of tested mice are indicated in the figure. Each filled (male) or open (female) circle represents one mouse. Data are mean ± SEM. **p < 0.01, ***p < 0.001, ****p < 0.0001.
Figure 7.
Figure 7.
Distinct fear memory deficits of Viaat-cHet and Vglut2-cHet mice. A, B, In the novel object recognition test with 24 h testing intervals, mice were presented with the same two identical objects on days 1, 2, 3, and 5, and the familiar object and a novel object on day 4. The total interaction time with familiar and novel objects of Viaat-cHet or Vglut2-cHet mice was similar to that of their control mice (A). The ability of a mouse to recognize the novel object was measured by the preference index (B). Viaat-cHet and Vglut2-cHet mice showed similar preference for the novel object as their control mice. C, In fear conditioning, Viaat-cHet mice showed a similar level of freezing behaviors to the control mice before training (left panel) and a reduction of freezing behaviors in the contextual memory test 24 h after training (middle panel). Thus, contextual memory assessed by the context-induced freezing behaviors (right panel) is impaired in Viaat-cHet mice. Vglut2-cHet mice showed no impairments in this memory. D, In the cued memory test 24 h after training, Vglut2-cHet mice showed a similar level of freezing behaviors to the control mice before the cue presentation (left panel) and a reduction of freezing behaviors during cue presentation (middle panel). Thus, cued memory assessed by the cue-induced freezing behaviors (right panel) is impaired in Vglut2-cHet mice. The cue-induced freezing behaviors (right panel) is slightly enhanced in Viaat-cHet mice because Viaat-cHet mice showed a slight reduction of freezing behaviors before the cue presentation (left panel) and similar freezing behaviors to the control mice during the cue presentation (middle panel). The time courses of freezing behaviors are shown in Extended Data Figure 7-1. For different panels, the numbers and ages of tested mice are indicated in the figure. Each filled (male) or open (female) circle represents one mouse. Data are mean ± SEM. *p < 0.05, **p < 0.01, ****p < 0.0001.
Figure 8.
Figure 8.
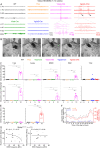
Viaat-cHet and Vglut2-cHet mice exhibit different forms of epileptic seizures. A, Representative EEG traces from the left frontal cortex (L-FC), left somatosensory cortex (L-SC), right somatosensory cortex (R-SC), and EMG traces from the neck muscle. A myoclonic jerk from a Viaat-cHet mouse was indicated by the dashed box and was expanded to show that the EEG discharges occurred prior to the EMG discharges. Note, the vertical line marks the onset of EEG discharges. The mouse was in REM sleep before the jerk (Extended Data Video 8-1). Two SWDs from a Vglut2-cHet mouse were indicated by the arrows and one of them was expanded below (Extended Data Video 8-2). B, Video frames showing a myoclonic jump of a Viaat-cHet mouse (Extended Data Video 8-3). The mouse was in REM sleep before the jump. C, Summary data showing the total frequencies of myoclonic jerks and the frequencies in different behavioral states. The frequency of jerks was drastically increased in Viaat-cHet mice, particularly during NREM and REM sleep. D, Similar to C, but for myoclonic jumps. The frequency of jumps was drastically increased in Viaat-cHet mice, particularly during NREM and REM sleep. E, Summary data showing that the SWD frequencies of Vglut2-cHet mice were drastically increased as compared with those of the control mice. F, The numbers of SWDs per hour in control (left y-axis) and Vglut2-cHet (right y-axis) mice are plotted as a function of time of day and averaged over 3 d. G, The relationships between the SWD frequency and the total frequency of myoclonic jerks (left panel) or jumps (right panel) in the Stxbp1tm1d/+ mice from Chen et al. (2020) were fitted with a linear regression (Y=aX + b; X, SWD frequency; Y, jerk or jump frequency; a, b, constants). The SWD frequency is not correlated with the total frequency of myoclonic jerks or jumps. The results of Stxbp1 haploinsufficiency in different classes of inhibitory neurons are shown in Extended Data Figure 8-4. For different panels, the numbers and ages of recorded mice are indicated in the figure. Each filled (male) or open (female) circle represents one mouse. Data are mean ± SEM. *P < 0.05, **p < 0.01, ***p < 0.001.
Figure 9.
Figure 9.
Phenotypic comparison of constitutive Stxbp1 haploinsufficient mice, Viaat-cHet mice, and Vglut2-cHet mice. Square Venn diagram showing the phenotypes of constitutive Stxbp1 haploinsufficient mice, Viaat-cHet mice, and Vglut2-cHet mice. Except the reduced digging behavior and impaired novel object recognition, Viaat-cHet and Vglut2 mice together recapitulate all other phenotypes of constitutive haploinsufficient mice. Viaat-cHet and Vglut2-cHet mice each recapitulate distinct subsets of the phenotypes of constitutive haploinsufficient mice, and only hindlimb clasping and increased anxiety are shared between them. Viaat-cHet mice exhibit broader and more severe phenotypes than Vglut2-cHet mice. The phenotypic comparison of different mouse models is shown in Extended Data Table 9-1.

References

    1. Abramov D, Guiberson NGL, Burré J (2021) STXBP1 encephalopathies: clinical spectrum, disease mechanisms, and therapeutic strategies. J Neurochem 157:165–178. 10.1111/jnc.15120 - DOI - PMC - PubMed
    1. Antunes M, Biala G (2012) The novel object recognition memory: neurobiology, test procedure, and its modifications. Cogn Process 13:93–110. 10.1007/s10339-011-0430-z - DOI - PMC - PubMed
    1. Asinof SK, Sukoff Rizzo SJ, Buckley AR, Beyer BJ, Letts VA, Frankel WN, Boumil RM (2015) Independent neuronal origin of seizures and behavioral comorbidities in an animal model of a severe childhood genetic epileptic encephalopathy. PLoS Genet 11:e1005347. 10.1371/journal.pgen.1005347 - DOI - PMC - PubMed
    1. Ausborn J, Koizumi H, Barnett WH, John TT, Zhang R, Molkov YI, Smith JC, Rybak IA (2018) Organization of the core respiratory network: insights from optogenetic and modeling studies. PLoS Comput Biol 14:e1006148. 10.1371/journal.pcbi.1006148 - DOI - PMC - PubMed
    1. Bonnycastle K, Davenport EC, Cousin MA (2021) Presynaptic dysfunction in neurodevelopmental disorders: insights from the synaptic vesicle life cycle. J Neurochem 157:179–207. 10.1111/jnc.15035 - DOI - PubMed

Publication types