. 2024 Feb 15;15(1):1390.
doi: 10.1038/s41467-024-45547-x.

Assessing emergence risk of double-resistant and triple-resistant genotypes of Plasmodium falciparum

Affiliations

Assessing emergence risk of double-resistant and triple-resistant genotypes of Plasmodium falciparum

Eric Zhewen Li et al. Nat Commun. .

Abstract

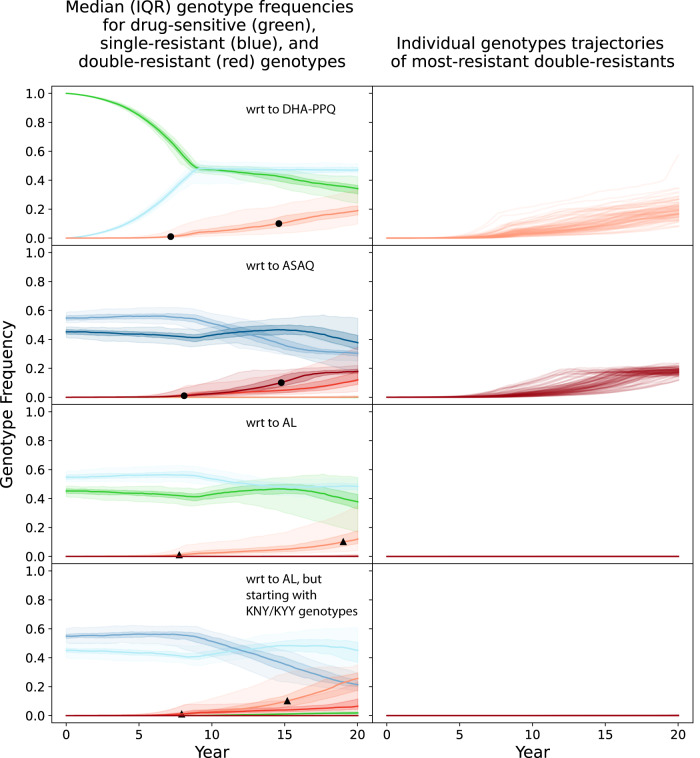
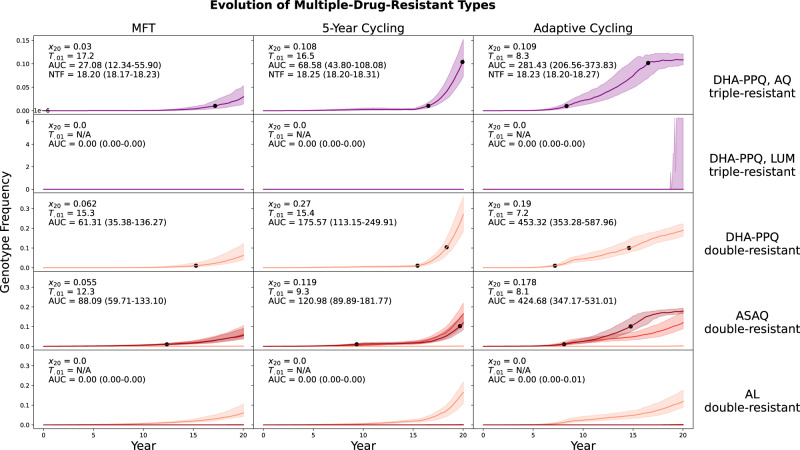
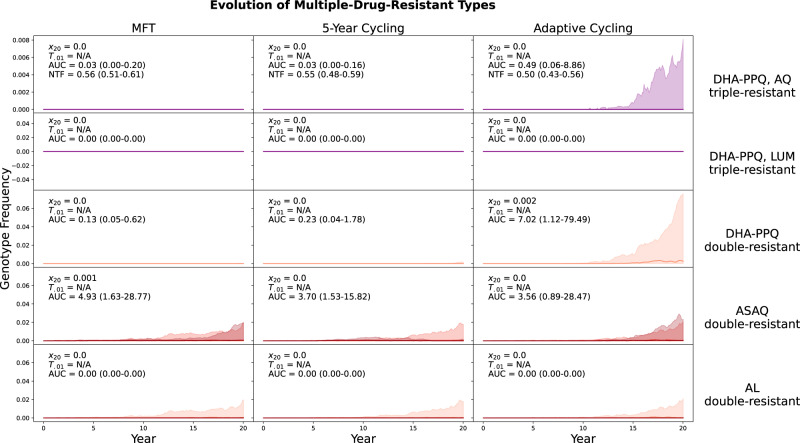
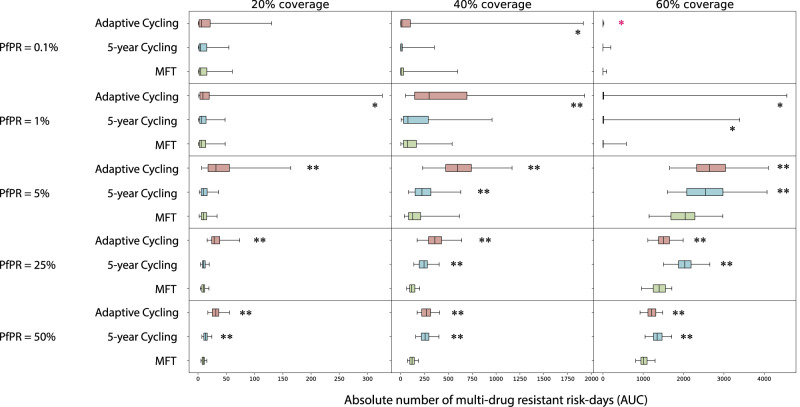
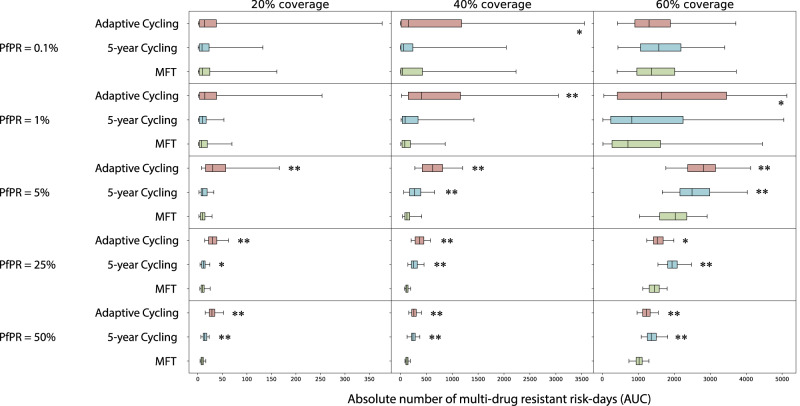
Delaying and slowing antimalarial drug resistance evolution is a priority for malaria-endemic countries. Until novel therapies become available, the mainstay of antimalarial treatment will continue to be artemisinin-based combination therapy (ACT). Deployment of different ACTs can be optimized to minimize evolutionary pressure for drug resistance by deploying them as a set of co-equal multiple first-line therapies (MFT) rather than rotating therapies in and out of use. Here, we consider one potential detriment of MFT policies, namely, that the simultaneous deployment of multiple ACTs could drive the evolution of different resistance alleles concurrently and that these resistance alleles could then be brought together by recombination into double-resistant or triple-resistant parasites. Using an individual-based model, we compare MFT and cycling policies in malaria transmission settings ranging from 0.1% to 50% prevalence. We define a total risk measure for multi-drug resistance (MDR) by summing the area under the genotype-frequency curves (AUC) of double- and triple-resistant genotypes. When prevalence ≥ 1%, total MDR risk ranges from statistically similar to 80% lower under MFT policies than under cycling policies, irrespective of whether resistance is imported or emerges de novo. At 0.1% prevalence, there is little statistical difference in MDR risk between MFT and cycling.


Conflict of interest statement

The authors declare no competing interests.

Figures

Fig. 1
Fig. 1. Emergence and evolution of single-resistant and double-resistant P. falciparum genotypes under an adaptive cycling (status quo) drug distribution strategy, where DHA-PPQ is used first, ASAQ is used second, and AL is used last. Epidemiological scenario shown is 5% PfPR2-10 and 40% treatment coverage.
Single resistance (blue lines) and double resistance (red lines) are always defined with respect to (wrt) a particular artemisinin combination therapy due to the pleiotropic effects of loci in pfcrt and pfmdr1. Top row shows the evolution of single and double resistance to DHA-PPQ. Second row shows the evolution of single and double resistance to ASAQ. And third and fourth rows show the evolution of single and double resistance to AL. The first three rows show simulations that were started with “TNY” genotypes (76T, N86, Y184) which have some resistance to amodiaquine, while the fourth row shows simulations started with “KNY” genotypes which show more resistance to lumefantrine. For blue and red lines, the darker the shade the more resistance alleles are present for that resistant genotype. Green lines correspond to genotypes that have no resistance mutations with respect to each ACT. Shaded areas show interquartile ranges from 100 simulations, and light-shaded areas show 90% ranges from 100 simulations. Black circles show the 1% and 10% points for full double-resistants, indicating that full double resistance to DHA-PPQ and ASAQ reaches 0.10 genotype frequency after a median time of approximately 15 years. Black triangles show the 1% and 10% points for any double-mutant double-resistant genotypes to AL, i.e. genotypes with one artemisinin resistance mutation and exactly one lumefantrine resistance mutation. Right-hand panels show the 100 individual trajectories for the full double-resistants, showing that there is substantial variation in the time of emergence for these genotypes.
Fig. 2
Fig. 2. Evolution of multi-drug resistance under three drug deployment strategies.
Epidemiological scenario shown is 5% PfPR2-10 and 40% treatment coverage. Each row shows the genotype frequency of triple or double resistance to a particular set of antimalarial drugs, with the most resistant genotypes shown in purple (top two rows) or dark red (bottom three rows). In the bottom two rows, medium red corresponds to triple-mutant double-resistance and light red corresponds to double-mutant double-resistance. Median line is shown and interquartile ranges are shaded. No importation is allowed in these figures. Black dots are 0.01 and 0.10 frequency markers for the maximally resistant genotypes. The columns show three different treatment strategies. The outcome measures are the genotype frequency of the maximally-resistant genotype after 20 years (x20), the time until the maximally-resistant genotype reaches 0.01 frequency in the population (T.01), the total area under the frequency curve of the maximally-resistant genotype (AUC), and the total number of non-discounted treatment failures during the twenty years that a strategy is implemented (NTF). AUC is the most appropriate measure of total MDR risk, and the first, third, and fourth rows show that an MFT strategy generates 27% to 65% less risk than the more optimal cycling strategy. The second and fifth rows show a median value of AUC = 0.0 frequency-days for the maximally-resistant genotypes, for all three drug-distribution strategies.
Fig. 3
Fig. 3. Evolution of multi-drug resistance under three drug deployment strategies.
Epidemiological scenario shown is 0.1% PfPR2-10 and 40% treatment coverage. Each row shows the genotype frequency of triple or double resistance to a particular set of antimalarial drugs, with the most resistant genotypes shown in purple (top two rows) or dark red (bottom three rows). In the bottom two rows, medium red corresponds to triple-mutant double-resistance and light red corresponds to double-mutant double-resistance. Median line is shown (nearly always at 0.0) and interquartile ranges are shaded. No importation is allowed in these figures. The columns show three different treatment strategies. The outcome measures are the genotype frequency of the maximally-resistant genotype after 20 years (x20), the time until the maximally-resistant genotype reaches 0.01 frequency in the population (T.01), the total area under the frequency curve of the maximally-resistant genotype (AUC), and the total number of non-discounted treatment failures during the twenty years that a strategy is implemented (NTF). AUC is the most appropriate measure of total MDR risk, but median AUC = 0.0 for the majority of scenarios in this low-transmission setting. The interquartile ranges in the right-hand column suggest that adaptive cycling has the highest probability of driving maximally-resistant genotypes to high levels. In the first row after 20 years, the triple-resistant reached 0.001 genotype frequency in 32/100 simulations under an adaptive cycling strategy. Under MFT and 5-year cycling, the triple-resistant never rose above 0.001 frequency during the twenty years of the simulation.
Fig. 4
Fig. 4. Absolute risk of multi-drug resistance over 20 years.
Each boxplot (N = 100 simulations) shows the sum of AUCs across all five maximally-resistant genotypes (Table 1). Boxplot whiskers are 1.5 times the IQR. AUC comparisons between MFT and 5-year cycling and AUC comparisons between MFT and adaptive cycling are assessed with a Mann-Whitney test, and p-value markers (testing whether MFT has lower AUC) are placed next to each boxplot with p < 0.05 (*) or p < 10−4 (**). In the upper-right panel, the red p-value marker indicates that MFT (median AUC = 0.23 risk days) has higher AUC than the adaptive cycling strategy (median AUC = 0.10 risk days) with p = 0.037.
Fig. 5
Fig. 5. Absolute risk of multi-drug resistance under an importation scenario over 20 years.
Each boxplot (N = 100 simulations) shows the sum of AUCs across all five maximally-resistant genotypes (Table 1). Boxplot whiskers are 1.5 times the IQR. AUC comparisons between MFT and 5-year cycling and AUC comparisons between MFT and adaptive cycling are assessed with a Mann-Whitney test, and p-value markers (testing whether MFT has lower AUC) are placed next to each boxplot with p < 0.05 (*) or p < 10−4 (**). In these scenarios resistant genotypes are imported according to a Poisson process with a mean importation rate of one parasite per year (in an asymptomatic individual) with an equal 0.20 probability that the imported genotype is one of the five maximally-resistant parasites from Table 1.
Fig. 6
Fig. 6. Example of mutation flow during years 16 to 20 of a 5-year cycling strategy, where DHA-PPQ is used first, ASAQ second, and AL last.
PfPR2-10 is 5% and treatment coverage is 40%. The diagram shows mutation flow during the second period of DHA-PPQ usage for a ‘median’ simulation. The median simulation was chosen by minimizing the absolute distance (among 100 runs) to the five median frequency lines shown in Fig. 2. Drug-sensitive genotypes are shown in green, single-resistant genotypes in blue, and the double-resistant to DHA-PPQ is shown in crimson (“2” connotes PPQ-resistance). Mutation occurs from left to right, and the width of the flow is proportional to the absolute number of mutations during the five-year period. A total of 372 mutations to the maximally-resistant triple-resistant (TYY--Y2) occur in years 16–20 of a 5-year cycling policy while the corresponding number of mutations for an MFT policy is 318. The total number of mutations to DHA-PPQ-AQ triple-resistant over 20 years is 581 for 5-year cycling (this figure) and 498 for MFT. Mutations shown are mutations that emerge and fix within host. Recombination occurs in the model but recombination events are not shown in the diagram.
Fig. 7
Fig. 7. Mutation flow diagrams for median MFT and 5-year cycling simulations, separated into four 5-year periods.
PfPR2-10 is 5% and treatment coverage is 40%. Two different 5-year cycling strategies are explored (middle and right columns) with different ordering of ACT deployment. Mutation occurs left to right in the diagrams (but the x-axis here is not time) and the width of the flow is proportional to the absolute number of mutations occurring during the five-year period. The crimson-colored flows show evolution towards the maximally-resistant double-resistant genotypes (bottom three rows of Table 1). All other flows are shown in gray. The blue numbers in each panel show the number of ‘destination genotypes’ for the mutation and within-host-selection process; in other words these are the genotypes being selected for during each period. MFT shows more diversifying selection while 5-year cycling shows more unidirectional selection.

References

    1. World Health Organization. World Malaria Report 2021. https://apps.who.int/iris/handle/10665/350147 (2021).
    1. Shibeshi W, Alemkere G, Mulu A, Engidawork E. Efficacy and safety of artemisinin-based combination therapies for the treatment of uncomplicated malaria in pediatrics: a systematic review and meta-analysis. BMC Infect. Dis. 2021;21:326. doi: 10.1186/s12879-021-06018-6. - DOI - PMC - PubMed
    1. Marwa K, et al. Therapeutic efficacy of artemether-lumefantrine, artesunate-amodiaquine and dihydroartemisinin-piperaquine in the treatment of uncomplicated Plasmodium falciparum malaria in Sub-Saharan Africa: A systematic review and meta-analysis. PLOS ONE. 2022;17:e0264339. doi: 10.1371/journal.pone.0264339. - DOI - PMC - PubMed
    1. Ariey F, et al. A molecular marker of artemisinin-resistant Plasmodium falciparum malaria. Nature. 2014;505:50–55. doi: 10.1038/nature12876. - DOI - PMC - PubMed
    1. Balikagala B, et al. Evidence of Artemisinin-resistant malaria in Africa. N. Engl. J. Med. 2021;385:1163–1171. doi: 10.1056/NEJMoa2101746. - DOI - PubMed

MeSH terms