. 2024 Feb 15;14(1):3786.
doi: 10.1038/s41598-024-54357-6.

Identification of immunogenic cell death-related genes involved in Alzheimer's disease

Affiliations

Identification of immunogenic cell death-related genes involved in Alzheimer's disease

Rui Wang et al. Sci Rep. .

Abstract

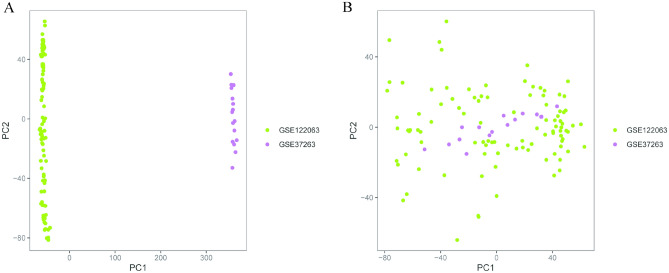
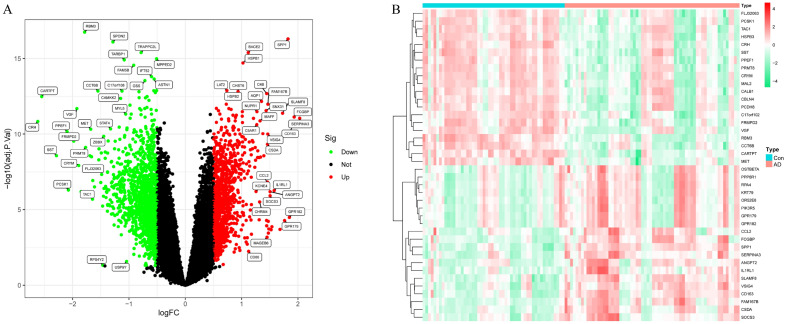
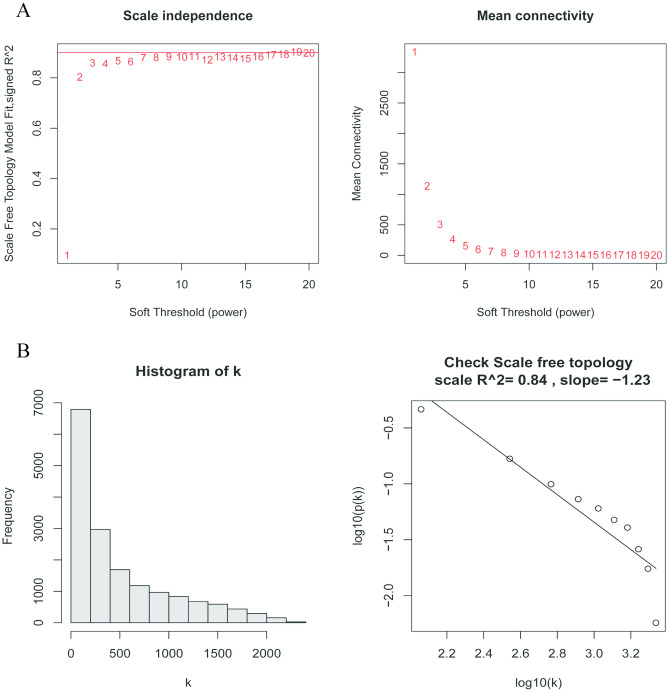
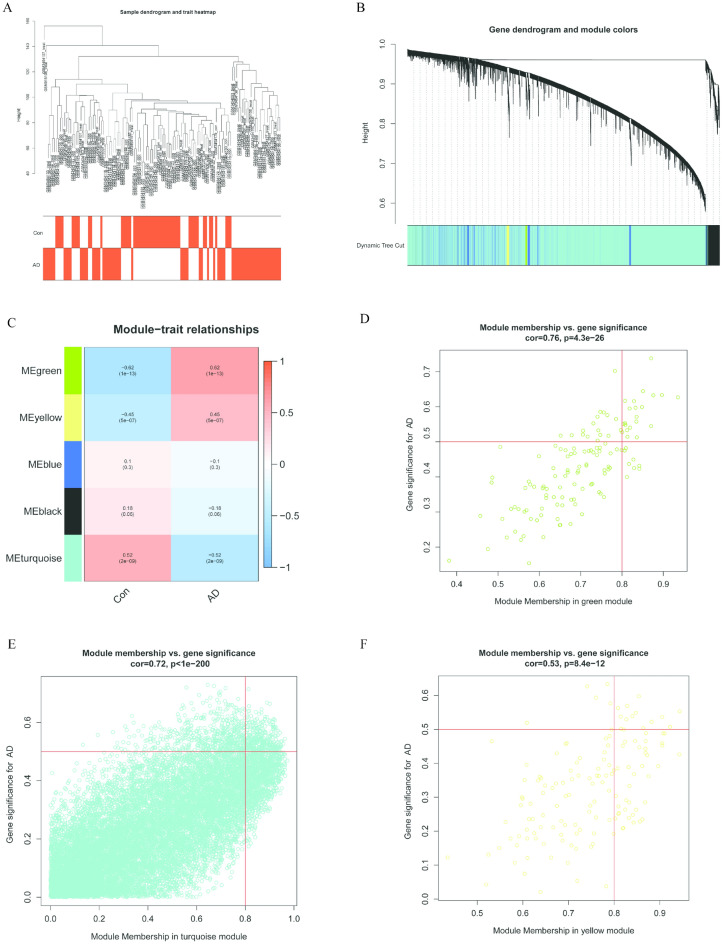
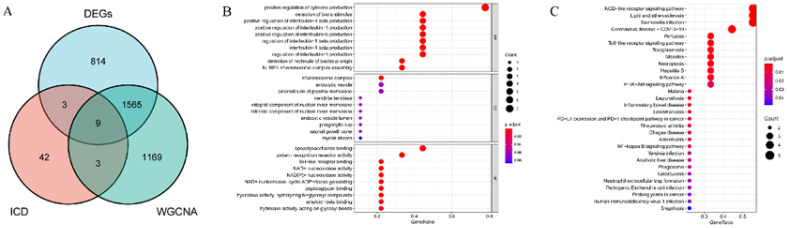
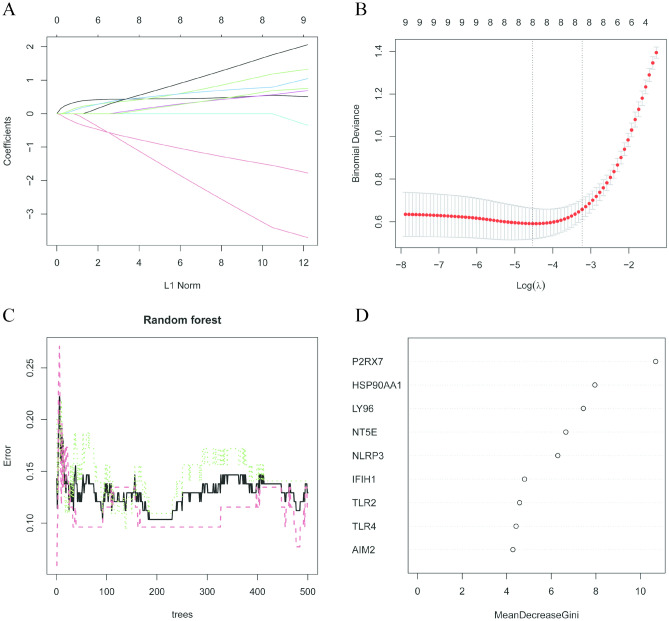
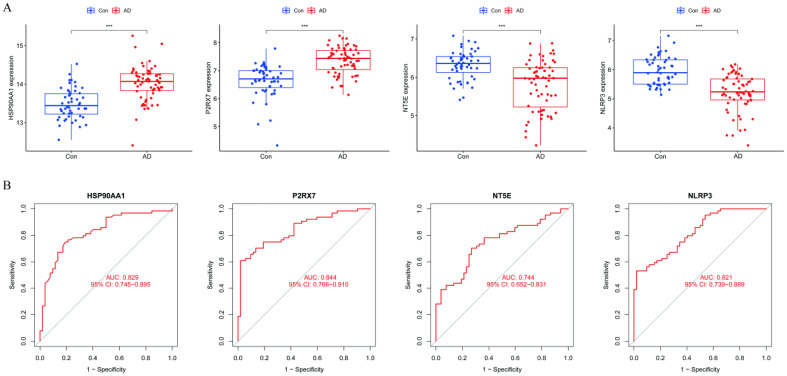
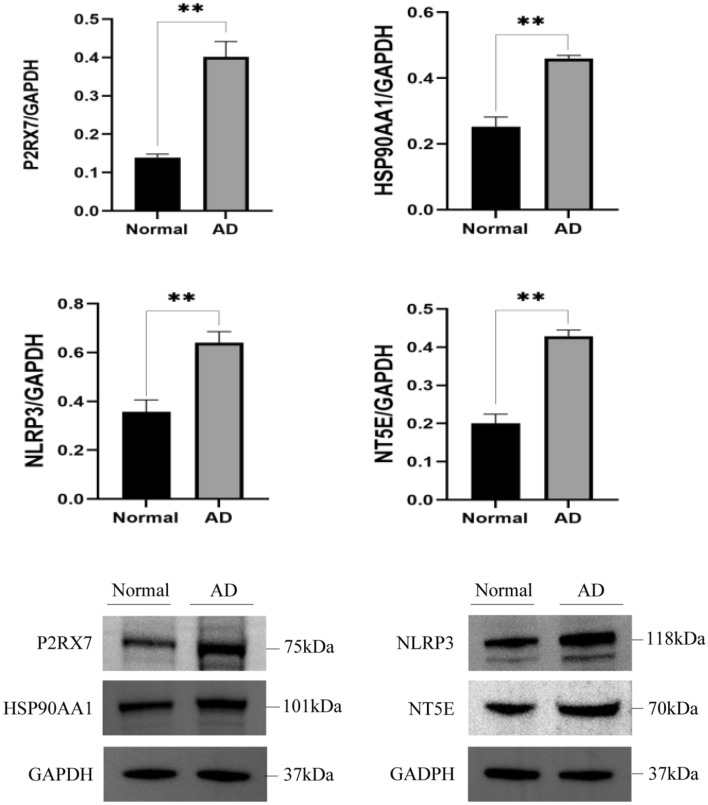
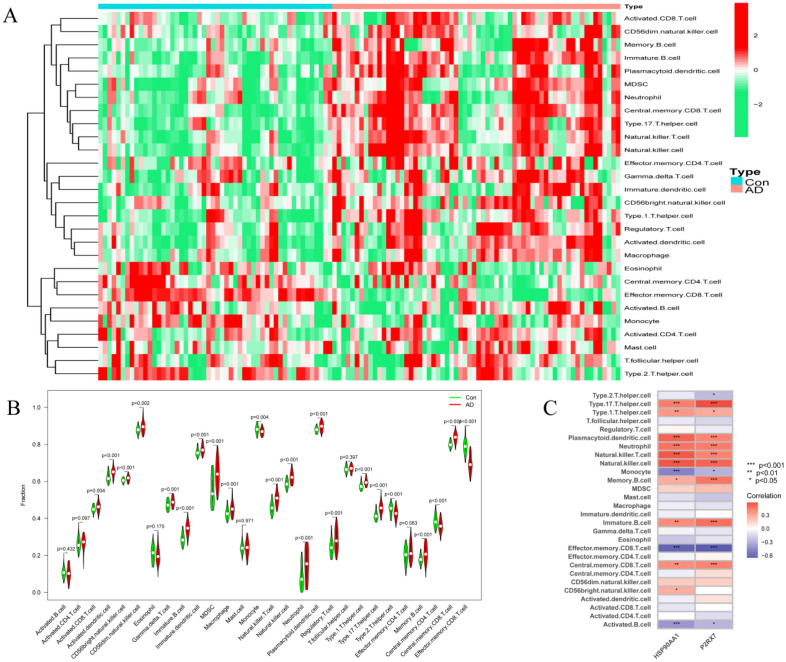
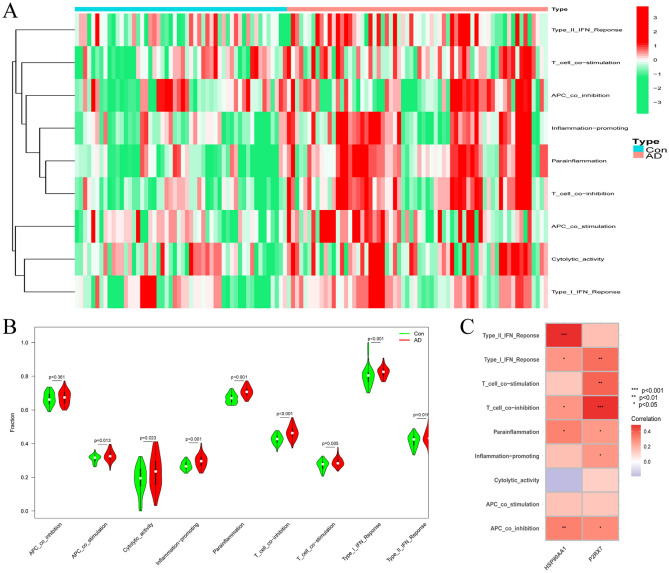
Alzheimer's disease (AD) is the leading cause of dementia worldwide, with recent studies highlighting the potential role of immunogenic cell death (ICD) in the pathogenesis of this neurodegenerative disorder. A total of 52 healthy controls and 64 patients with AD were included. Compared to the controls, the patients with AD exhibited 2392 differentially expressed genes (DEGs), of which 1015 and 1377 were upregulated and downregulated genes, respectively. Among them, nine common genes were identified by intersecting the AD-related module genes with the DEGs and ICD-associated genes. Gene ontology (GO)analysis further revealed "positive regulation of cytokine production" as the most significant term. Moreover, the enriched molecular functions were primarily related to the inflammatory body complex, while the overlapping genes were significantly enriched in lipopolysaccharide binding. Kyoto encyclopedia of genes and genomes (KEGG) analysis also indicated that these overlapping genes were mainly enriched in immunity, inflammation, and lipid metabolism pathways. Furthermore, the following four hub genes were detected using machine learning algorithms: P2RX7, HSP90AA1, NT5E, and NLRP3. These genes demonstrated significant differences in expression between the AD and healthy control groups (P < 0.05). Additionally, the area under the curve values of these four genes were all > 0.7, indicating their potential diagnostic value for AD. We further validated the protein levels of these four genes in the hippocampus of 3xTg-AD and C57BL/6J mice, showing P2RX7 and HSP90AA1 expression levels consistent with the previously analyzed trends. Finally, the single-sample gene set enrichment analysis (ssGSEA) algorithm provided additional evidence by demonstrating the crucial role of immune cell infiltration and its link with the hub genes in AD progression. Our study results suggest that ICD-mediated elevation of HSP90AA1 and P2RX7 levels and the resulting induction of tau hyperphosphorylation and neuroinflammation are vital in the AD pathogenic mechanism.

Keywords: Alzheimer’s disease; GEO; Immunogenic cell death; WGCNA.


Conflict of interest statement

The authors declare no competing interests.

Figures

Figure 1
Figure 1
Principal component analysis (PCA) diagram. (A) Distribution of data dimensions before merging the two datasets and eliminating batch differences. (B) Distribution of data dimensions for the two datasets merged after eliminating batch differences.
Figure 2
Figure 2
Identification of differentially expressed genes (DEGs) and screening of hub genes. (A) Volcano plot for DEGs between the healthy control and AD brain tissues. Red color represents differential genes up-regulated in AD samples and green color represents differential genes down-regulated in AD samples. (B) Heat map of the top 20 up-regulated and top 20 down-regulated differential genes.
Figure 3
Figure 3
Determination of soft-thresholding power in the weighted gene co-expression network analysis (WGCNA). (A) Analysis of the scale-free fit index and the mean connectivity for the various soft-thresholding powers (β). The corresponding soft-thresholding power is 3. (B) Histogram of connectivity distribution and checking the scale-free topology.
Figure 4
Figure 4
Construction of WGCNA modules. (A) Sample dendrogram and clinical grouping features based on color annotation. (B) Each branch represents one gene, with every color below denoting one co-expression module. (C) Heatmap of the module-trait relationships. The green, turquoise, and yellow modules are significantly associated with AD. (DF) Scatter plot for the correlation between gene module membership in the green, turquoise, and yellow modules and gene significance.
Figure 5
Figure 5
(A) A Venn diagram for the intersections between differentially expressed genes (DEGs), differential genes based on weighted gene co-expression network analysis (WGCNA), and immunogenic cell death (ICD)-related genes. (B) Gene ontology (GO) functional analysis showing the enrichment of the overlapped genes. (C) Kyoto Encyclopedia of Genes and Genomes (KEGG) pathway enrichment analysis of the overlapped genes.
Figure 6
Figure 6
(A) Variable selection using LASSO binary logistic model. A coefficient profile plot is constructed against the L1 Norm sequence. (B) Eight variables with nonzero coefficients are selected by deriving the optimal lambda. After verifying the optimal parameter (lambda) in the LASSO model, the partial likelihood deviance (binomial deviance) curve versus log(lambda) is plotted, and dotted vertical lines are drawn based on 1 standard error criteria. (C) Random forest chart: The horizontal axis represents the number of trees, while the vertical axis denotes the error in the loss function. Smaller errors indicate a better model fit to the data. Moreover, selecting the optimal number of trees is essential to achieving the best model performance. (D) The variable importance is compared by calculating the influence of each variable on the heterogeneity of the observations at each node of the classification tree, wherein a higher value signifies greater variable importance.
Figure 7
Figure 7
(A) Validation of the hub genes at the gene expression level. (B) Validation of the diagnostic value of the hub genes in AD.
Figure 8
Figure 8
Expression of P2RX7, HSP90AA1, NLRP3, and NT5E in the hippocampus of normal and AD mice. **P < 0.01. The samples derive from the same experiment and that gels/blots were processed in parallel. Original blots/gels are presented in Supplementary Fig. 1.
Figure 9
Figure 9
Analysis of the immune landscape associated with AD. (A) Heatmap and (B) violin plot showing the distribution of 28 types of immune cells in the healthy control and AD brain tissues. (C) The relationship between the two hub genes (HSP90AA1 and P2RX7) and immune cell infiltration.
Figure 10
Figure 10
Analysis of the immune landscape linked to AD. (A) Heatmap and (B) Violin plot displaying the distribution of nine types of immune functions in the healthy control and AD brain tissues. (C) The relationship between the two hub genes (HSP90AA1 and P2RX7) and immune function.

Similar articles

Cited by

References

    1. 2021 Alzheimer's disease facts and figures. Alzheimer's Dement.17, 327–406. 10.1002/alz.12328 (2021). - PubMed
    1. Li X, et al. Global, regional, and national burden of Alzheimer's disease and other dementias, 1990–2019. Front. Aging Neurosci. 2022;14:937486. doi: 10.3389/fnagi.2022.937486. - DOI - PMC - PubMed
    1. Guo T, et al. Molecular and cellular mechanisms underlying the pathogenesis of Alzheimer's disease. Mol. Neurodegener. 2020;15:40. doi: 10.1186/s13024-020-00391-7. - DOI - PMC - PubMed
    1. Prokop S, Lee VMY, Trojanowski JQ. Neuroimmune interactions in Alzheimer's disease—New frontier with old challenges? Prog. Mol. Biol. Transl. Sci. 2019;168:183–201. doi: 10.1016/bs.pmbts.2019.10.002. - DOI - PMC - PubMed
    1. Haage V, De Jager PL. Neuroimmune contributions to Alzheimer's disease: A focus on human data. Mol. Psychiatry. 2022 doi: 10.1038/s41380-022-01637-0. - DOI - PMC - PubMed