. 2024 Feb 15;15(1):1421.
doi: 10.1038/s41467-024-45500-y.

Diversity and evolution of the vertebrate chemoreceptor gene repertoire

Affiliations

Diversity and evolution of the vertebrate chemoreceptor gene repertoire

Maxime Policarpo et al. Nat Commun. .

Abstract

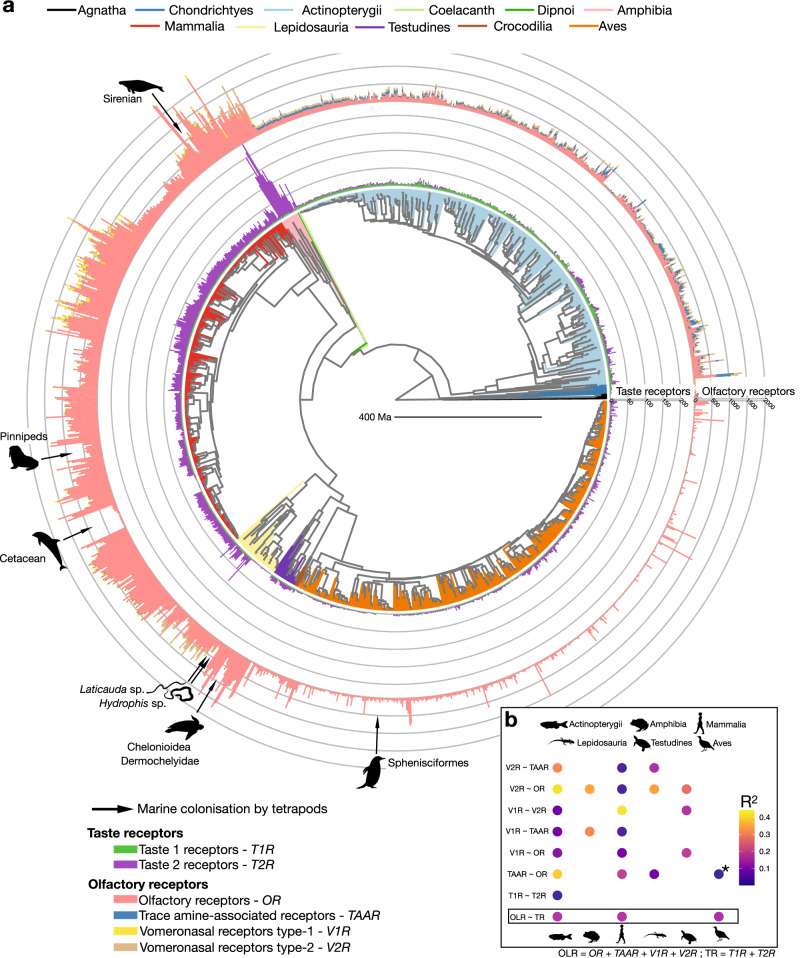
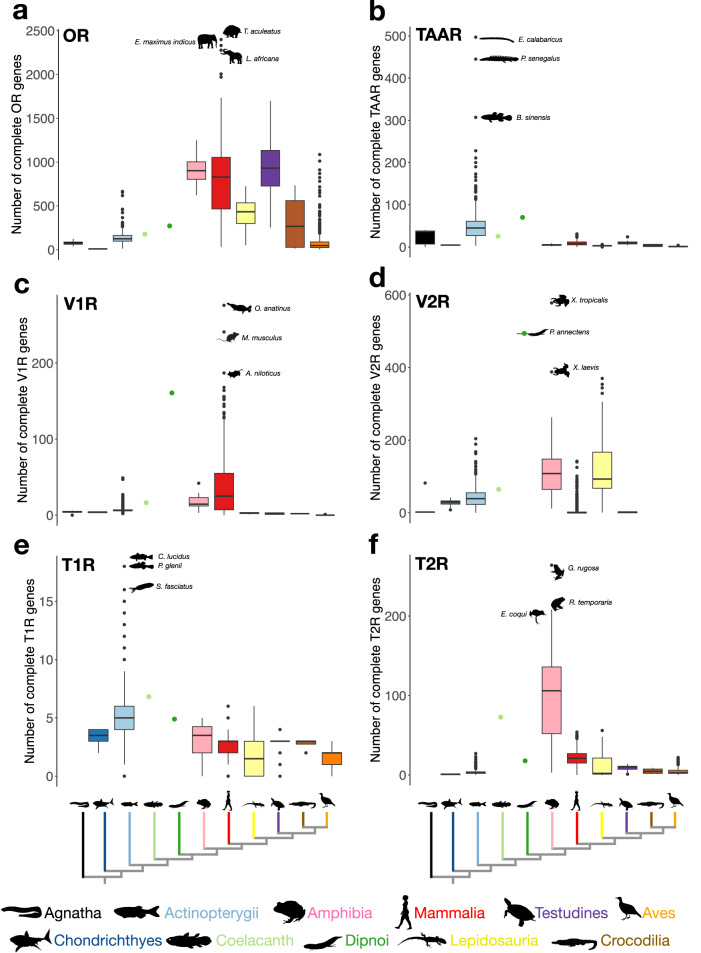
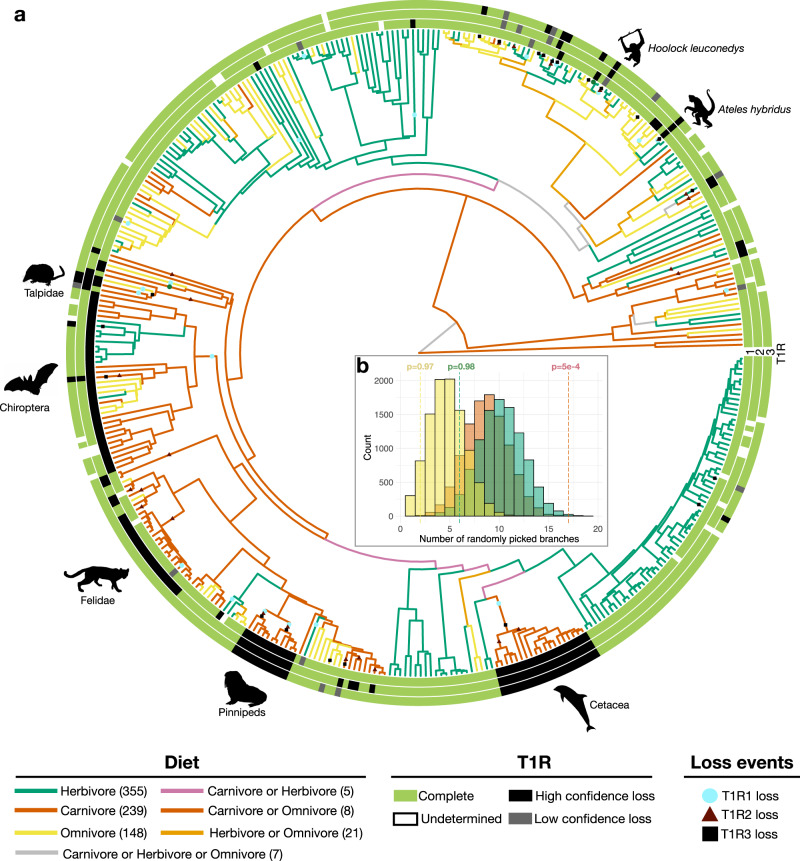
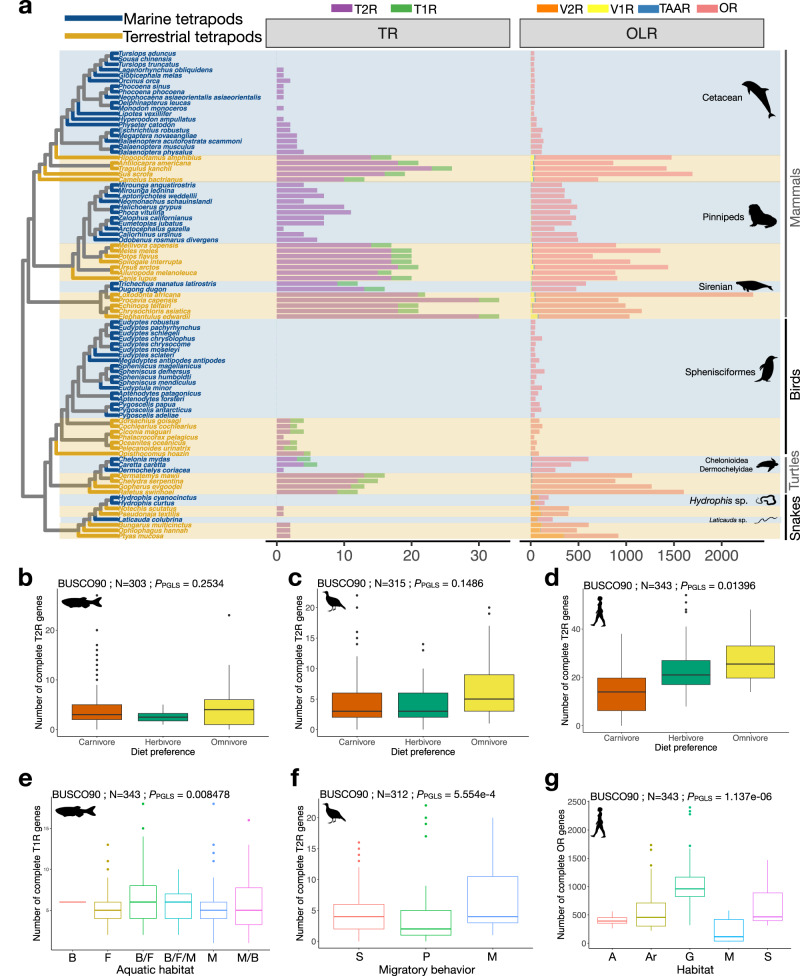
Chemoreception - the ability to smell and taste - is an essential sensory modality of most animals. The number and type of chemical stimuli that animals can perceive depends primarily on the diversity of chemoreceptors they possess and express. In vertebrates, six families of G protein-coupled receptors form the core of their chemosensory system, the olfactory/pheromone receptor gene families OR, TAAR, V1R and V2R, and the taste receptors T1R and T2R. Here, we study the vertebrate chemoreceptor gene repertoire and its evolutionary history. Through the examination of 1,527 vertebrate genomes, we uncover substantial differences in the number and composition of chemoreceptors across vertebrates. We show that the chemoreceptor gene families are co-evolving, highly dynamic, and characterized by lineage-specific expansions (for example, OR in tetrapods; TAAR, T1R in teleosts; V1R in mammals; V2R, T2R in amphibians) and losses. Overall, amphibians, followed by mammals, are the vertebrate clades with the largest chemoreceptor repertoires. While marine tetrapods feature a convergent reduction of chemoreceptor numbers, the number of OR genes correlates with habitat in mammals and birds and with migratory behavior in birds, and the taste receptor repertoire correlates with diet in mammals and with aquatic environment in fish.


Conflict of interest statement

The authors declare no competing interests.

Figures

Fig. 1
Fig. 1. Co-evolution of chemoreceptor gene repertoires in vertebrates.
a Phylogeny of 1532 vertebrate species, for which a genome assembly with more than 80% complete BUSCO genes was available (Sceloporus occidentalis is represented in the phylogeny but was excluded from the analysis; see Methods for details). The branches are colored according to the vertebrate (sub)class. The numbers of OR, TAAR, V1R, V2R, T1R and T2R genes for every species are shown as bars, color-coded as in the lower left panel. Independent marine colonization events by tetrapods (indicated by black arrows) are, for most parts, associated with decreases in chemoreceptor repertoire sizes. It is unknown whether the remaining genes in these species are functional in the context of chemoreception or used for other functions, as is the case for extranasal OR genes,. Phylogenies with full species names and sub-trees for each vertebrate (sub)class are available in Supplementary Figs. 10 and 11, respectively. Animal silhouettes were obtained from PhyloPic.org. b Correlations between the number of complete genes of the different chemoreceptor families, or between the number of complete olfactory (OLR) and the number of complete taste receptors (TR) (BUSCO80 dataset; see Supplementary Fig. 7 for the results with the BUSCO90 dataset and when considering only chromosome-scale assemblies). Correlations were assessed using a two-sided pGLS. All correlations were positive. Circles indicate PPGLS < 0.05 and are color-coded according to the pGLS R2-values, absence of a circle indicates PPGLS > 0.05. The association between OR and TAAR genes in birds (marked with an “*”) is the only one that became non-significant with the BUSCO90 dataset. Samples sizes for chemoreceptor families correlations can be retrieved from Supplementary Table 1. Source data are provided as a Source Data file.
Fig. 2
Fig. 2. Number of chemoreceptor genes in vertebrates.
For each vertebrate (sub)class (colored as in Fig. 1), the number of olfactory and taste receptor genes is shown as boxplots (first quartile −1.5 interquartile range; first quartile; mean; third quartile; third quartile +1.5 interquartile range; dots represent outliers) for the BUSCO80 dataset. For each chemoreceptor gene family, the names of the three species with the highest number of genes, and their silhouettes, are shown. a OR genes; b TAAR genes; c V1R genes; d V2R genes; e T1R genes; f T2R genes. The species with the highest number of complete olfactory receptor genes is Tachyglossus aculeatus (2514) closely followed by Elephas maximus indicus (2383) and Loxodonta africana (2329), while the species with the highest number of complete taste receptor genes is Glandirana rugosa (268). Note that the high number of complete OR genes found in Tachyglossus aculeatus could potentially represent an artifact, as we also retrieved an unusually high number (nearly 9000) of incomplete genes in this species (Supplementary Data 1). Samples sizes for each vertebrate (sub)class can be retrieved from Supplementary Table 1 (“Nb of species >80% BUSCO”). Source data are provided as a Source Data file.
Fig. 3
Fig. 3. Repeated loss of T1R2 in carnivore mammals.
a Phylogeny of mammals, for which a genome assembly with more than 80% complete BUSCO genes was available (392 species). Terminal branches are color-coded according to the diet preference taken from the MammalDiet database. Diet preferences of internal branches were inferred with PastML. The status of each gene (T1R1, T1R2, T1R3) in each species is indicated (according to the four categories shown; see Methods for details). T1R loss events, inferred by shared loss-of-function mutations across species, are indicated on the respective branches. Large clades with T1R losses, or individual species that have lost all T1R genes, are highlighted with a silhouette. b Simulation result where T1R2 genes were randomly pseudogenized in the mammalian tree. The histogram represents the results of the simulations (with the x-axis representing the number of randomly drawn branches in the simulations) and the dashed lines represent the observed number of independent T1R2 loss per diet group (same color code as in the phylogeny). The P-value reported above each dashed line correspond to the number of simulations where the same or a greater number of independent T1R2 losses occurred than observed for the same branch category (carnivore, omnivore or herbivore), divided by the total number of simulations (10,000). All simulation results for T1R1, T1R2 and T1R3 are shown in Supplementary Fig. 38. Source data are provided as a Source Data file.
Fig. 4
Fig. 4. Ecology of chemoreceptor evolution in vertebrates.
a Phylogeny of marine tetrapods and closely related species, displaying the number of olfactory and taste receptors. Genes are color-coded according to chemoreceptor family. The names of the marine species and the associated branches in the phylogeny are colored in blue, while the names of non-marine species and the respective branches are colored in brown. Marine clades feature a reduction in the number of olfactory and taste receptor genes. All marine clades, except sirenians, have lost their T1R genes; T2R genes are completely lacking from the genomes of Sphenisciformes and some cetaceans. Association between the number of T2R genes and diet preferences in ray-finned fishes assessed with a two-sided pGLS test (b), in birds and crocodiles (c), and in mammals (d). pGLS P-values are reported above each boxplot (for the BUSCO90 dataset; for BUSCO80 results and chromosome-scale assemblies see Supplementary Fig. 45), N refers to the number of genomes used for the respective analysis. For mammals, we further tested the impact of the two carnivore marine clades on the pGLS results (Supplementary Fig. 45). eg Two-sided pGLS test results between ecological parameters and the number of chemoreceptor genes. Association between the number of complete T1R genes and the habitat in ray-finned fishes (e), the number of complete T2R genes and the migratory behavior in birds (f), and the number of complete OR genes and habitat in mammals (g). pGLS P-values are reported above each boxplot (for the BUSCO90 dataset, N refers to the number of genomes used for the respective analysis. Note that pGLS P-values are also significant with the BUSCO80 dataset or when considering only chromosome-scale assemblies (see Supplementary Fig. 46). Aquatic habitat in ray-finned fishes is coded as B…brackisch, F…freshwater, M…marine (allowing for combinations); migratory behavior in birds is coded as S…sedentary, P…partially migratory, M…migratory; habitat in mammals is encoded according to their ForStrat.Value as M…marine, G…ground level including aquatic foraging, S…scansorial, Ar…arboreal, A…aerial (see Supplementary Data 1). Boxplots represent the first quartile −1.5; the interquartile range, the first quartile, the mean, the third quartile and the third quartile +1.5 interquartile range. Dots represent outliers. Source data are provided as a Source Data file.

Similar articles

Cited by

References

    1. Dall SRX, Giraldeau L-A, Olsson O, McNamara JM, Stephens DW. Information and its use by animals in evolutionary ecology. Trends Ecol. Evol. 2005;20:187–193. doi: 10.1016/j.tree.2005.01.010. - DOI - PubMed
    1. Müller J, Bickelmann C, Sobral G. The Evolution and Fossil History of Sensory Perception in Amniote Vertebrates. Annu. Rev. Earth Planet. Sci. 2018;46:495–519. doi: 10.1146/annurev-earth-082517-010120. - DOI
    1. Stevens, M. Sensory Ecology, Behaviour, and Evolution (Oxford University Press, 2013).
    1. Baldwin MW, Ko M-C. Functional evolution of vertebrate sensory receptors. Horm. Behav. 2020;124:104771. doi: 10.1016/j.yhbeh.2020.104771. - DOI - PubMed
    1. Buck L, Axel R. A novel multigene family may encode odorant receptors: a molecular basis for odor recognition. Cell. 1991;65:175–187. doi: 10.1016/0092-8674(91)90418-X. - DOI - PubMed

Substances