. 2024 Feb 15;15(1):1396.
doi: 10.1038/s41467-024-45752-8.

High resolution spatial profiling of kidney injury and repair using RNA hybridization-based in situ sequencing

Affiliations

High resolution spatial profiling of kidney injury and repair using RNA hybridization-based in situ sequencing

Haojia Wu et al. Nat Commun. .

Abstract

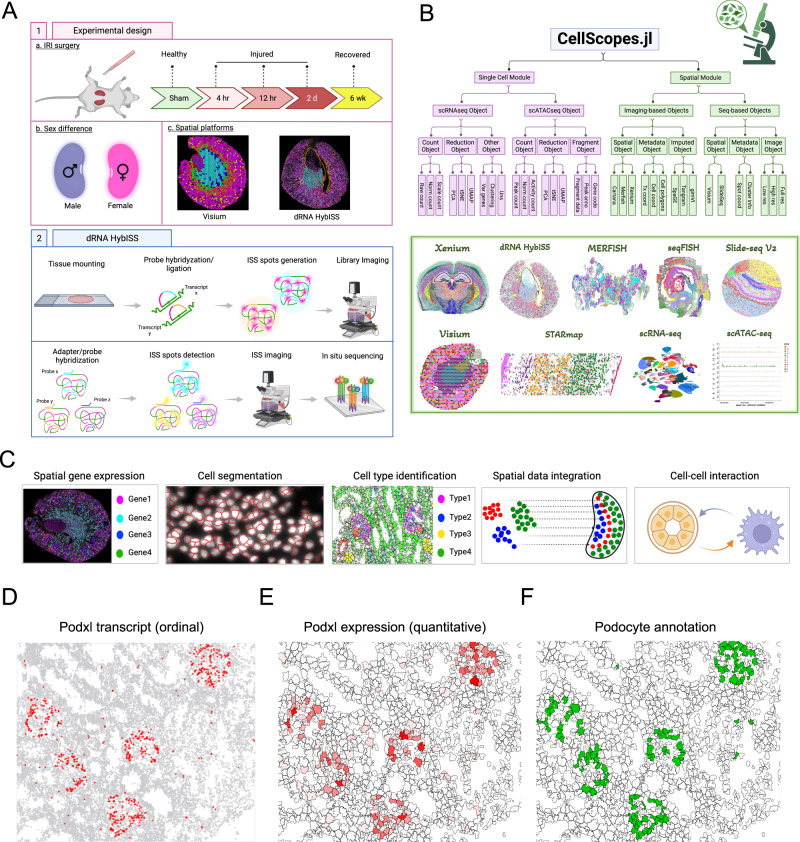
Emerging spatially resolved transcriptomics technologies allow for the measurement of gene expression in situ at cellular resolution. We apply direct RNA hybridization-based in situ sequencing (dRNA HybISS, Cartana part of 10xGenomics) to compare male and female healthy mouse kidneys and the male kidney injury and repair timecourse. A pre-selected panel of 200 genes is used to identify cell state dynamics patterns during injury and repair. We develop a new computational pipeline, CellScopes, for the rapid analysis, multi-omic integration and visualization of spatially resolved transcriptomic datasets. The resulting dataset allows us to resolve 13 kidney cell types within distinct kidney niches, dynamic alterations in cell state over the course of injury and repair and cell-cell interactions between leukocytes and kidney parenchyma. At late timepoints after injury, C3+ leukocytes are enriched near pro-inflammatory, failed-repair proximal tubule cells. Integration of snRNA-seq dataset from the same injury and repair samples also allows us to impute the spatial localization of genes not directly measured by dRNA HybISS.


Conflict of interest statement

B.D.H. is a consultant for Janssen Research & Development, LLC, Pfizer, Roche and Chinook Therapeutics, holds equity in Chinook Therapeutics and grant funding from Pfizer, all unrelated to the current study. D.C., H.X., A.N. and M.R. were employees of 10X Genomics during this study. M.R. holds stock options in 10X Genomics. The remaining authors declare no competing interests.

Figures

Fig. 1
Fig. 1. dRNA HybISS workflow, experimental design and computational analysis.
A Schematic of using dRNA HybISS to study AKI. Schematic was created with BioRender. B A Julia package, CellScopes.jl, was developed for spatial data processing, analysis and visualization. Image was created with BioRender. C Outline of the spatial analysis pipeline used in this study, created with BioRender. DF CellScopes.jl allows for visualization of gene expression on cells as data points (D), segmented polygons (E), and cell-type annotations (F).
Fig. 2
Fig. 2. Major cell types and their spatial organizations in the kidney as revealed by dRNA HybISS.
A Spatial distributions of major cell types in the whole kidney and close-ups of cell-type organizations in glomerulus, cortex, outer medulla, inner medulla, papilla and renal artery. Podo podocytes, JGA juxtaglomerular apparatus cells, gEC glomerular endothelial cells, aEC arterial endothelial cells, Fib fibroblasts, HealthyPT healthy proximal tubular cells, InjPT injured proximal tubular cells, TAL thick ascending limb of Loop of Henle, DCT distal deconvoluted tubule, CD-PC collecting duct principal cells, CD-IC collecting duct intercalated cells, Immune immune cells, Uro urothelial cells. B Expression known marker genes to define the cell-type identity. C Spatial distance between the two EC subtypes and the podocyte. n = 2812 podocytes. The line inside the box of the box plot represents the median and the boxes indicate 25th/75th percentile. Solid lines represent the full range of the distribution. Mann–Whitney U test was performed to determine the significance of the difference. D Change of transcript and cell proportion from cortex to papilla. **, P < 0.001; n.s. not significant.
Fig. 3
Fig. 3. Spatial conserved and divergent gene expression in female and male kidneys.
A Same cell types were identified from female and male kidneys. B Female and male kidney cell types express conserved markers. C Spatial expression of cell markers were validated by dRNA HybISS. D Expression of the sex dimorphic genes in proximal tubule. E Spatial distribution of the sex dimorphic genes in the kidney. PTS1 proximal tubule S1 segment, PTS2 proximal tubule S2 segment, PTS3 proximal tubule S3 segment.
Fig. 4
Fig. 4. Visium and dRNA HybISS integration to measure the cell-type composition.
A Cell-type classification by Visium on the kidney section adjacent to the section that has been profiled with dRNA HybISS. B Dotplot to show the expression of cell-type-specific markers in the cell types identified by Visium and dRNA HybISS. C Overlay of the Visium and dRNA HybISS images to inspect the cell-type-specific markers expression on each modality. D Visualization of the cell types in dRNA HybISS. E Using the cell-type information from dRNA HybISS to measure the cell-type composition for each Visium spot.
Fig. 5
Fig. 5. Spatial dynamics of cell type and gene expression changes in acute kidney injury.
A Cell-type composition in IRI timecourse. B Spatial expression patterns of the known disease genes that marks injured PT, immune cells and fibroblasts in IRI timecourse. C Spatial-temporal expression of disease genes in each phase of AKI. C cortex, P papilla.
Fig. 6
Fig. 6. Gene imputation for IRI timecourse and independent validation of imputation.
A Cell-type-specific expression of the disease genes Nox4, Tarm1, Klhl3, and Frmpd4 across IRI timecourse as revealed by snRNA-seq. B Visualization of imputed gene expression and spatial distribution for Nox4, Tarm1, Klhl3, and Frmpd4. C Validation of Nox4 expression in kidney tissue across the IRI timecourse. Kidney section was costained with Nox4 (green), Havcr1 (red) and; Lotus Tetragonolobus Lectin (LTL, white).
Fig. 7
Fig. 7. Heterogeneity of immune cells in the recovery phase of AKI.
A Classification of immune subsets at week 6. B Marker genes to define the immune cell identities. C Immune subtypes at week 6 of IRI were mapped to the immune cell types identified from the UUO kidney using Pearson correlation analysis. Mono monocytes, Mac macrophages, DC dendritic cells. D Spatial distribution of each immune cell type in the kidney. E Spatial proximity of failed-repair proximal tubular cells (FR-PT) and each immune subtype through cell-enrichment analysis. F, G Visualization of the C3+ immune cells and FR-PT in a selected kidney region.

References

    1. Muto Y, et al. Single cell transcriptional and chromatin accessibility profiling redefine cellular heterogeneity in the adult human kidney. Nat. Commun. 2021;12:2190. doi: 10.1038/s41467-021-22368-w. - DOI - PMC - PubMed
    1. Muto Y, et al. Defining cellular complexity in human autosomal dominant polycystic kidney disease by multimodal single cell analysis. Nat. Commun. 2022;13:6497. doi: 10.1038/s41467-022-34255-z. - DOI - PMC - PubMed
    1. Wilson PC, et al. Multimodal single cell sequencing implicates chromatin accessibility and genetic background in diabetic kidney disease progression. Nat. Commun. 2022;13:5253. doi: 10.1038/s41467-022-32972-z. - DOI - PMC - PubMed
    1. Miao Z, et al. Single cell regulatory landscape of the mouse kidney highlights cellular differentiation programs and disease targets. Nat. Commun. 2021;12:2277. doi: 10.1038/s41467-021-22266-1. - DOI - PMC - PubMed
    1. Kuppe C, et al. Decoding myofibroblast origins in human kidney fibrosis. Nature. 2021;589:281–286. doi: 10.1038/s41586-020-2941-1. - DOI - PMC - PubMed