. 2024 Jun;45(6):1287-1304.
doi: 10.1038/s41401-024-01232-9. Epub 2024 Feb 15.

Quantitative systems pharmacology modeling of HER2-positive metastatic breast cancer for translational efficacy evaluation and combination assessment across therapeutic modalities

Affiliations

Quantitative systems pharmacology modeling of HER2-positive metastatic breast cancer for translational efficacy evaluation and combination assessment across therapeutic modalities

Ya-Ting Zhou et al. Acta Pharmacol Sin. 2024 Jun.

Abstract

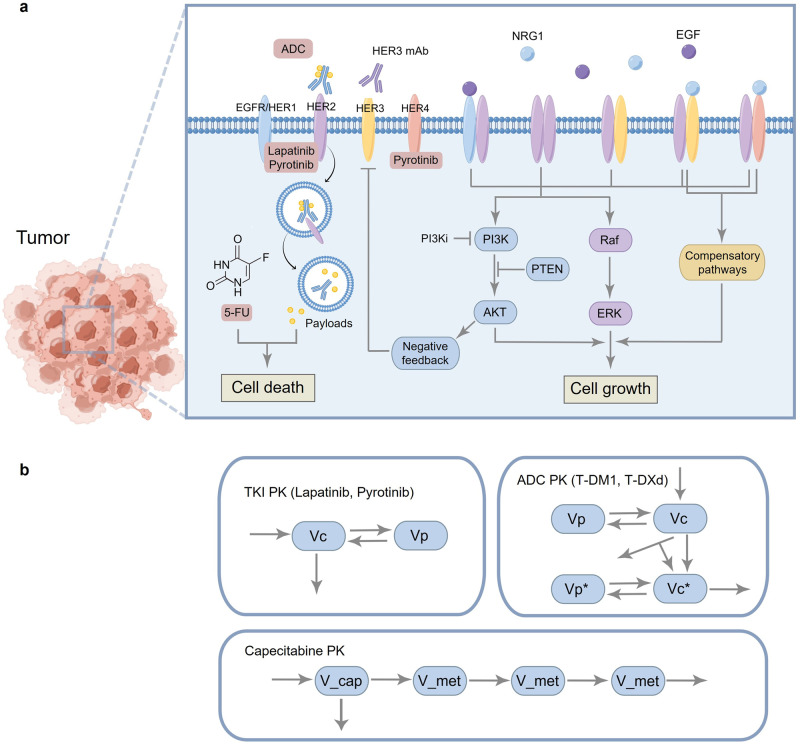
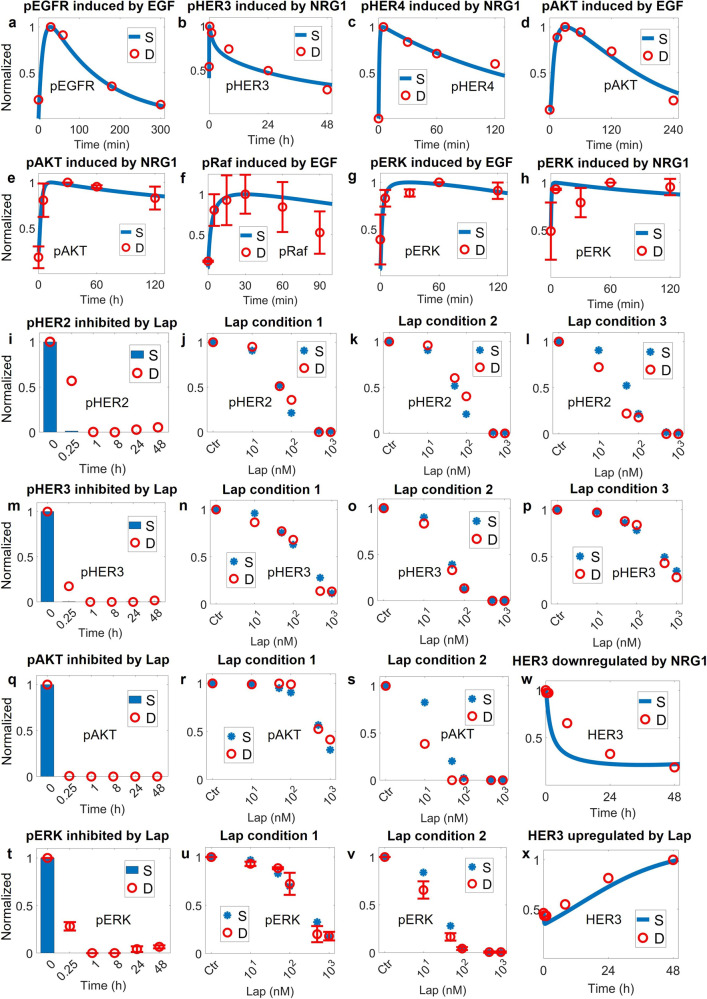
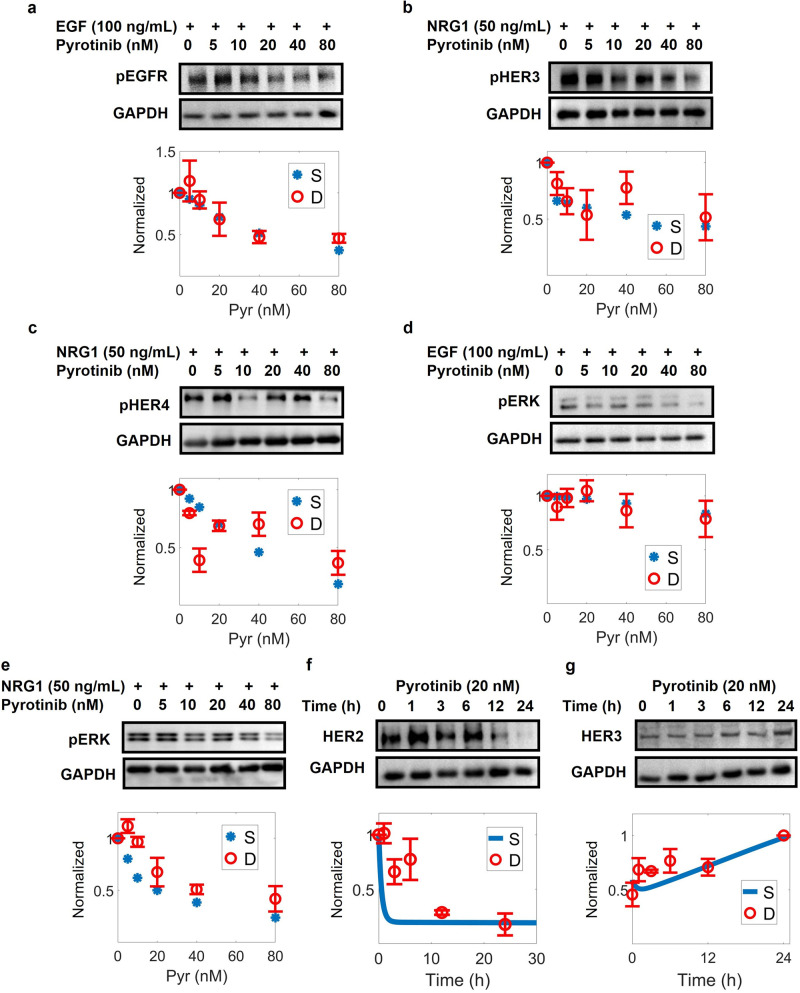
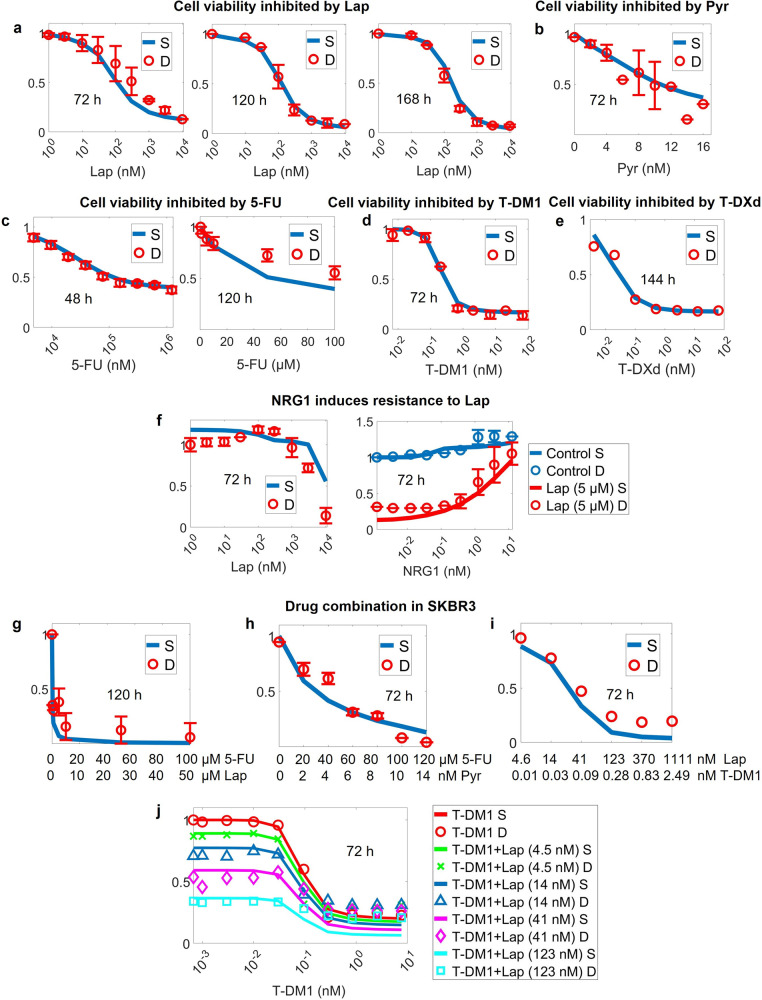
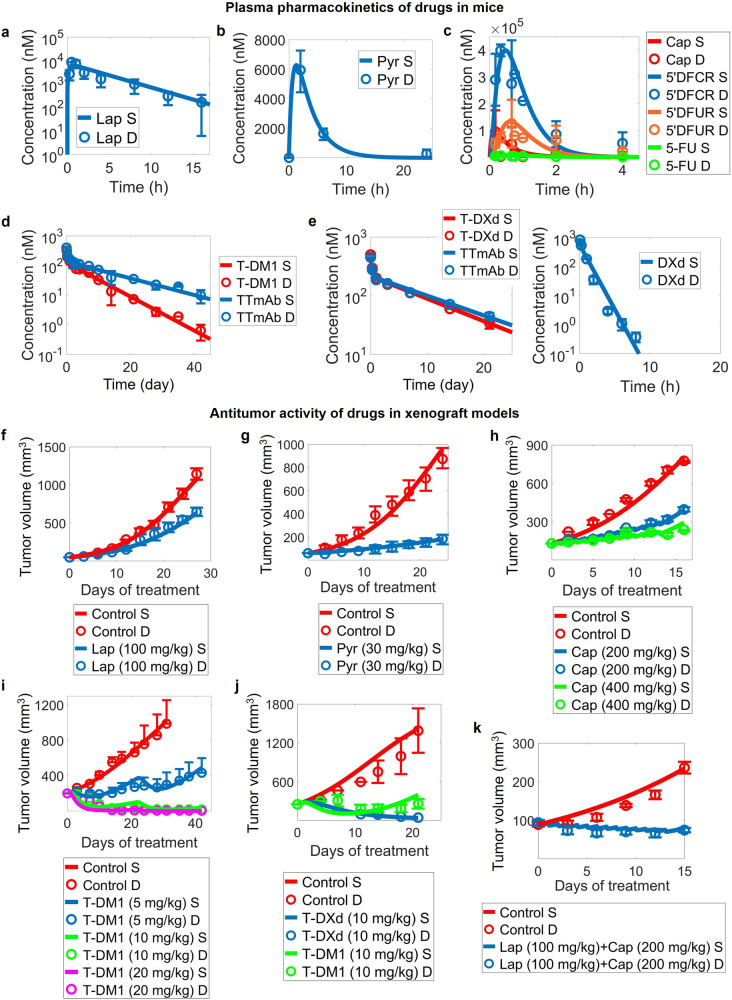
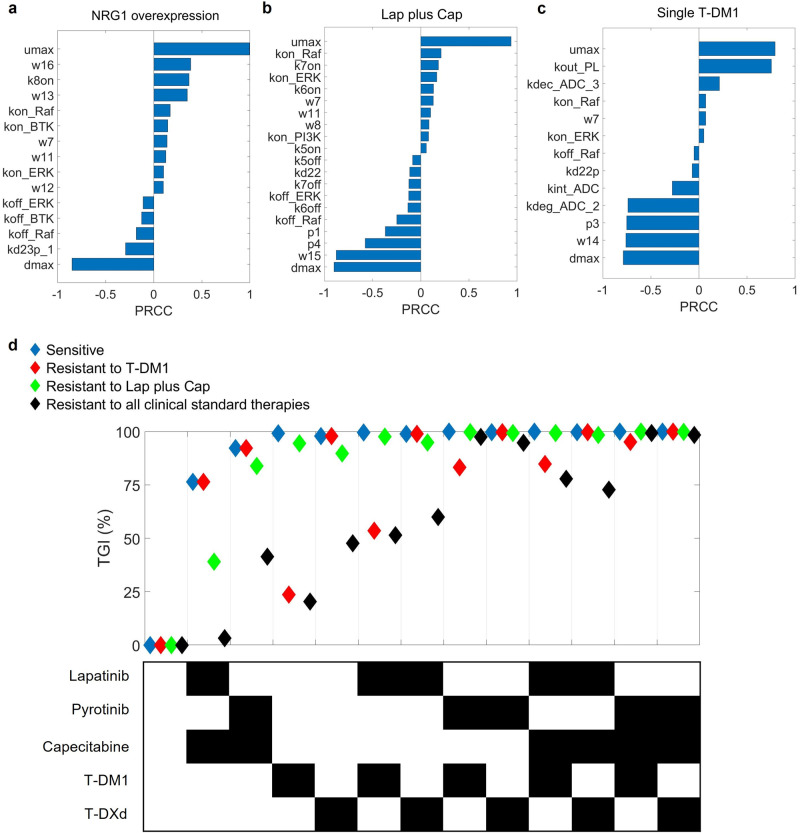
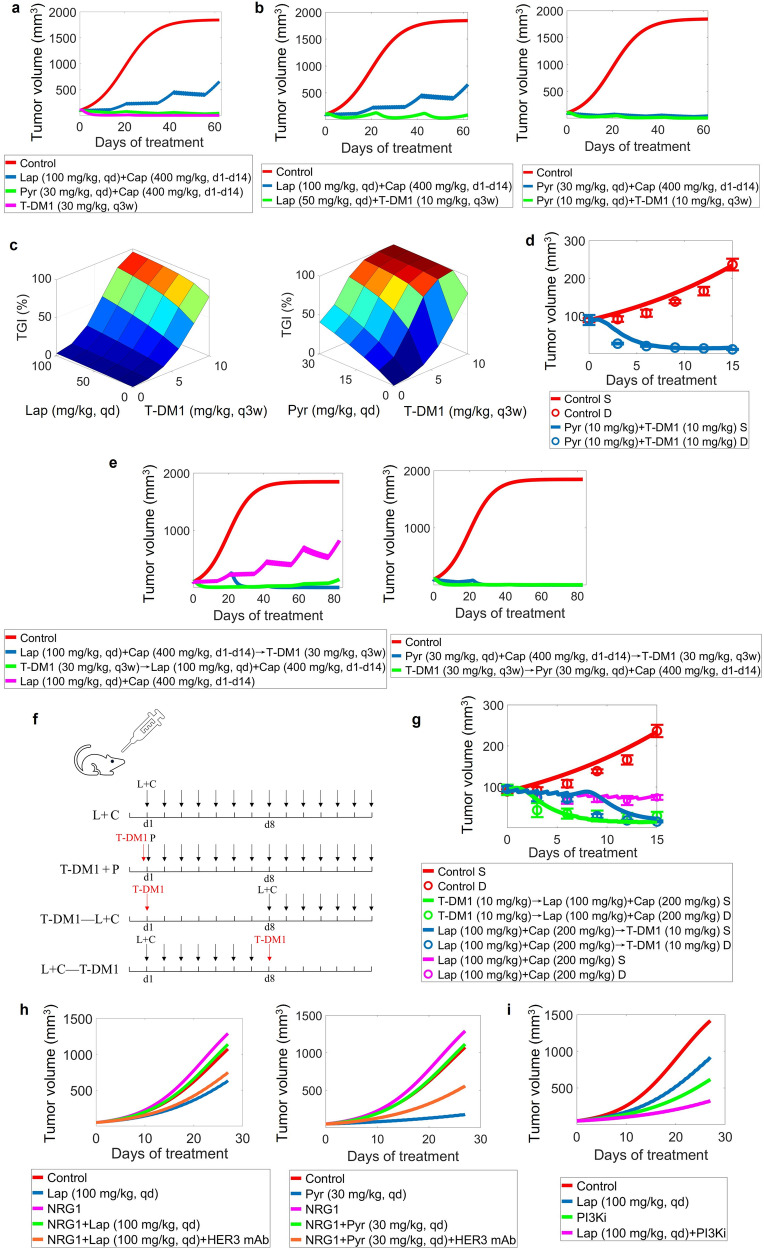
HER2-positive (HER2+) metastatic breast cancer (mBC) is highly aggressive and a major threat to human health. Despite the significant improvement in patients' prognosis given the drug development efforts during the past several decades, many clinical questions still remain to be addressed such as efficacy when combining different therapeutic modalities, best treatment sequences, interindividual variability as well as resistance and potential coping strategies. To better answer these questions, we developed a mechanistic quantitative systems pharmacology model of the pathophysiology of HER2+ mBC that was extensively calibrated and validated against multiscale data to quantitatively predict and characterize the signal transduction and preclinical tumor growth kinetics under different therapeutic interventions. Focusing on the second-line treatment for HER2+ mBC, e.g., antibody-drug conjugates (ADC), small molecule inhibitors/TKI and chemotherapy, the model accurately predicted the efficacy of various drug combinations and dosing regimens at the in vitro and in vivo levels. Sensitivity analyses and subsequent heterogeneous phenotype simulations revealed important insights into the design of new drug combinations to effectively overcome various resistance scenarios in HER2+ mBC treatments. In addition, the model predicted a better efficacy of the new TKI plus ADC combination which can potentially reduce drug dosage and toxicity, while it also shed light on the optimal treatment ordering of ADC versus TKI plus capecitabine regimens, and these findings were validated by new in vivo experiments. Our model is the first that mechanistically integrates multiple key drug modalities in HER2+ mBC research and it can serve as a high-throughput computational platform to guide future model-informed drug development and clinical translation.

Keywords: HER2+ metastatic breast cancer; drug resistance; model-informed drug development; quantitative systems pharmacology; therapeutic combinations.


Conflict of interest statement

The authors declare no competing interests.

Figures

Fig. 1
Fig. 1. Diagram of the mechanistic model structure.
a Tumor cell module. At the input level are four ErbB receptors and their respective ligands. Ligand-receptor binding induces dimerization of receptors, activating downstream pathways and regulating cell growth. Transcription factors such as FOXO mediate negative feedback of HER3. Five drugs with unique mechanisms of action are presented and will lead to cell death through different cellular interactions within the system. The model can also simulate drugs for other targets, such as HER3 antibodies, PI3K inhibitors, etc. b Pharmacokinetic modules of lapatinib, pyrotinib, T-DM1, T-DXd and capecitabine. Vc and Vp are central and peripheral compartments for TKI (lapatinib, pyrotinib) or ADC (T-DM1, T-DXd). Vc* and Vp* are central and peripheral compartments for payloads of ADC (DM1, DXd). V_cap and V_met are compartments for capecitabine and its metabolites (5’DFCR, 5’DFUR and 5-FU). The overall figure is created by Figdraw and a more detailed model diagram with specific model species and reaction fluxes is shown in Supplementary Fig. S9.
Fig. 2
Fig. 2. Model calibration of phospho-receptors and downstream PI3K/AKT, Ras/MAPK signal transduction at the cell level.
a EGF (100 ng/mL) induces activation of EGFR. NRG1 (b 50 ng/mL, c 200 ng/mL) induces activation of HER3 and HER4. d EGF (20 ng/mL) induces activation of downstream AKT. e NRG1 (10 ng/mL) induces activation of downstream AKT. EGF (f 100 ng/mL, g 50 ng/mL) induces activation of downstream Raf and ERK axis. h NRG1 (10 ng/mL) induces activation of downstream ERK. Lapatinib induces time-dependent and dose-dependent inhibition of (il) HER2, (mp) HER3 and downstream (qs) AKT, (tv) ERK. w NRG1 (50 ng/mL) reduces HER3 expression. x Lapatinib induces HER3 expression. ax All data are from experiments in the SKBR3 cell line, except in (c) (MCF7, HER2 0–1+) and (f) (BT20 transfected with ErbB2). Y axes are relative expression levels (normalized to their respective maximum values). Lap condition 1, simultaneous addition of lapatinib and NRG1 (50 ng/mL) for 15 min; Lap condition 2, lapatinib alone for 15 min; Lap condition 3, NRG1 (50 ng/mL) for 15 min followed by lapatinib for 15 min; S, simulation; D, experimental data; Ctr, control/untreated condition.
Fig. 3
Fig. 3. Effect of pyrotinib treatment on ErbB signaling in SKBR3 cells and corresponding model calibration.
a Dose-dependent inhibition of EGFR after pyrotinib and EGF treatment for 60 min. b Dose-dependent inhibition of HER3 after pyrotinib and NRG1 treatment for 60 min. c Dose-dependent inhibition of HER4 after pyrotinib and NRG1 treatment for 60 min. d Dose-dependent inhibition of ERK after pyrotinib and EGF treatment for 60 min. e Dose-dependent inhibition of ERK after pyrotinib and NRG1 treatment for 60 min. f HER2 expression in response to pyrotinib treatment. g HER3 expression in response to pyrotinib treatment. ag Contains immunoblots showing differential regulation of ErbB signaling proteins under various treatment conditions and the immunoblot data (n = 3) were quantified and used as calibration data; GAPDH levels were used as controls. Y axes are relative expression levels, with (ae) normalized to their respective control condition (e.g., pyrotinib 0 nM) and (f, g) normalized to their respective maximum values. S, simulation; D, experimental data.
Fig. 4
Fig. 4. Model calibration of cell viability with single drug treatment data and validation with drug combinations.
Dose-dependent inhibition of cell viability after exposure to (a) lapatinib for 72, 120, or 168 h, respectively, (b) pyrotinib for 72 h, (c) 5-FU for 48 or 120 h, respectively, (d) T-DM1 for 72 h and (e) T-DXd for 144 h. f Proliferation of cells treated with various concentrations of lapatinib for 72 h in the presence of NRG1 (left). The addition of NRG1 promotes cell proliferation and confers resistance to lapatinib dose-dependently (right). Dose-dependent inhibition of cell viability after combination treatments of (g) lapatinib with 5-FU for 120 h, (h) pyrotinib with 5-FU for 72 h and (i, j) lapatinib with T-DM1 for 72 h. All data are from experiments in the SKBR3 cell line. Y axes are relative viability levels (normalized to their respective DMSO controls, e.g., untreated conditions). S, simulation; D, experimental data.
Fig. 5
Fig. 5. In vivo translation of the quantitative systems pharmacology model.
Plasma pharmacokinetics of (a) lapatinib at 60 mg/kg, (b) pyrotinib at 80 mg/kg, (c) capecitabine at 755 mg/kg, (d) T-DM1 at 3 mg/kg, (e, left) T-DXd at 3 mg/kg and (e, right) DXd at 1 mg/kg in mice. In vivo antitumor activity of (f) lapatinib, (g) pyrotinib, (h) capecitabine, (i) T-DM1 and (j) T-DXd in breast cancer xenograft models. Tumor kinetics in (f, g) are from experiments in SKBR3 xenografts, in (h, i) are from KPL4 xenografts and in (j) are from a breast cancer PDX model with HER2 overexpression. k Model-predicted and in-house experimentally measured tumor growth kinetics in SKBR3 xenograft mice that received combination regimen of lapatinib plus capecitabine. In the simulations, tumors were allowed to grow to certain volumes before drug administration according to the different studies referenced and the maximum tumor volume was fixed to 2000 mm3. We assume that the weight of a mouse is approximately 20 g. S, simulation; D, experimental data.
Fig. 6
Fig. 6. Sensitivity analysis and simulation of diverse treatment responses reflecting heterogeneous individual phenotypes.
Partial rank correlation coefficients (PRCC) indices for parameters that significantly impact tumor volume (with absolute PRCC values greater than 0.05) under (a) NRG1 overexpression, (b) lapatinib plus capecitabine and (c) single agent T-DM1 conditions. The positive or negative signs of PRCC values represent a positive or negative effect on the model output. d Model simulations of tumor growth inhibition (TGI) after one cycle of treatment (e.g., TGI measured on day 20) using 13 different regimens for the four different response phenotypes, with blue representing a phenotype sensitive to all treatments, red—resistant to single T-DM1, green—resistant to lapatinib plus capecitabine, and black—resistant to all existing clinical standard therapies (lapatinib or pyrotinib plus capecitabine, single agent T-DM1 and T-DXd). The dosages are given as follows: lapatinib 100 mg/kg, qd; pyrotinib 30 mg/kg, qd; capecitabine 400 mg/kg, d1–d14 (e.g., days 1–14 of a 21-day cycle); T-DM1 30 mg/kg, q3w; T-DXd 10 mg/kg, q3w.
Fig. 7
Fig. 7. Model evaluation and experimental validation of tumor response kinetics in mice under different drug treatment strategies.
a Simulated efficacy of different drug regimens used in clinical practice, including lapatinib plus capecitabine, pyrotinib plus capecitabine and single T-DM1. b Simulated antitumor effects of the new combination regimen of lapatinib or pyrotinib plus T-DM1 versus classic lapatinib or pyrotinib plus capecitabine. c Simulated tumor growth inhibition (TGI) in response to combinations of lapatinib or pyrotinib with T-DM1 over a range of doses (lapatinib 20–100 mg/kg qd, pyrotinib 6–30 mg/kg qd, and T-DM1 2–10 mg/kg q3w, respectively). Tumor volumes were analyzed after three treatment cycles (e.g., on day 62). d QSP model prediction and in-house experimental validation of tumor growth kinetics in vivo in response to combination regimen of pyrotinib (10 mg/kg) plus T-DM1 (10 mg/kg); S, simulation; D, experimental data. e Simulated antitumor effects of sequential therapies of lapatinib or pyrotinib plus capecitabine followed by T-DM1 or T-DM1 followed by lapatinib or pyrotinib plus capecitabine. f The drug administration protocol of the in vivo mouse xenograft experiments (L, lapatinib; C, capecitabine; P, pyrotinib; see Methods section for details). g QSP model prediction and in-house experimental validation of tumor growth kinetics in vivo in response to sequential regimen between T-DM1 and lapatinib plus capecitabine; S, simulation; D, experimental data. h Simulated tumor growth trends under single lapatinib or pyrotinib, NRG1 (representing the overexpression-induced resistant scenario), and the combination as well as in the presence of HER3 mAb. i Simulated tumor growth trends under single lapatinib, PI3K inhibitor and their combination when tumor growth is highly dependent on the PI3K/AKT pathway. See the legends for the detailed dosage and frequency of administrations, where a treatment cycle is 21 days and d1–d14 means capecitabine is administered on days 1–14 of each cycle.

Similar articles

Cited by

References

    1. Loibl S, Gianni L. HER2-positive breast cancer. Lancet. 2017;389:2415–29. doi: 10.1016/S0140-6736(16)32417-5. - DOI - PubMed
    1. Slamon DJ, Clark GM, Wong SG, Levin WJ, Ullrich A, McGuire WL. Human breast cancer: correlation of relapse and survival with amplification of the HER-2/neu oncogene. Science. 1987;235:177–82. doi: 10.1126/science.3798106. - DOI - PubMed
    1. Swain SM, Baselga J, Kim SB, Ro J, Semiglazov V, Campone M, et al. Pertuzumab, trastuzumab, and docetaxel in HER2-positive metastatic breast cancer. N Engl J Med. 2015;372:724–34. doi: 10.1056/NEJMoa1413513. - DOI - PMC - PubMed
    1. Hurvitz SA, Hegg R, Chung WP, Im SA, Jacot W, Ganju V, et al. Trastuzumab deruxtecan versus trastuzumab emtansine in patients with HER2-positive metastatic breast cancer: updated results from DESTINY-Breast03, a randomised, open-label, phase 3 trial. Lancet. 2023;401:105–17. doi: 10.1016/S0140-6736(22)02420-5. - DOI - PubMed
    1. Dieras V, Miles D, Verma S, Pegram M, Welslau M, Baselga J, et al. Trastuzumab emtansine versus capecitabine plus lapatinib in patients with previously treated HER2-positive advanced breast cancer (EMILIA): a descriptive analysis of final overall survival results from a randomised, open-label, phase 3 trial. Lancet Oncol. 2017;18:732–42. doi: 10.1016/S1470-2045(17)30312-1. - DOI - PMC - PubMed

MeSH terms