. 2024 Feb 15;7(1):183.
doi: 10.1038/s42003-024-05834-1.

The Drosophila ZNRF1/2 homologue, detour, interacts with HOPS complex and regulates autophagy

Affiliations

The Drosophila ZNRF1/2 homologue, detour, interacts with HOPS complex and regulates autophagy

Shannon Nicolson et al. Commun Biol. .

Abstract

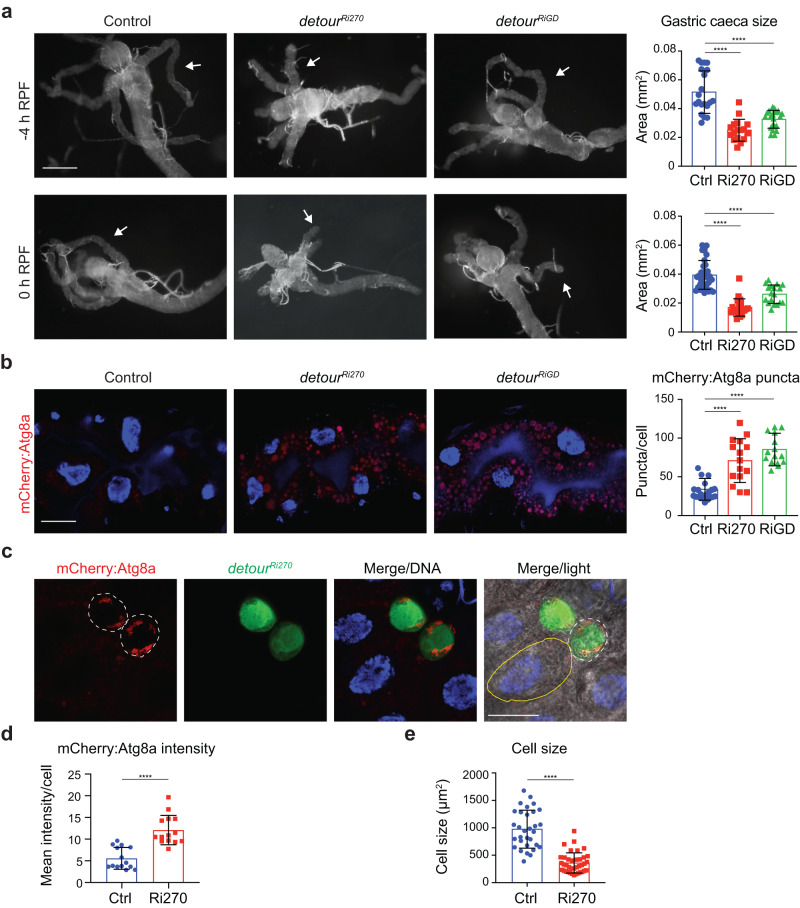
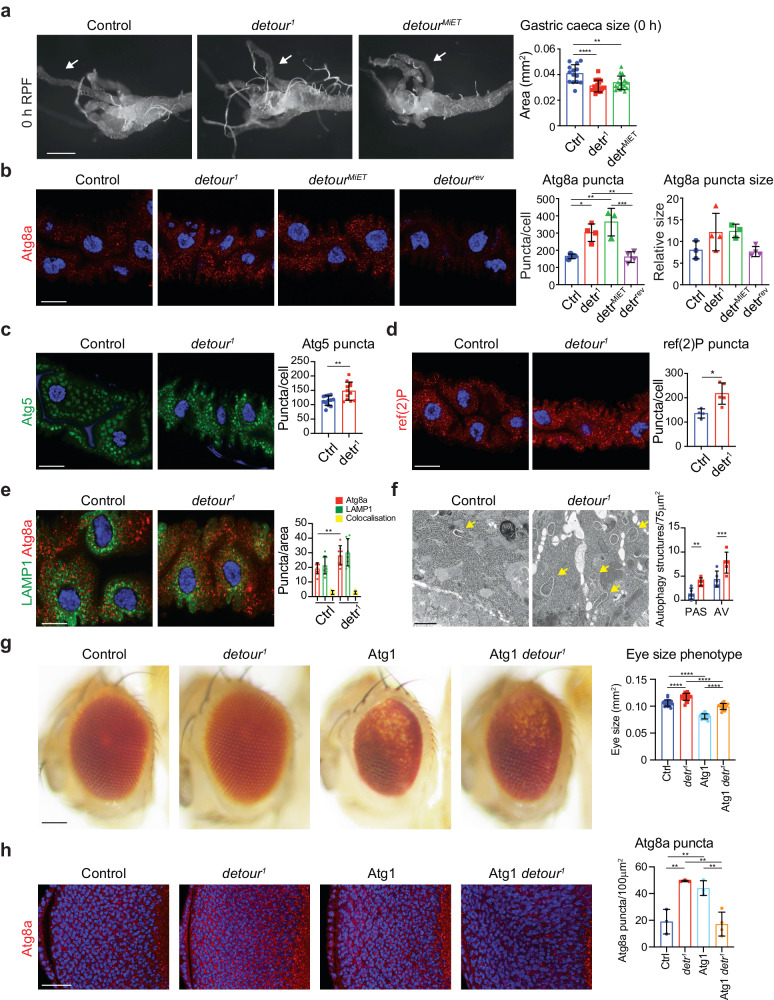
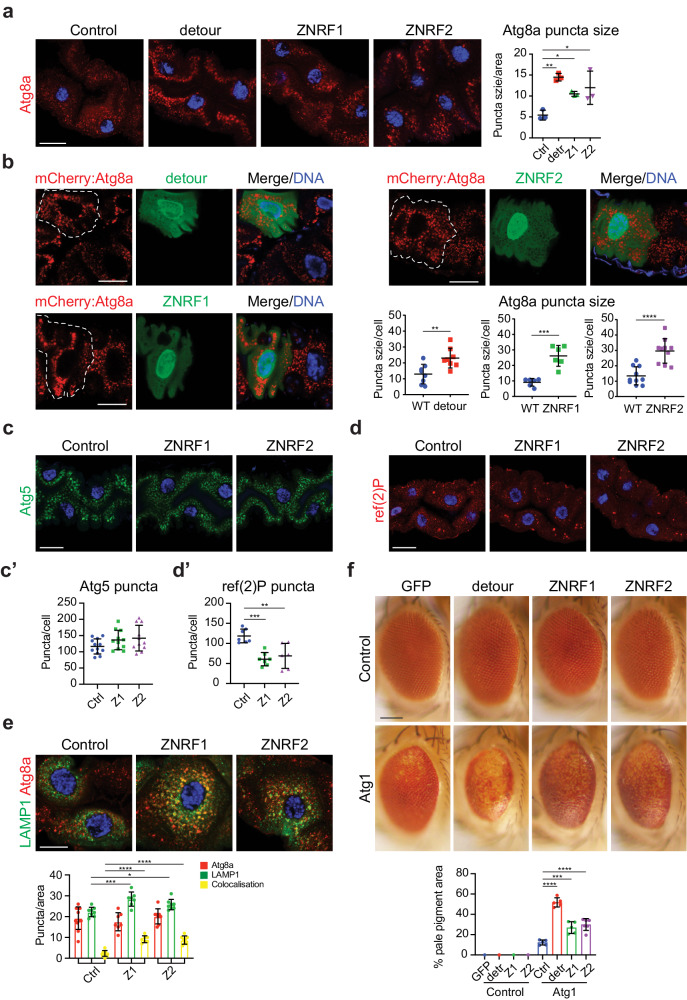
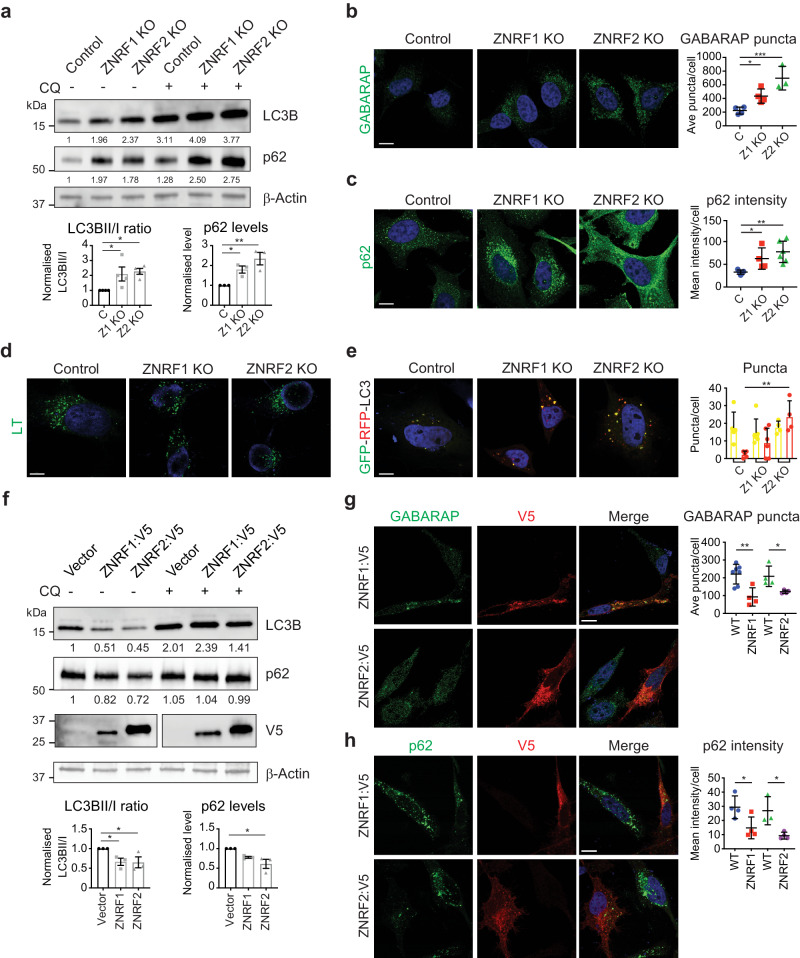
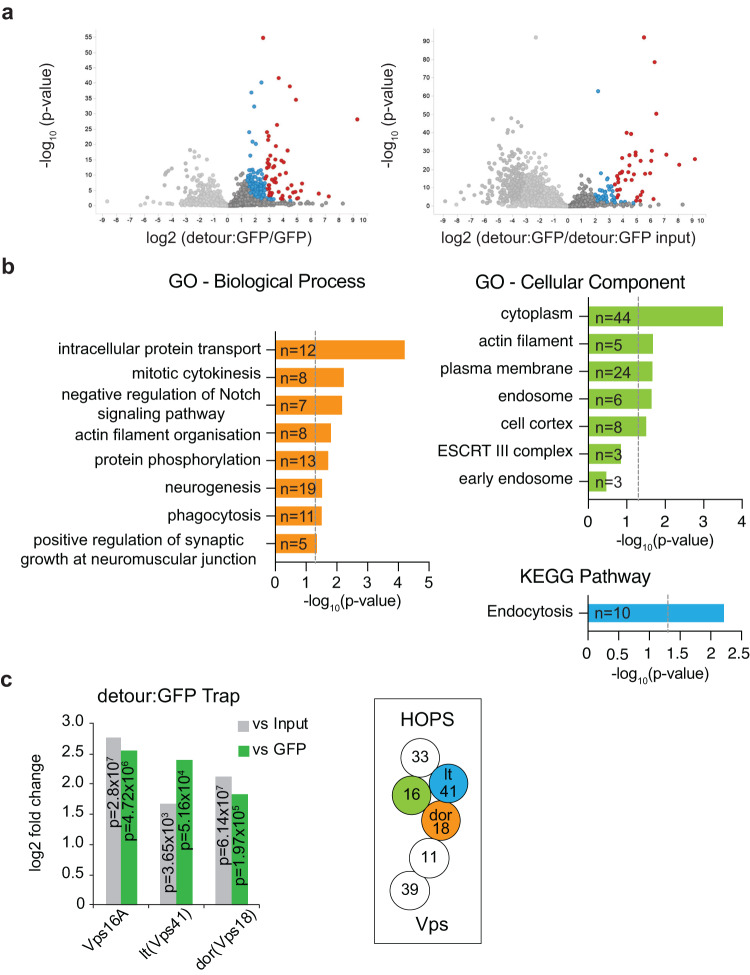
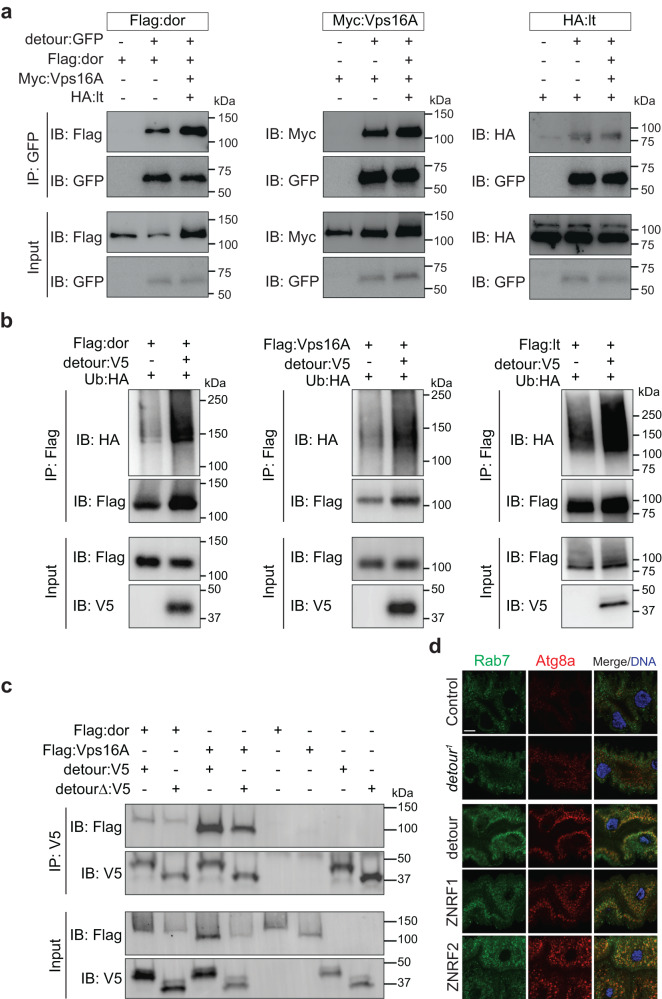
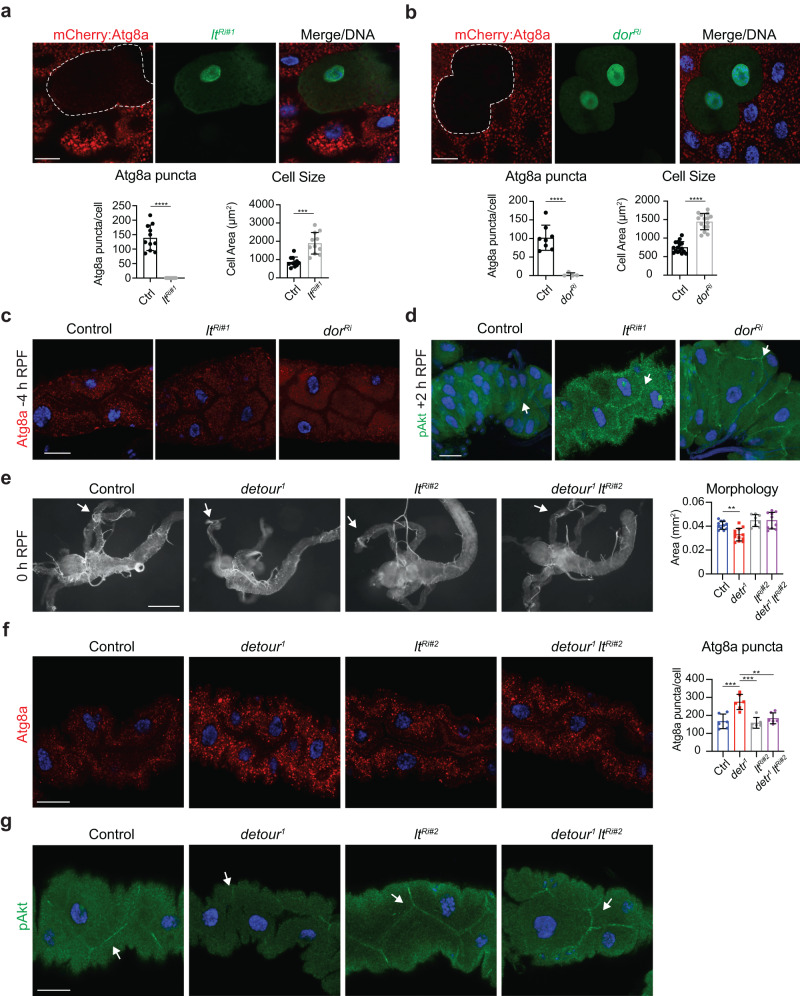
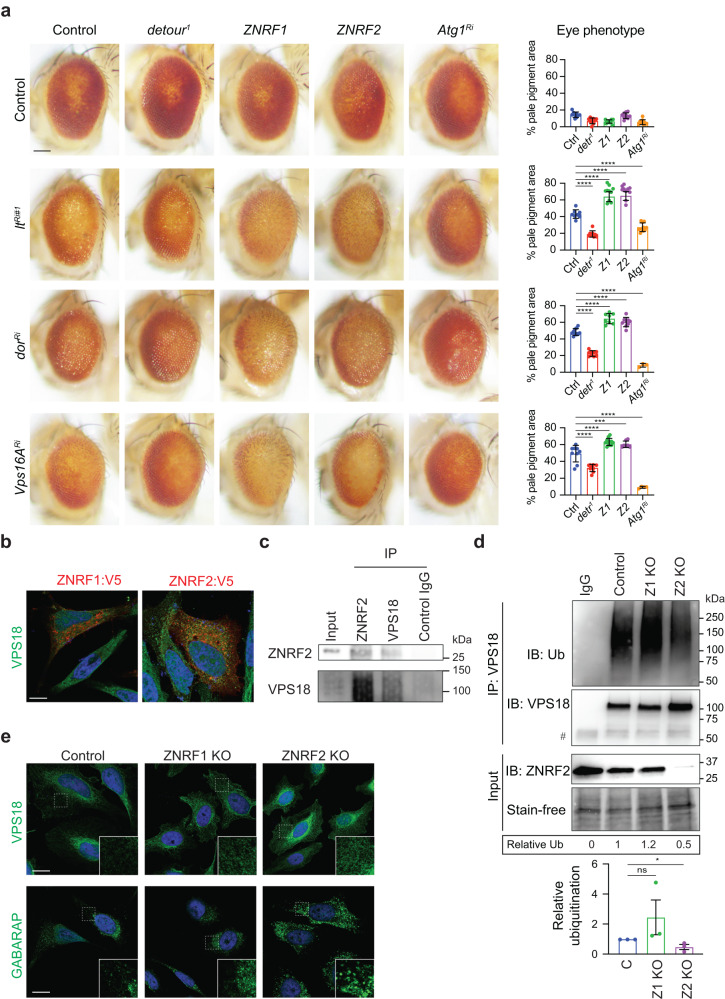
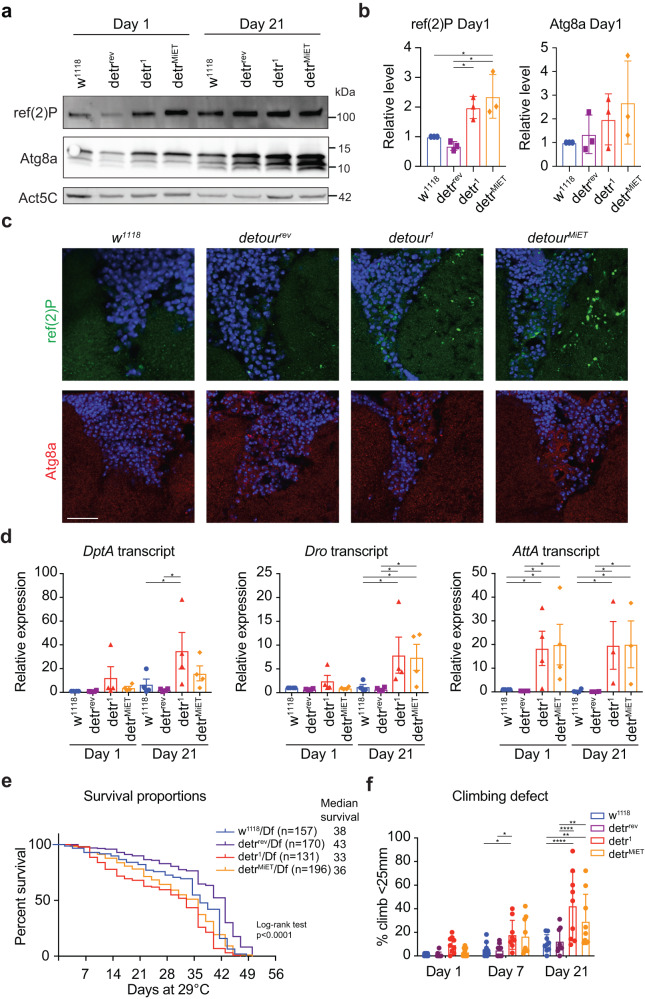
Autophagy, the process of elimination of cellular components by lysosomal degradation, is essential for animal development and homeostasis. Using the autophagy-dependent Drosophila larval midgut degradation model we identified an autophagy regulator, the RING domain ubiquitin ligase CG14435 (detour). Depletion of detour resulted in increased early-stage autophagic vesicles, premature tissue contraction, and overexpression of detour or mammalian homologues, ZNRF1 and ZNRF2, increased autophagic vesicle size. The ablation of ZNRF1 or ZNRF2 in mammalian cells increased basal autophagy. We identified detour interacting proteins including HOPS subunits, deep orange (dor/VPS18), Vacuolar protein sorting 16A (VPS16A), and light (lt/VPS41) and found that detour promotes their ubiquitination. The detour mutant accumulated autophagy-related proteins in young adults, displayed premature ageing, impaired motor function, and activation of innate immunity. Collectively, our findings suggest a role for detour in autophagy, likely through regulation of HOPS complex, with implications for healthy aging.


Conflict of interest statement

The authors declare no competing interest regarding the publication of this paper.

Figures

Fig. 1
Fig. 1. Knockdown of detour increases autophagic vesicles and midgut degradation.
a Morphology of control (Mex-GAL4/+; pmCherry-Atg8a/+), and detour knockdown (Ri270 and RiGD) (Mex-GAL4/+; pmCherry-Atg8a/UAS-detour Ri) midguts at -4 h and 0 h RPF showed smaller midguts and increased contraction of gastric caeca (arrow). Scale bar = 200 µm. Quantitation of gastric caeca size at -4 h and 0 h RPF. Data presented as area ± SD (****p < 0.0001). b The knockdown of detour has increased mCherry:Atg8a (red) puncta in the larval midguts at -4 h RPF compared to controls (Mex-GAL4/+; pmCherry-Atg8a/+). DNA is stained with Hoechst (blue). Scale bar = 20 μm. Quantitation of puncta at -4 h RPF performed using ImageJ. Data presented as average puncta/cell ± SD (****p < 0.0001). c Clone cells of detour knockdown (hsFLP; pmCherry-Atg8a/+; Act > CD2 > GAL4, UAS-nlsGFP/UAS-detour Ri270) in the midgut marked by GFP (green) have increased mCherry:Atg8a puncta (red, outlined with dotted line) compared to the neighbouring control cells (non-GFP, outlined with yellow line in merge/light) at -4 h RPF. DNA is stained by Hoechst (blue). Scale bar = 20 μm. d Quantitation of mCherry:Atg8a represented as mean intensity/cell ± SD (****p < 0.0001). e Quantitation of cell size represented as area ± SD (****p < 0.0001).
Fig. 2
Fig. 2. detour mutants have increased autophagic vesicles.
a Morphology from detour1 and detourMiET midguts at 0 h RPF shows reduction in gastric caeca size (arrow) compared to control (w1118). Scale bar = 200 µm. Quantitation of the gastric caeca size showing significant reduction in detour1 and detourMiET compared to control. No significant difference was observed between detour1 and detourMiET. Data presented as area ± SD (****p < 0.0001, **p = 0.0035). b The Atg8a immunostaining (red) of midguts at −4 h RPF shows detour1 and detourMiET have similar levels of Atg8a puncta which are both higher compared to the controls (w1118 and detourrev). DNA is stained by Hoechst (blue). Scale bar = 20 μm. Quantitation of Atg8a positive puncta represented as puncta/cell ± SD (*p < 0.05, **p < 0.01, ***p < 0.001). Quantitation of Atg8a puncta size represented as average relative puncta size. c The eGFP:Atg5 (green) puncta in larval midguts at -4 h RPF is increased in detour1 (detour1/Y; NP1-GAL4/ + ; UAS-eGFP:Atg5/+) compared to control (w1118/Y; NP1-GAL4/ + ; UAS-eGFP:Atg5/+). DNA is stained with Hoechst (blue). Scale bar = 20 μm. Quantitation of puncta represented as average puncta/cell ± SD (**p < 0.01). d The ref(2)P immunostaining (red) of midguts at -4 h RPF shows detour1 has increased levels compared to the control (w1118). DNA is stained by Hoechst (blue). Scale bar = 20 μm. Quantitation represented as average puncta/cell ± SD (*p < 0.05). e The Atg8a (red) and GFP:LAMP (green, anti-GFP) immunostaining of midguts at −4 h RPF shows detour1 (detour1/Y; Mex-GAL4, UAS-GFP:LAMP1/+) has increased Atg8a levels of compared to the control (w1118/Y; Mex-GAL4, UAS-GFP:LAMP1/ + ). DNA is stained by Hoechst (blue). Scale bar = 10 μm. Quantitation of Atg8a (red), GFP:LAMP (green) and colocalisation (yellow) represented as average puncta/area ± SD (**p < 0.01). f Representative TEM images from sections of midgut at -4 h RPF. detour1 midgut cells have increased early autophagic structures (arrows), compared to the control. Scale bar = 1 μm. Quantitation of autophagic structures, pre-autophagosomal structure (PAS) and autophagic vesicle (AV), represented as average structures/area ± SD (**p < 0.01, ***p < 0.001). g Over-expression of the Atg1 in the developing eye (GMR>Atg1: GMR-GAL4/ + ; UAS-Atg1/+) results in a rough eye phenotype, with disruption to patterning, loss of pigmentation and reduced size compared to controls (GMR w1118: w1118/Y; GMR-GAL4/+ and GMR detour1: detour1/Y; GMR-GAL4/+). The Atg1-induced eye phenotype is supressed by detour1 (GMR>Atg1 detour1: detour1/Y; GMR-GAL4/ + ; UAS-Atg1/+), observed by increased red eye pigmentation and eye size. Scale bar = 100 μm. The eye size of GMR detour1 is increased compared to the control (GMR w1118). Quantitation of eye size phenotype represented as eye area ± SD (****p < 0.0001). h The Atg8a immunostaining (red) of the eye imaginal disc from wandering third instar larvae shows increased Atg8a in both GMR detour1 and GMR>Atg1 compared to the control (GMR w1118). The combined GMR>Atg1 detour1 results in reduction of Atg8a puncta compared to both GMR detour1 and GMR>Atg1. Scale bar = 20 μm. Quantitation of Atg8a positive puncta represented as puncta/area ± SD (**p < 0.01).
Fig. 3
Fig. 3. Overexpression of detour, ZNRF1 or ZNRF2 increases autophagic vesicle size.
a Immunostaining of larval midguts at -4 h RPF overexpressing detour (Mex-GAL4/ + ; UAS-detour:GFP/ + ), ZNRF1 (Mex-GAL4/UAS-ZNRF1) or ZNRF2 (Mex-GAL4/UAS-ZNRF2) show increased Atg8a (red) puncta size compared to control (Mex-GAL4/ + ). DNA is stained with Hoechst (blue). Scale bar = 20 μm. Quantification of Atg8a puncta size, measured in ImageJ. Data presented as average puncta ± SD (*p < 0.05, **p < 0.001). b Clone cells overexpressing detour (hsFLP; pmCherry-Atg8a/+; Act > CD2 > GAL4, UAS-nlsGFP/UAS-detour:GFP), ZNRF1 (hsFLP; pmCherry-Atg8a/UAS-ZNRF1; Act > CD2 > GAL4, UAS-nlsGFP/+) or ZNRF2 (hsFLP; pmCherry-Atg8a/ UAS-ZNRF2; Act > CD2 > GAL4, UAS-nlsGFP/+) in the midgut marked by GFP (green) have increased mCherry:Atg8a puncta size (red, clone outlined) compared to the neighbouring control cells at -4 h RPF. DNA is stained by Hoechst (blue). Scale bar = 10 μm. Quantification of mCherry:Atg8a puncta size in GFP-clone cells and neighbouring wildtype cells. Minimum of n = 6 cells. Average puncta size/cell ± SD (**p = 0.0059, ***p = 0.0002, ****p < 0.0001). c The eGFP:Atg5 (green) puncta in larval midguts at -4 h RPF in ZNRF1 (NP1-GAL4/UAS-ZNRF1; UAS-eGFP:Atg5/+) and ZNRF2 (NP1-GAL4/UAS-ZNRF2; UAS-eGFP:Atg5/+) is similar to the control (NP1-GAL4/ + ; UAS-eGFP:Atg5/+). DNA is stained with Hoechst (blue). Scale bar = 20 μm. d The ref(2)P immunostaining (red) of ZNRF1 (Mex-GAL4/UAS-ZNRF1) and ZNRF2 (Mex-GAL4/UAS-ZNRF2) midguts at -4 h RPF shows reduced levels compared to the control (Mex-GAL4/ + ). DNA is stained by Hoechst (blue). Scale bar = 20 μm. c’ Quantitation of GFP:Atg5 puncta from (c) represented as average puncta/cell ± SD. d’ Quantitation of ref(2)P puncta from d represented as average puncta/cell ± SD (**p < 0.01, ***p < 0.001). e The Atg8a (red) and GFP:LAMP (green, anti-GFP) immunostaining of midguts at −4 h RPF shows ZNRF1 (Mex-GAL4, UAS-GFP:LAMP1/UAS-ZNRF1) and ZNRF2 (Mex-GAL4, UAS-GFP:LAMP1/UAS-ZNRF2) have increased colocalisation (yellow) compared to the control (Mex-GAL4, UAS-GFP:LAMP1/ + ). DNA is stained by Hoechst (blue). Scale bar = 10 μm. Quantitation of Atg8a (red), GFP:LAMP (green) and colocalisation (yellow) represented as average puncta/area ± SD (**p < 0.01). f Over-expression of detour (GMR-GAL4/ + ; UAS-Atg1/UAS-detour:GFP), ZNRF1 (GMR-GAL4/UAS-ZNRF1; UAS-Atg1/+) or ZNRF2 (GMR-GAL4/UAS-ZNRF2; UAS-Atg1/+) in the developing eye results in mild patterning disruption compared to control (GMR-GAL4/UAS-eGFP) (top panels). Over-expression of the Atg1 in the developing eye (GMR-GAL4/ + ; UAS-Atg1/+) results in a rough eye phenotype, with disruption to patterning, loss of pigmentation and reduced size compared to control. The Atg1-induced eye phenotype is enhanced by overexpression of detour (GMR-GAL4/ + ; UAS-Atg1/UAS-detour:GFP), ZNRF1 (GMR-GAL4/UAS-ZNRF1; UAS-Atg1/+) or ZNRF2 (GMR-GAL4/UAS-ZNRF2; UAS-Atg1/+), observed by the loss of red eye pigmentation (bottom panels). Scale bar = 100 μm. Quantitation of the pale eye pigmentation phenotype represented as percentage ± SD (****p < 0.0001).
Fig. 4
Fig. 4. ZNRF1 and ZNRF2 maintain basal autophagy in HeLa cells.
a Immunoblot analysis of LC3B and p62 protein levels in whole cell lysates from control, ZNRF1 KO and ZNRF2 KO HeLa cells with or without 4 h of chloroquine (CQ) treatment. β-Actin used as a loading control. Numbers represent quantitation of the shown immunoblot normalised to β-Actin and compared to Control. Three immunoblot replicates were quantified, normalised to β-Actin and graphed as relative expression to WT cell line. Average ± SD (*p < 0.05, **p < 0.01). b Immunostaining of control, ZNRF1 and ZNRF2 KO HeLa cells with GABARAP antibody (green) merged with nuclei stained by Hoechst (blue). Scale bar = 10 µm. Quantification of GABARAP-positive puncta number using ImageJ software ± SD (*p < 0.05, **p = 0.001). c Immunostaining of control, ZNRF1 and ZNRF2 KO HeLa cells with p62 antibody (green) merged with nuclei stained by Hoechst (blue). Scale bar = 10 µm. Quantification of p62 fluorescence intensity using photoshop histogram function ± SD (**p < 0.01). d LysoTracker staining of control, ZNRF1 and ZNRF2 KO HeLa cells merged with nuclei stained by Hoechst (blue). Scale bar = 10 µm. e Control, ZNRF1 and ZNRF2 KO HeLa cells transfected with GFP-RFP-LC3 merged with nuclei stained by Hoechst (blue). Scale bar = 10 µm. Quantification of GFP-RFP-LC3 (yellow) and RFP-LC3 (red) fluorescence represented as puncta/cell ± SD (**p < 0.01). f Immunoblot analysis of LC3B and p62 protein levels in whole cell lysates transfected with control (vector), ZNRF1:V5 and ZNRF2:V5 HeLa cells with or without 4 h of chloroquine (CQ) treatment. β-Actin used as a loading control. Numbers represent quantitation of the shown immunoblot normalised to β-Actin and compared to Control. Three immunoblot replicates were quantified, normalised to β-Actin and graphed as relative expression to WT cell line. Average ± SD (*p < 0.05, **p < 0.01). g Immunostaining of HeLa cells transfected with ZNRF1:V5 and ZNRF2:V5 with GABARAP antibody (green), V5 (red), and merged with nuclei stained by Hoechst (blue). Scale bar = 10 µm. Quantification of GABARAP-positive puncta number using ImageJ software ± SD (*p < 0.05, **p = 0.001). h Immunostaining of HeLa cells transfected with ZNRF1:V5 and ZNRF2:V5 with p62 antibody (green), V5 (red), and merged with nuclei stained by Hoechst (blue). Scale bar = 10 µm. Quantification of p62 fluorescence intensity using photoshop histogram function ± SD (**p < 0.01).
Fig. 5
Fig. 5. Identification of detour interacting proteins.
a Quantitative analysis of detour proteins interacting. Volcano plots showing the estimated log2 fold changes versus the -log10 p-values for each protein identified as interacting with detour:GFP compared to GFP or detour:GFP input (before immunoprecipitation). Proteins that are highly (4-fold change) and moderately enriched (2-fold change) are shown in red and blue respectively. p-values determined using Mann–Whitney U-test and Benjamini–Hochberg correction. b Functional enrichment analysis of candidate detour-interacting proteins. Gene Ontology (GO) analysis of biological processes and cellular components associated with detour:GFP-interacting proteins (n = 157). Pathway enrichment analysis (Kyoto Encyclopaedia of Genes and Genomes, KEGG) of detour:GFP-interacting proteins (n = 157). Vertical dotted line indicates significance cut-off (-log10 of the Benjamini–Hochberg corrected p-value of 0.05), p-values Fisher’s exact test. c Identification of Vps16A, lt/VPS41 and dor/VPS18 from detour:GFP IP-MS. Schematic representation of HOPS complex.
Fig. 6
Fig. 6. detour interacts with the Drosophila HOPS complex.
a SL2 cells were co-transfected with GFP-tagged detour and Flag-tagged dor, Myc-tagged Vps16A and HA-tagged lt as indicated and subjected to immunoprecipitation (IP) with anti-GFP antibody. Proteins were separated by SDS-PAGE and immunoblotted (IB) with anti-GFP antibody and anti-Flag, anti-Myc or anti-HA antibody. Input controls were 5% of each protein lysate. b In the presence of detour there is increased ubiquitination of dor, Vps16A and lt in SL2 cells co-transfected with detour, HA-tagged Ub and Flag-tagged dor or Flag-tagged Vps16A or Flag-tagged lt as indicated. IPs were carried out using anti-Flag and IB with anti-Flag, anti-HA and anti-V5 antibody. c Lysates from SL2 cells co-transfected with V5-tagged detour (detour:V5) or V5-tagged detour RING deletion (detourΔ:V5) and Flag-tagged dor or Flag-tagged Vps16A were subjected to immunoprecipitation (IP) with anti-V5 antibody. Proteins were separated by SDS-PAGE and immunoblotted (IB) with anti-Flag and anti-V5 antibody. Input controls were 5% of each protein lysate. d Atg8a and Rab7 staining shows increased Atg8a puncta and enlarged Rab7 positive vesicles in detour mutants. Overexpression of detour, ZNRF1 or ZNRF2 have enlarged Atg8a puncta surrounded by Rab7. The Rab7 in detour:GFP was detected with 647 and is coloured green. Scale bar = 20 μm.
Fig. 7
Fig. 7. detour genetically interacts with light.
a Clone cells knockdown for lt (hsFLP; pmCherry-Atg8a/UAS-ltRi#1; Act > CD2 > GAL4, UAS-nlsGFP/+) in the midgut marked by GFP (green) has decreased mCherry:Atg8a puncta size (red, clone outlined) and increased cell size compared to the neighbouring control cells at -4 h RPF. DNA is stained by Hoechst (blue). Scale bar = 10 μm. Quantification of mCherry:Atg8a puncta size represented as average puncta size/cell ± SD. Quantitation of cell size represented as area ± SD (****p < 0.0001). b Clone cells knockdown for dor (hsFLP; pmCherry-Atg8a/+; Act > CD2 > GAL4, UAS-nlsGFP/UAS-dorRi) in the midgut marked by GFP (green) has decreased mCherry:Atg8a puncta size (red, clone outlined) and increased cell size compared to the neighbouring control cells at -4 h RPF. DNA is stained by Hoechst (blue). Scale bar = 10 μm. Quantification of mCherry:Atg8a puncta size represented as average puncta size/cell ± SD. Quantitation of cell size represented as area ± SD. (***p < 0.001, ****p < 0.0001). c The Atg8a immunostaining (red) of midguts at −4 h RPF from knockdown of lt (Mex-GAL4/UAS-ltRi#1, strong knockdown line) and dor (Mex-GAL4/ + ; UAS-dorRi/+) compared to controls (Mex-GAL4/ + ). DNA is stained with Hoechst (blue). Scale bar = 20 μm. d The phosphorylated Akt (pAkt) immunostaining (green) of midguts at +2 h RPF shows cortical localisation (arrow) in lt (Mex-GAL4/UAS-ltRi#1; pmCherry-Atg8a/+) and dor knockdown (Mex-GAL4/+; pmCherry-Atg8a/UAS-dorRi) which is reduced in the control (Mex-GAL4/+; pmCherry-Atg8a/+). DNA is stained by Hoechst (blue). Scale bar = 20 μm. e Morphology of control (w1118), detour1, the weak ltRi#2 knockdown (Mex-GAL4/ + ; UAS-ltRi#2/+, weak knockdown line) and combined detour1 ltRi#2 knockdown midguts at 0 h RPF. The smaller gastric caeca (arrow) in detour1 are rescued by knockdown of lt. Scale bar = 200 µm. Quantitation of gastric caeca size at 0 h RPF represented as area ± SD (**p < 0.01). f The Atg8a immunostaining (red) of midguts at -4 h RPF shows increased Atg8a puncta in detour1 and detour1 ltRi#2 with similar levels of Atg8a puncta compared to the control (w1118). DNA is stained by Hoechst (blue). Scale bar = 20 μm. Quantitation of Atg8a positive puncta represented as puncta/cell ± SD (*p < 0.05, **p < 0.01, ***p < 0.001). g The pAkt immunostaining (green) of midguts at −4 h RPF shows reduced cortical localisation (arrow) in detour1 compared to the combined detour1 with ltRi#2 knockdown. DNA is stained by Hoechst (blue). Scale bar = 20 μm.
Fig. 8
Fig. 8. detour, ZNRF1 and ZNRF2 genetically interact with HOPS subunits.
a The knockdown of ltRi#1 (GMR-GAL4, UAS-ltRi#1/+), dorRi (GMR-GAL4+, UAS-dorRi/+) and Vps16ARi (GMR-GAL4, UAS-Vsp16ARi/+) in the developing eye results in a pale eye colour phenotype, with loss of pigmentation and reduced size compared to controls (GMR-GAL4/+). The pale eye phenotype is supressed by detour1 and Atg1 knockdown observed by increased red eye pigmentation and eye size. The expression of ZNRF1 and ZNRF2 enhances the ltRi#1, dorRi and Vps16ARi eye phenotype. Note that GMR-GAL4 alone results in a rough eye phenotype at 29oC. Scale bar = 100 μm. Quantitation of eye phenotype represented as eye area ± SD. b Immunostaining of HeLa cells transfected with ZNRF1:V5 and ZNRF2:V5 with VPS18 antibody (green), V5 (red), merged with nuclei stained by Hoechst (blue). Scale bar = 10 µm. c Total protein lysates from HeLa cells were subjected to immunoprecipitation (IP) with anti-ZNRF2, anti-VPS18 or Control IgG antibody. Proteins were separated by SDS-PAGE and immunoblotted with anti-ZNRF2 antibody or anti-VPS18 antibody. Input controls were 5% of each protein lysate. d Decreased ubiquitination of VPS18 in ZNRF2 KO HeLa cells. Total protein lysate from Control, ZNRF1 KO and ZNRF2 KO were subjected to IP with anti-VSP18 or IgG control antibody and immunoblotted with anti-ubiquitin, anti-VPS18 and anti-ZNRF2 antibodies. Numbers represent the quantitation of Ub relative to VPS18 normalised to Control for the representative IB shown. # IgG heavy chain. Quantitation of VPS18 ubiquitination relative to control ±SEM (*p < 0.05). e Immunostaining of control, ZNRF1 and ZNRF2 KO HeLa cells with VPS18 antibody (top panel) and GABARAP (bottom panel) (green) merged with nuclei stained by Hoechst (blue). Scale bar = 10 µm. Dashed outline region is represented in the enlarged inset.
Fig. 9
Fig. 9. detour regulates autophagy and is required for healthy aging.
a Immunoblot analysis of whole protein lysates from controls (w1118 and detourrev), detour1 and detourMiET young (Day 1) and old (Day 21) adults shows endogenous levels of ref(2)P and Atg8a. Actin (Act5C) as load control. b Quantitation of immunoblots demonstrating a significant increase in ref(2)P protein levels in young (Day 1) detour1 and detourMiET adults. Data presented as mean relative intensity ± SD (n = 3 individual repeat experiments; *p < 0.05, **p < 0.01). c Adult brain section of a young (0-3d old male) control, detour1 and detourMiET showing endogenous ref(2)P and Atg8a puncta. Scale bar = 20 µm. d The transcript levels of selected AMP genes Diptericin A (DptA), Drosocin (Dro) and Attacin-A (AttA) from control (w1118) and detour mutant young (0-3 day, Day1) and old (Day 21) adults measured by qRT-PCR from total RNA with rp49 as the reference gene. Data are from three/four independent experiments, each containing 3/5 adults per group (mean ± SEM, *p < 0.05). e Survival assays for female control (w1118/Df and detourrev/Df), and detour1/Df and detourMiET/Df adults. Kaplan-Meier survival assay presented as percentage of surviving population per time point (Log-rank p < 0.0001; Gehan-Breslow-Wilcoxon p < 0.0001). f The percent of male flies unable to climb above 25 mm (climb defect) in a cylinder after 25 s was determined every week. Data presented as mean ± SD, n ≥ 45 flies per experiment (*p < 0.05; **p < 0.01; ****p < 0.0001).

Similar articles

Cited by

References

    1. Galluzzi L, et al. Molecular definitions of autophagy and related processes. EMBO J. 2017;36:1811–1836. doi: 10.15252/embj.201796697. - DOI - PMC - PubMed
    1. Dikic I, Elazar Z. Mechanism and medical implications of mammalian autophagy. Nat. Rev. Mol. Cell Biol. 2018;19:349. doi: 10.1038/s41580-018-0003-4. - DOI - PubMed
    1. Levine B, Kroemer G. Biological functions of autophagy genes: a disease perspective. Cell. 2019;176:11–42. doi: 10.1016/j.cell.2018.09.048. - DOI - PMC - PubMed
    1. Aman Y, et al. Autophagy in healthy aging and disease. Nat Aging. 2021;1:634–650. doi: 10.1038/s43587-021-00098-4. - DOI - PMC - PubMed
    1. Klionsky DJ, et al. Autophagy in major human diseases. EMBO J. 2021;40:e108863. doi: 10.15252/embj.2021108863. - DOI - PMC - PubMed

Publication types

Substances