. 2024 Feb 15;15(1):1405.
doi: 10.1038/s41467-024-45750-w.

Cell softness renders cytotoxic T lymphocytes and T leukemic cells resistant to perforin-mediated killing

Affiliations

Cell softness renders cytotoxic T lymphocytes and T leukemic cells resistant to perforin-mediated killing

Yabo Zhou et al. Nat Commun. .

Abstract

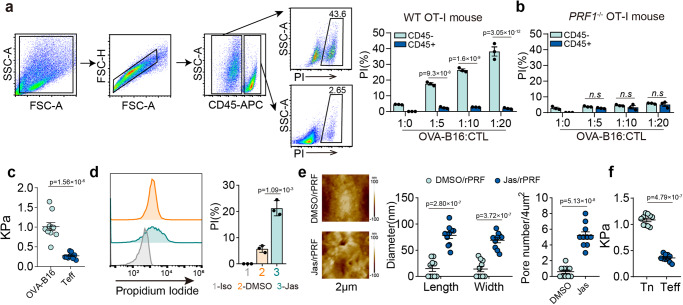
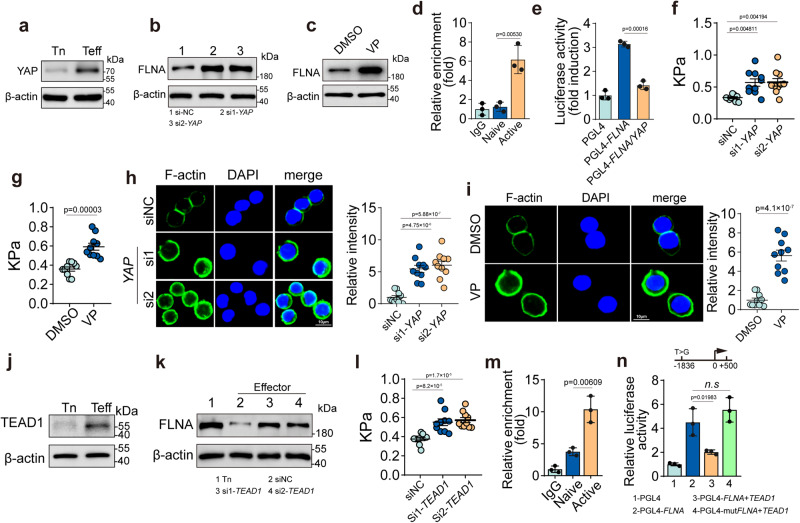
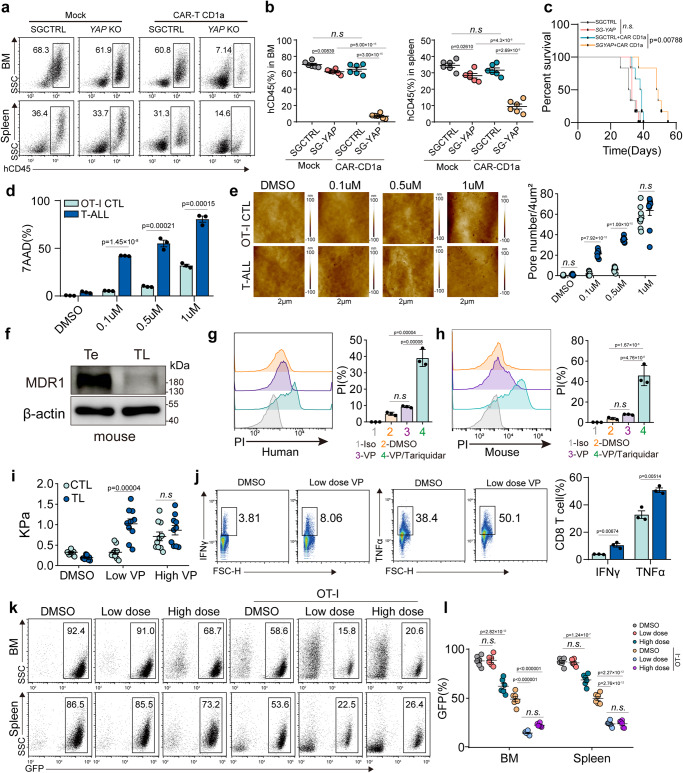
Mechanical force contributes to perforin pore formation at immune synapses, thus facilitating the cytotoxic T lymphocytes (CTL)-mediated killing of tumor cells in a unidirectional fashion. How such mechanical cues affect CTL evasion of perforin-mediated autolysis remains unclear. Here we show that activated CTLs use their softness to evade perforin-mediated autolysis, which, however, is shared by T leukemic cells to evade CTL killing. Downregulation of filamin A is identified to induce softness via ZAP70-mediated YAP Y357 phosphorylation and activation. Despite the requirements of YAP in both cell types for softness induction, CTLs are more resistant to YAP inhibitors than malignant T cells, potentially due to the higher expression of the drug-resistant transporter, MDR1, in CTLs. As a result, moderate inhibition of YAP stiffens malignant T cells but spares CTLs, thus allowing CTLs to cytolyze malignant cells without autolysis. Our findings thus hint a mechanical force-based immunotherapeutic strategy against T cell leukemia.


Conflict of interest statement

The authors declare no competing interests.

Figures

Fig. 1
Fig. 1. Mechanical softness mediates the resistance of CD8+ effector T cells to perforin.
CD45 OVA-B16 cells were co-cultured with CD45+ OT-I CTLs (a) or PRF1-/- OT1-CTLs (b) at different ratios for 4 h. PI+ cells were analyzed by flow cytometry. c The stiffness of OVA-B16 or mouse CD8+ effector T (Teff) cells was determined by AFM. Each data point is the average of at least 20 force curve measurements of a single cell. d, e Human CD8+ effector T cells were pretreated with 200 nM Jas for 12 h. and then treated with Perforin for 10 min. The PI+ cells were analyzed by flow cytometry (d); Cells were fixed following 5 min treatment with 50 ng/ml Perforin and imaged by AFM. The pores image was measured from 3 randomly selected areas on a single cell. The average size and number of pores formed were calculated within a cellular area of 2 × 2 μm (e). f The stiffness of mouse CD8+ naïve (Tn) and Teff cells was determined by AFM. PI Propidium lodide, AFM atomic force microscopy. n = 3 independent experiments (a, b and d); n = 10 independent experiments (c, e and f). The data are represented as mean ± SD. p value by One-way ANOVA Bonferroni’s test (a, b, d and e); p value by two-tailed Student’s t-test (c, e and f). Source data are provided as a Source Data file.
Fig. 2
Fig. 2. Downregulation of filamin A is identified to induce CTL softness.
a Schematic design of CRISPRa library screening in this study (Figure was created with BioRender.com). b Genes significantly enriched after Perforin treatment were identified through analysis of sequencing results in the MAGeCK program. c Significant hits from screens in cells treated with Perforin. Line indicates Bonferroni-corrected significance threshold. d PPI network based on the perforin sensitive associated hub genes of CRISPR screening. e The expression of FLNA in human CD8+ Tn and Teff cells were analyzed by real-time PCR. f The expression of FLNA in human (up) and mouse (bottom) CD8+ Tn and Teff cells were analyzed by western blot. g Human CD8+ Tn and Teff cells were stained with DAPI (blue), phalloidin (F-actin, green); Scale bar, 10 μm. h Human CD8+ Teff with or without FLNA overexpression by CRISPRa were treated with Perforin for 10 min and imaged by AFM. The formed pore size and number were calculated. i The same as (h), except that cells were human Tn cells with or without FLNA siRNA. j The stiffness of human CD8+ Teff with or without FLNA overexpression was determined by AFM. k The same as (j), except that cells were human Tn cells with or without FLNA siRNA. l Immunostaining of F-actin in human CD8+ Teff with or without FLNA overexpression. Scale bar, 10 μm. m Immunostaining of F-actin in human CD8+ Tn with or without FLNA siRNA. Scale bar, 10 μm. FLNA, Filamin A. n = 3 independent experiments (e and f); n = 10 independent experiments (gk). The data are represented as mean ± SD. p value by One-way ANOVA Bonferroni’s test (hk); p value by two-tailed Student’s t-test (e, g). Source data are provided as a Source Data file.
Fig. 3
Fig. 3. YAP mediates FLNA downregulation in activated CTLs.
a The expression of YAP in human CD8+ Tn and Teff cells were analyzed by western blot. b Human CD8+ Teff cells were transfected with or without YAP siRNA, and FLNA expression was determined by western blot. c Human CD8+ Teff cells were treated with DMSO or verteporfin (VP) (1 μM) for 24 h, and FLNA expression was determined by western blot. d ChIP–qPCR analysis of YAP enrichment around the promoters of FLNA in human CD8+ Tn and Teff cells. e 293 T cells were co-transfected with FLNA promoter-luciferase reporter PGL4 and YAP plasmid for 24 h, followed by analysis of luciferase activity. f The stiffness of human CD8+ Teff cells transfected with or without YAP siRNA was determined by AFM. g The stiffness of human CD8+ Teff cells treated with DMSO or verteporfin (1 μM) for 24 h was determined by AFM. h Human CD8+ Teff cells transfected with or without YAP siRNA were stained with DAPI (blue), phalloidin (F-actin, green); Scale bar, 10 μm. i Human CD8+ Teff cells treated with DMSO or verteporfin (1 μM) for 24 h were stained with DAPI (blue), phalloidin (F-actin, green); Scale bar, 10 μm. j The expression of TEAD1 in human CD8+ Tn and Teff cells were analyzed by western blot. k The expression of FLNA in human CD8+ Tn cells or Teff cells transfected with or without TEAD1 siRNA was determined by western blot. l The stiffness of human CD8+ Teff cells transfected with or without TEAD1 siRNA was determined by AFM. m ChIP–qPCR analysis of TEAD1 enrichment around the promoters of FLNA in human CD8+ Tn and Teff cells. n 293 T cells were co-transfected with WT or mutant FLNA promoter-luciferase reporter PGL4 and TEAD1 plasmid for 24 h, followed by analysis of luciferase activity. n = 3 independent experiments (ae, j, k, m and n); n = 10 independent experiments (fi and l). The data are represented as mean ± SD. p value by One-way ANOVA Bonferroni’s test (df, h and ln); p value by two-tailed Student’s t-test (g and i). Source data are provided as a Source Data file.
Fig. 4
Fig. 4. FLNA downregulation via YAP induces the softness of T-leukemic cells.
a Heatmap of top 200 lowly expressed genes in T-ALL samples (n = 117) in comparison to 7 normal bone marrow samples (BM). b Distributions of FLNA mRNA expression derived from the heatmap. c The expression of FLNA in BM cells, naïve (Tn) and effector CD8+ T cells (Teff) and T leukemic cells (TL) were analyzed by western blot. d The expression of FLNA in BM, thymus, naïve and effector CD8+ T cells and T-leukemic cells from C57BL/6 mouse were analyzed by western blot. e The stiffness of human (left) or mouse (right) CD8+ Tn, Teff and TL was determined by AFM. f The stiffness of human primary T leukemic cells transfected with or without YAP sgRNA was determined by AFM. g The stiffness of human primary T leukemic cells treated with DMSO or verteporfin (1 μM) for 24 h was determined by AFM. h, i The stiffness of SGCTRL, YAP-SG, YAP-SG/NLS-YAP, YAP-SG/NES-YAP or YAP-SG/WT-YAP T leukemic cells was analyzed by AFM (h). cells were stained with DAPI (blue), phalloidin (F-actin, green) and FLNA (red). Scale bar, 10 μm (i). T-ALL, T cell acute lymphoblastic leukemia. n = 3 biologically independent samples (c); n = 3 independent experiments (d); n = 10 independent experiments (ei). The data are represented as mean ± SD. p value by One-way ANOVA Bonferroni’s test (e, f, h and i); p value by two-tailed Student’s t-test (g). Source data are provided as a Source Data file.
Fig. 5
Fig. 5. Activation of TCR signaling phosphorylates YAP result in the softness of T-leukemic cells.
a The expression of cytosolic and nuclear YAP, S127-YAP and Y357-YAP in human CD8+ Teff and T-leukemic cells was analyzed using western blot. b The expression of ZAP70, p- ZAP70, LCK and p-LCK in human CD8+ Tn and Teff cells and TL cells was analyzed by western blot. c Immunoblot of immunoprecipitations of YAP from HEK293T cells transfected with the indicated combinations of ZAP70, LCK, and YAP expression vectors. the expression of ZAP70, LCK, and YAP were analyzed by western blot. d Purified recombinant human YAP1 was incubated with active ZAP70 for in vitro kinase assay. Phosphorylated proteins generated from the in vitro kinase reactions to treatment with or without Lambda Protein Phosphatase. Phosphorylated and total YAP1 and ZAP70 were determined by western blot. e The expression of FLNA, YAP and Y357-YAP in human primary T leukemia treated with an inhibitor of ZAP70 or LCK were analyzed by western blot. f The stiffness of mouse CD8+ Teff cells treated with an inhibitor of ZAP70 or LCK was determined by AFM. gi The expression of FLNA, YAP and Y357-YAP of human primary T leukemia cells transfected by ZAP70 or LCK siRNA were analyzed by western blot (g). The stiffness of cells transfected by ZAP70 (h) or LCK (i) siRNA was determined by AFM. j, k The expression of FLNA in Vector, YAP-SG, YAP-SG/WT-YAP and YAP-SG/YAP-Y357A human primary T leukemia cells was analyzed western blot (g), and the stiffness of cells was determined by AFM (k). n = 3 independent experiments (a, c, d, e, g and j); n = 10 independent experiments (f, h, i and k). The data are represented as mean ± SD. p value by One-way ANOVA Bonferroni’s test (f, h, i and k). Source data are provided as a Source Data file.
Fig. 6
Fig. 6. T-leukemic cells usurp the softness to evade CTL killing in vivo.
a Schematic of the mouse model is shown, NSG mice were transplanted with 2 × 105 OVA-expressing ICN1 leukemic cells. At 7 days post engraftment, NSG mice were treated or untreated with Jas (50 μg/kg), followed by adoptively transferring with or without 5 × 106 OT-I T cells. At 10 days post engraftment, PI+ cells in the ICN1 cells were analyzed by flow cytometry. At 15 days post engraftment, ICN1 leukemic cells dissemination were determined by flow cytometry (Figure was created with BioRender.com). b PI+ cells from spleen and bone marrow were analyzed by flow cytometry. Data from six individual mice were plotted and shown on the right. c The stiffness of ICN treated with Jas in vivo was determined by AFM; n = 10 independent experiments. d Kaplan–Meier survival curves of OVA-expressing ICN1 leukemic cells in each group as indicated. ICN1 GFP+ cells from spleen and bone marrow were analyzed by flow cytometry (e); Data from six individual mice were plotted and shown on the right (f). ICN1, intracellular Notch 1. The data are represented as mean ± SD. p value by One-way ANOVA Bonferroni’s test (b and f); p value by two-tailed Student’s t-test (c); P value by Log-rank survival analysis (d). Source data are provided as a Source Data file.
Fig. 7
Fig. 7. FLNA improves CAR-T cell therapy efficacy in vivo.
a Schematic of the mouse model is shown, NSG mice were transplanted with 2 × 106 FLNA-overexpressing and vector control Molt4-luc cells. At 7 days post engraftment, NSG mice were adoptively transferred with 1 × 106 human CD1a-CAR or Mock T cells, then at 30 days post engraftment, 6 mice were taken out in each group and killed for assessment of leukemia burden (Figure was created with BioRender.com). b In vivo tumor bioluminescence imaging (BLI) of NSG mice treated with human CD1a-CAR or Mock T cells. c Leukemia burden was measured by quantification of BLI; n = 5 independent animals. df the same as (b) Human CD45+ leukemia cells (CAR-T cells were excluded by gating strategy) from spleen and bone marrow were analyzed by flow cytometry (d); Data from six individual mice were plotted and shown (e). The data are represented as mean ± SD. p value by One-way ANOVA Bonferroni’s test (c and e); p value by Log-rank survival analysis (f). Source data are provided as a Source Data file.
Fig. 8
Fig. 8. Moderate YAP inhibition improves CTL killing of T-leukemic cells but avoids autolysis.
a, b NSG mice were transplanted with 3 × 106 YAP knockout and vector control Molt4-luc cells. At 7 days post engraftment, NSG mice were adoptively transferred with 1 × 106 human CD1a-CAR-T cells. then at 30 days post engraftment, leukemia burden (spleen and bone marrow) was analyzed by flow cytometry (a); Data from six individual mice were plotted and shown (b). c the same as (a, b), the survival was analyzed. d, e OVA-expressing ICN1 leukemic cells were co-cultured with OT-I T cells treated with VP (0.1 uM, 0.5 uM, 1 uM) for 12 h. 7-AAD+ cells were analyzed by flow cytometry (d) or AFM (e). The formed pore size and number were calculated (e). f The expression of MDR1 in mouse CD8+ Teff cells and TL cells were analyzed by western blot. Human (g) and mouse (h) CD8+ T cells were pretreated with 0.1 uM VP combined with or without 1 nM Tariquidar for 12 h then treated with Perforin for 10 min. The PI+ cells were analyzed by flow cytometry. i The stiffness of ICN1 cells and CTLs treated with VP (0.1 uM, 1 uM) 12 h was determined by AFM. j Activated CD8 + T cells were stimulated with PMA and treated with 0.1 μM VP for 24 h. Flow cytometric analysis was performed to evaluate the expression of IFN-γ and TNFα. k, l NSG mice were transplanted with 2 × 105 OVA-expressing ICN1 leukemic cells. At 7 days post engraftment, NSG mice were adoptively transferred with or without 5 × 106 OT-I T cells, followed by with DMSO or VP (20 mg/kg as low dose or 200 mg/kg as high dose), into each allocated group every two days for 8 days. At 20 days post engraftment, leukemia cell dissemination was determined by flow cytometry (k), Data from six individual mice were plotted and shown (l). 7-AAD, 7-Aminoactinomycin D; PMA, Phorbol 12-myristate 13-acetate. n = 3 independent experiments (d, f, h and j); n = 10 independent experiments (e and i)·. The data are represented as mean ± SD. p value by One-way ANOVA Bonferroni’s test (b, d, e, gj and l); p value by Log-rank survival analysis (c). Source data are provided as a Source Data file.
Fig. 9
Fig. 9. Softness promotes T-leukemic cell immune evasion in patients.
a The expression of FLNA, YAP and Y357-YAP in human normal T cells or primary T leukemia cells were analyzed by western blot. b The correlation between the expression of Y357-YAP and FLNA was showed. c The correlation between the expression of FLNA and cell stiffness was showed. d The correlation between the expression of Y357-YAP and cell stiffness was showed. e The cell viability of the primary T leukemia cells, primary B-leukemic and primary acute myeloid leukemic cells was detected by flow cytometry after coculturing with allogeneic donor-derived T cells for 12 h. f The cell viability of SGCTRL or FLNA-SGs T-leukemic cells was detected by flow cytometry after coculturing with allogeneic donor-derived T cells for 12 h. g The cell viability of SGCTRL, YAP KO, YAP KO/YAP WT and YAP KO/YAP MUT of T-leukemic cells was detected by flow cytometry after coculturing with allogeneic donor-derived T cells for 12 h. h The cell viability of T-leukemic cells treated with 200 nM Jas or DMSO was detected by flow cytometry after coculturing with allogeneic donor-derived T cells for 12 h. i The cell viability of T-leukemic cells treated 0.1 μM VP or DMSO was detected by flow cytometry after coculturing with allogeneic donor-derived T cells for 12 h. j Schematic of the experiment to test whether Jas or VP inhibits leukemia development in NSG mice. NSG mice were irradiated (2 Gy), then adoptively transferred with 1 × 106 primary leukemic T cells labeled with PKH26 and 1 × 106 allogeneic T cells. At 1 day post engraftment, NSG mice were treated with Jas (50 μg/kg) or VP (20 mg/kg). At 3 days post engraftment, PKH26+ cells were analyzed by flow cytometry (Figure was created with BioRender.com). k, l Representative flow plots and quantification of percent of PKH26+ primary T leukemia cells in bone marrow from mice treated with Jas (k) or VP (l). n = 10 biologically independent samples (a); n = 6 independent samples (ei); n = 9 independent samples (k and l). The data are represented as mean ± SD. p value by One-way ANOVA Bonferroni’s test (eg and kl); p value by two-tailed Student’s t-test (h and i). Source data are provided as a Source Data file.

Similar articles

Cited by

References

    1. de la Roche M, Asano Y, Griffiths GM. Origins of the cytolytic synapse. Nat. Rev. Immunol. 2016;16:421–432. doi: 10.1038/nri.2016.54. - DOI - PubMed
    1. Golstein P, Griffiths GM. An early history of T cell-mediated cytotoxicity. Nat. Rev. Immunol. 2018;18:527–535. doi: 10.1038/s41577-018-0009-3. - DOI - PubMed
    1. Voskoboinik I, Whisstock JC, Trapani JA. Perforin and granzymes: function, dysfunction and human pathology. Nat. Rev. Immunol. 2015;15:388–400. doi: 10.1038/nri3839. - DOI - PubMed
    1. Lopez JA, et al. Perforin forms transient pores on the target cell plasma membrane to facilitate rapid access of granzymes during killer cell attack. Blood. 2013;121:2659–2668. doi: 10.1182/blood-2012-07-446146. - DOI - PubMed
    1. Ritter AT, et al. ESCRT-mediated membrane repair protects tumor-derived cells against T cell attack. Science. 2022;376:377–382. doi: 10.1126/science.abl3855. - DOI - PubMed

MeSH terms

LinkOut - more resources