. 2024 Feb 15;15(1):1391.
doi: 10.1038/s41467-024-45724-y.

Adipocyte p53 coordinates the response to intermittent fasting by regulating adipose tissue immune cell landscape

Affiliations

Adipocyte p53 coordinates the response to intermittent fasting by regulating adipose tissue immune cell landscape

Isabel Reinisch et al. Nat Commun. .

Abstract

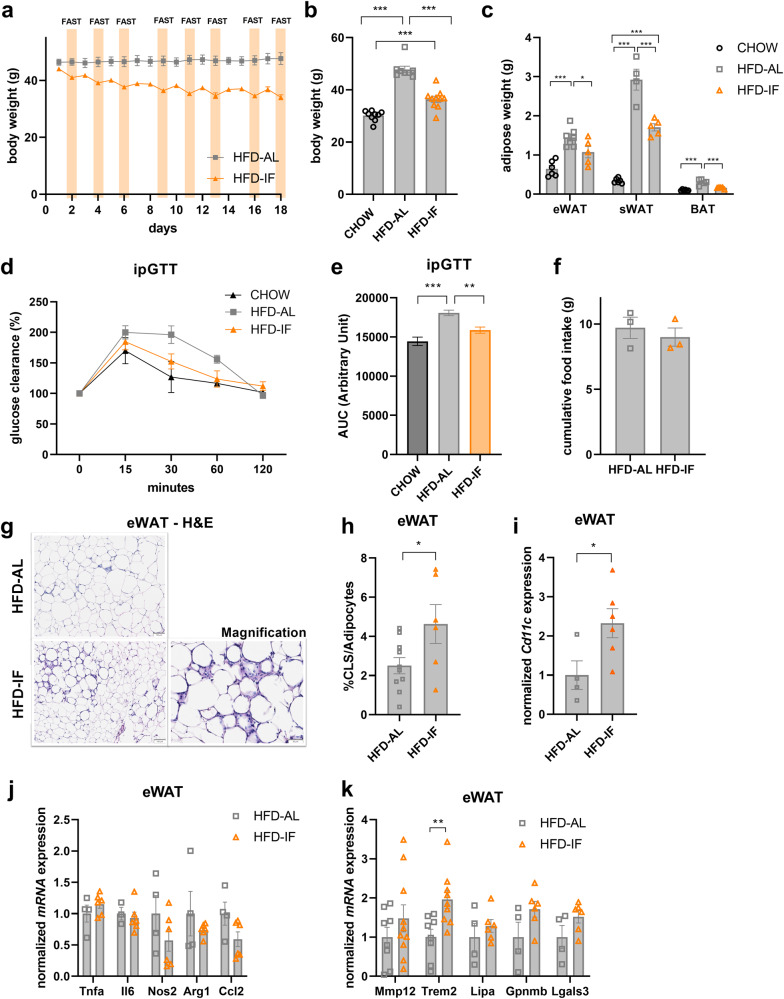
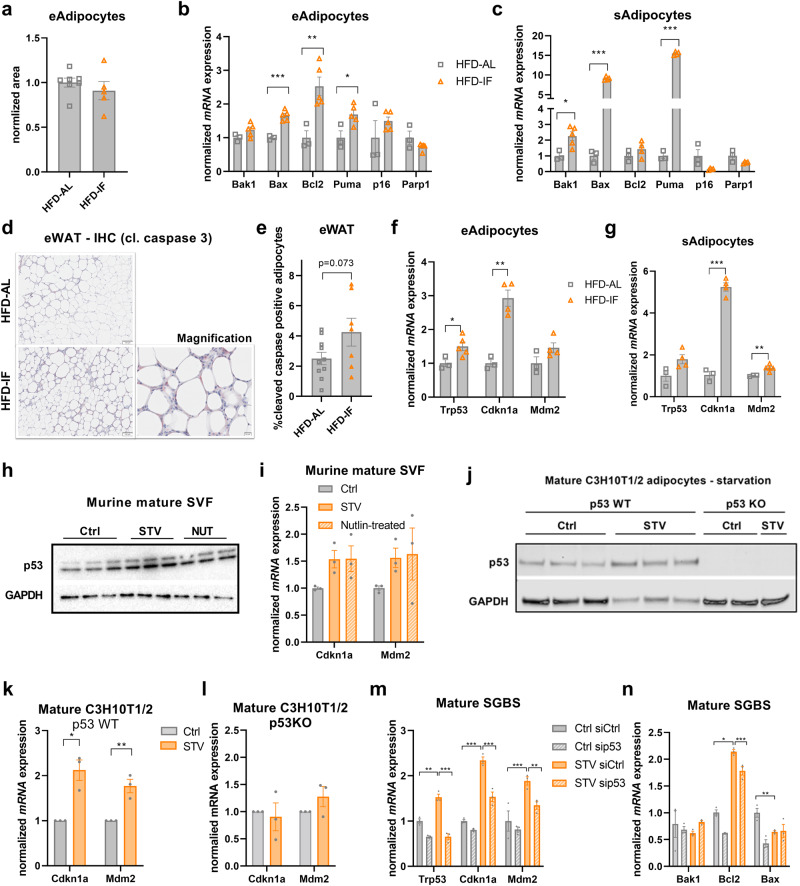
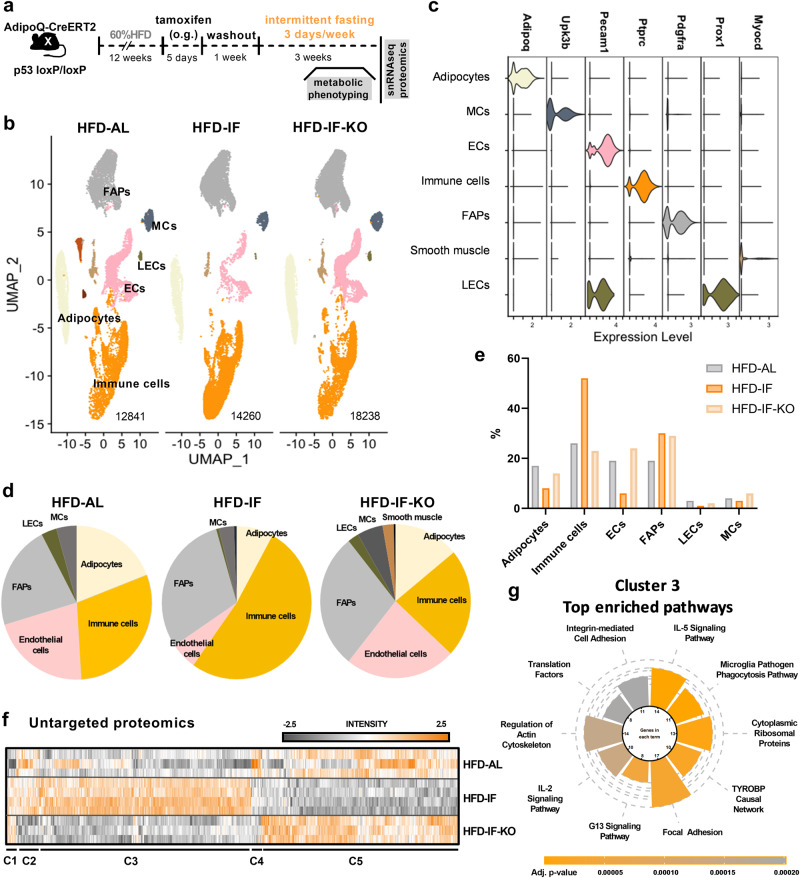
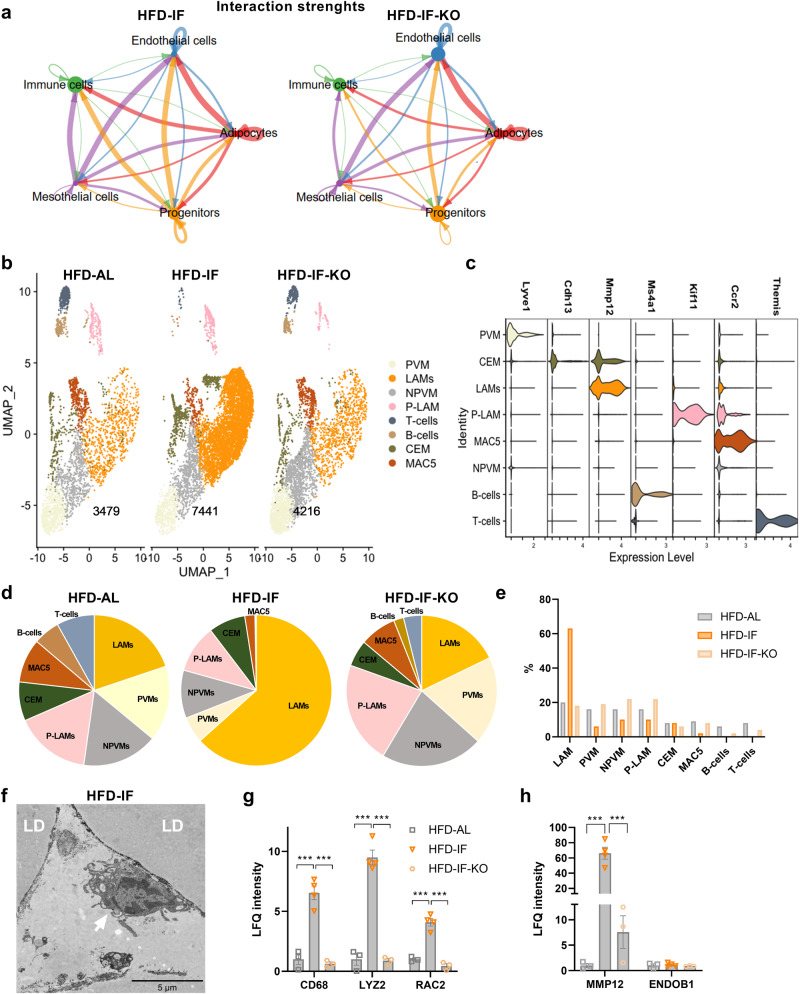
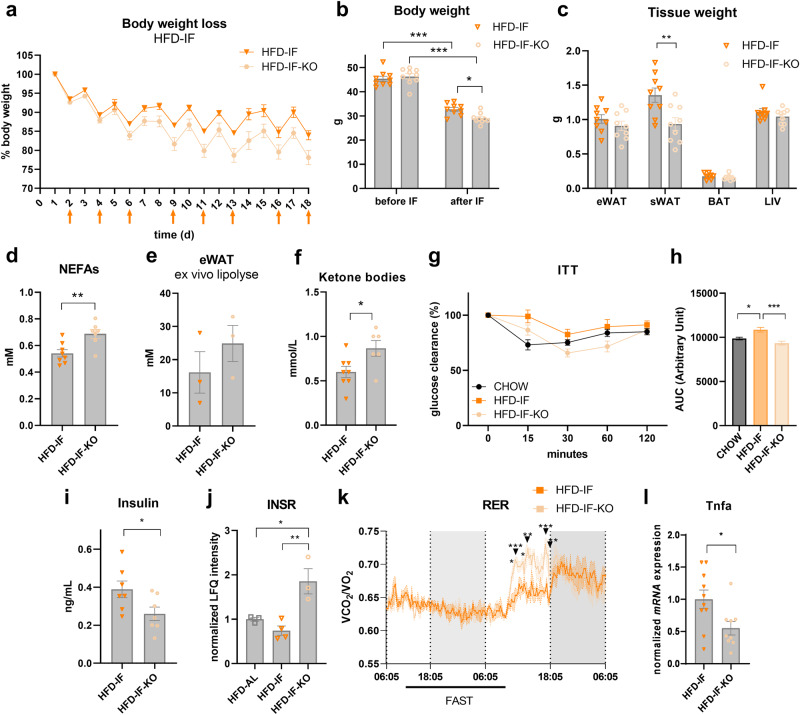
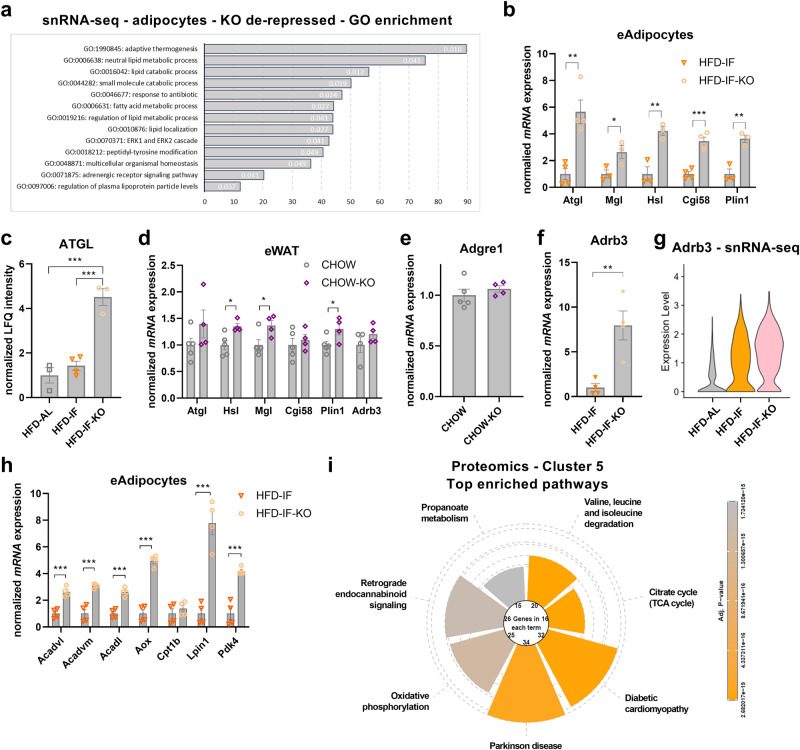
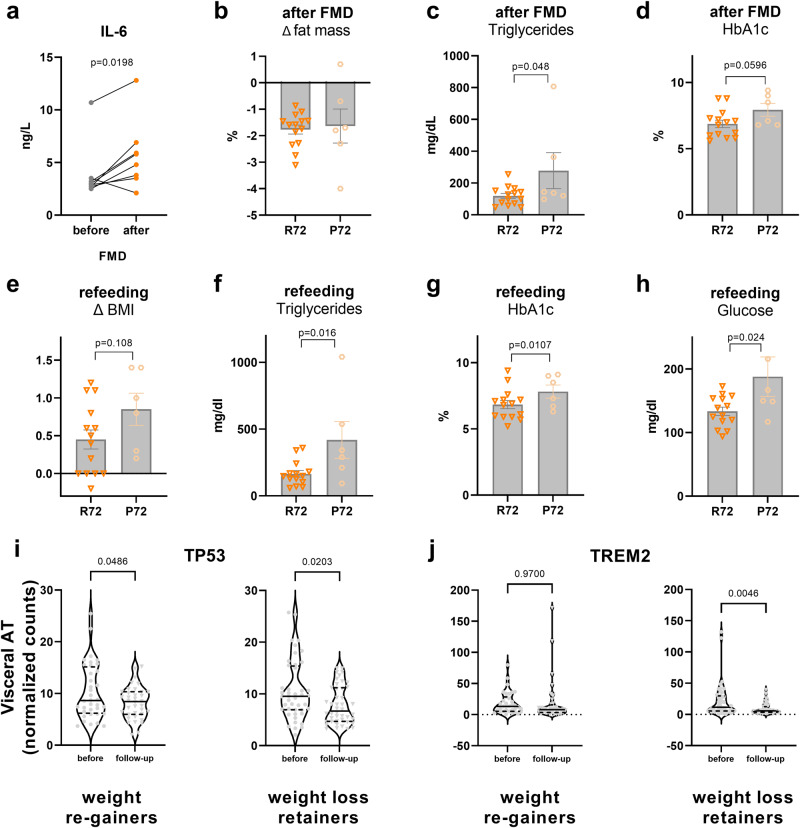
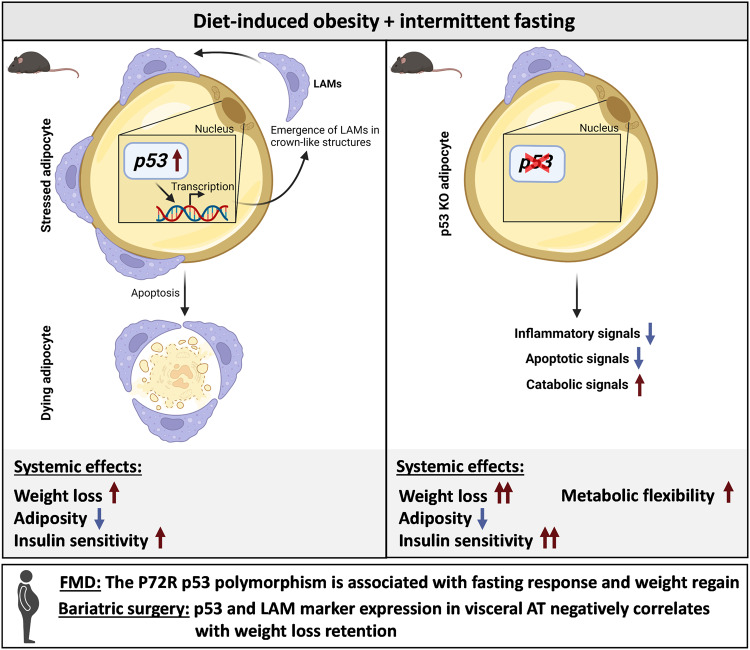
In obesity, sustained adipose tissue (AT) inflammation constitutes a cellular memory that limits the effectiveness of weight loss interventions. Yet, the impact of fasting regimens on the regulation of AT immune infiltration is still elusive. Here we show that intermittent fasting (IF) exacerbates the lipid-associated macrophage (LAM) inflammatory phenotype of visceral AT in obese mice. Importantly, this increase in LAM abundance is strongly p53 dependent and partly mediated by p53-driven adipocyte apoptosis. Adipocyte-specific deletion of p53 prevents LAM accumulation during IF, increases the catabolic state of adipocytes, and enhances systemic metabolic flexibility and insulin sensitivity. Finally, in cohorts of obese/diabetic patients, we describe a p53 polymorphism that links to efficacy of a fasting-mimicking diet and that the expression of p53 and TREM2 in AT negatively correlates with maintaining weight loss after bariatric surgery. Overall, our results demonstrate that p53 signalling in adipocytes dictates LAM accumulation in AT under IF and modulates fasting effectiveness in mice and humans.


Conflict of interest statement

The authors declare no competing interests.

Figures

Fig. 1
Fig. 1. Intermittent fasting increases the abundance of crown-like structures in adipose tissue (AT).
a Body weight of diet-induced obese mice of ad libitum controls (HFD-AL, n = 3 mice) and during the intermittent fasting intervention (HFD-IF, n = 4 mice; orange bars indicate 24 h water-only fasting). b Body weight of chow-fed lean (CHOW, n = 9 mice), HFD-AL (n = 8 mice), and HFD-IF (n = 10 mice) groups at the end of the experiment. c Adipose depot weights in grams of CHOW (n = 6 mice), HFD-AL (n = 4–7 mice), and HFD-IF (n = 5 mice) groups. eWAT epididymal white AT, sWAT subcutaneous white AT, BAT brown AT. d, e Intraperitoneal glucose tolerance test (ipGTT) of lean CHOW (n = 7 mice), HFD-AL (n = 6 mice), and HFD-IF (n = 13 mice) groups. Basal glucose levels are normalised and glucose clearance is shown in percent 15, 30, 60, and 120 min after glucose injection. f Cumulative food intake in grams of HFD-AL and HFD-IF mice (n = 3 mice per group), as analysed in metabolic cages. g Representative H&E stainings of eWAT of HFD-AL and HFD-IF mice. Scale bars are 100 µm or 50 µm for the magnification. h Number of crown-like structures normalised to number of adipocytes in eWAT of HFD-AL (n = 10 mice) and HFD-IF (n = 6 mice) groups. i, j, k mRNA expression of Cd11c (i), of genes encoding for M1/M2 macrophage markers (j), and of lipid-associated macrophage markers (k) in eWAT of HFD-AL (n = 4–8 mice) and HFD-IF (n = 6–10 mice) mice. Data are presented as mean values ± SEM. Significant differences were analysed by two-tailed, unpaired t-test (f, hk) or two-way (a, d) or one-way (b, c, e) ANOVA with Bonferroni post hoc tests. ***p < 0.001, **p < 0.01, and *p < 0.05. Exact p values: b CHOW vs. HFD-AL: <0.0001, HFD-AL vs. HFD-IF: <0.0001, CHOW vs. HFD-IF: 0.0007; c CHOW vs. HFD-AL: 0.0001, <0.0001, <0.0001, HFD-AL vs. HFD-IF: 0.0419, 0.0001, 0.0004, CHOW vs. HFD-IF: ns, <0.0001, ns (eWAT, sWAT, BAT respectively); e CHOW vs. HFD-AL: <0.0001, HFD-AL vs. HFD-IF: 0.0044; h 0.0371; i 0.0413; k Trem2: 0.0071. Source data are provided as a Source Data file.
Fig. 2
Fig. 2. IF elicits AT stress response via adipocyte-autonomous p53 signalling.
a Cell size quantification from histology images showing the normalised area of epididymal adipocytes of HFD-AL (n = 7 mice) and HFD-IF (n = 5 mice) groups. b, c mRNA expression levels of genes encoding for apoptotic, senescence, or DNA damage-associated markers in the adipocyte-rich fraction isolated from eWAT (b) or sWAT (c) of HFD-AL (n = 3 mice) or HFD-IF (n = 5 mice) mice. d Representative images showing histological stainings of cleaved caspase 3 in eWAT of HFD-AL and HFD-IF mice. Scale bars are 100 µm or 20 µm for the magnification. e Quantification of cleaved-caspase positive adipocytes in eWAT of HFD-AL (n = 10 mice) and HFD-IF (n = 7 mice) mice. f, g mRNA expression of Trp53 and p53 target genes Cdkn1a and Mdm2 in the adipocyte-rich fraction isolated from eWAT (f) or sWAT (g) of HFD-AL (n = 3 mice) and HFD-IF (n = 5 mice) mice. h Western blot analysis measuring p53 and GAPDH protein levels in isolated and differentiated cells from stromal vascular fraction (SVF) kept under nutrient-rich (Ctrl) or starvation (STV) conditions or treated with 1 µM of idasanutlin (NUT) (n = 3 independent isolations). i mRNA expression levels of Cdkn1a or Mdm2 in the differentiated SVF kept under Ctrl, STV or nutlin-treated conditions (n = 3 independent isolations). j Western blot analysis measuring p53 and GAPDH protein levels in differentiated p53 wildtype (WT) and knock out (KO) C3H10T1/2 cells (n = 3 independent experiments) kept under nutrient-rich control (Ctrl) or STV conditions. k, l mRNA expression levels of Cdkn1a and Mdm2 in p53 WT (k) and p53 knock out (KO, l) differentiated C3H10T1/2 cells kept under nutrient-rich control (Ctrl) or starvation (STV) conditions (n = 3 independent experiments). m, n mRNA expression levels of Trp53, Cdkn1a, and Mdm2 (m) or apoptotic genes (n) in differentiated SGBS cells under nutrient-rich control (Ctrl) or STV conditions and treated with siRNA targeting p53 (sip53) or siRNA control (siCtrl) (n = 3 independent experiments). Data are presented as mean values ± SEM. Significant differences were analysed by two-tailed, unpaired t-test (ac, eg), one-sample t-test (k, l), or one-way ANOVA (i, m, n) with Bonferroni post hoc tests. ***p < 0.001, **p < 0.01, and *p < 0.05. Exact p values: b Bax: 0.0004, Bcl2: 0.0086, Puma: 0.0235; c Bak1: 0.0194, Bax: <0.0001, Puma: <0.0001; f Trp53: 0.0364, Cdkn1a: 0.0013; g Cdkn1a: <0.0001, Mdm2: 0.0086; k Ckdn1a: 0.0111, Mdm2: 0.0070; m Ctrl siCtrl vs. STV siCtrl: Trp53: 0.0025, Cdkn1a: <0.0001, Mdm2: <0.0001; STV siCtrl vs. STV sip53: Trp53: <0.0001, Cdkn1a: <0.0001, Mdm2: 0.0021; n Ctrl siCtrl vs. STV siCtrl: Bcl2: 0.0353, Bax: 0.0013; STV siCtrl vs. STV sip53: Bcl2: <0.0001. Source data and uncropped blots are provided as a Source Data file.
Fig. 3
Fig. 3. Stress-induced p53 regulates eWAT remodelling in response to IF.
a Experimental timeline in transgenic mice with adipocyte-specific, inducible p53 knock out (HFD-IF-KO). b UMAP plots derived from single-nuclei RNA sequencing with annotation of major clusters. Number of unique nuclei are indicated for each group. FAPs fibro-adipogenic progenitors, ECs endothelial cells, MCs mesothelial cells, LECs lymphatic endothelial cells. c Violin plots showing expression of one representative marker gene for each annotated subpopulation. d, e Pie charts (d) and bar graphs (e) showing the percentage of annotated cell types in eWAT of HFD-AL, HFD-IF, and HFD-IF-KO mice. f Heatmap of untargeted proteomics analysis from lysates derived from eWAT of HFD-AL (n = 3 mice), HFD-IF (n = 4 mice), and HFD-IF-KO (n = 3 mice) mice. Detected proteins of all samples were ANOVA tested (FDR 0.05) and submitted to hierarchical clustering using Perseus. Values are displayed as z-scores. g Pathway analysis using Wilcoxon Rank Sum test with Bonferroni multiple testing correction of cluster C3 (IF-induced, p53-dependent) of proteomic analysis. Source data are provided as a Source Data file.
Fig. 4
Fig. 4. Lipid-associated macrophages strikingly increase in eWAT of intermittently fasted mice.
a Chord diagram showing the interaction network of different cell subpopulations in eWAT of HFD-IF and HFD-IF-KO mice, as determined by Cellchat (interaction strength is encoded in line thickness). b UMAP projections of annotated immune cell subpopulations (Lipid-associated macrophages (LAM), proliferating LAMs (P-LAM), perivascular macrophages (PVM), collagen-expressing macrophages (CEM), non-perivascular macrophages (NPVM), B cells, and T cells) in eWAT of HFD-AL, HFD-IF, and HFD-IF-KO mice. Number of unique nuclei are indicated for each group. c Violin plots showing expression of representative marker genes of each immune cell subpopulation. d, e Pie charts (d) and bar graphs (e) showing the relative percentage of each immune cell subpopulation in eWAT of HFD-AL, HFD-IF, and HFD-IF-KO mice. f Representative electron micrograph showing a lipid droplet-containing macrophage (arrow) in close proximity to an adipocyte (right, LD, unilocular lipid droplet) in eWAT of HFD-IF mice (representative out of 10 micrographs taken for each tissue from 3 mice per group). g, h LFQ intensity derived from the proteomics dataset of general macrophage markers (g), LAM-specific MMP12, and PVM-specific ENDOB1 (h) in eWAT of HFD-AL (n = 3 mice), HFD-IF (n = 4 mice), and HFD-IF-KO (n = 3 mice) groups. Data are presented as mean values ± SEM. Significant differences were analysed by one-way ANOVA with Bonferroni post hoc tests (g, h). ***p < 0.001. Exact p values: g HFD-AL vs. HFD-IF: CD68: 0.0002, LYZ2: <0.0001, RAC2: 0.0002; HFD-IF vs. HFD-IF-KO: CD68: 0.0001, LYZ2: <0.0001, RAC2: <0.0001; h HFD-AL vs. HFD-IF: MMP12: 0.0003, HFD-IF vs. HFD-IF-KO: MMP12: 0.0005. Source data are provided as a Source Data file.
Fig. 5
Fig. 5. Adipocyte p53 shapes the systemic response to IF.
a Body weight loss of HFD-IF (n = 3 mice) and HFD-IF-KO (n = 6 mice) mice. b Body weight before and after IF of HFD-IF and HFD-IF-KO (n = 9 mice per group) mice. c Adipose depot and liver (LIV) weight of HFD-IF and HFD-IF-KO (n = 9 mice per group) mice. d Plasma NEFA levels of HFD-IF (n = 8 mice) and HFD-IF-KO (n = 7 mice) mice. e Ex vivo lipolysis assay showing fatty acid release (mM) per hour (h) normalised to protein concentration of eWAT explants from HFD-IF or HFD-IF-KO mice (n = 3, fat pads from 3 mice). f Plasma ketone bodies of HFD-IF (n = 8 mice) and HFD-IF-KO (n = 6 mice) groups. g, h Insulin tolerance test (ITT) of chow-fed (n = 8 mice), HFD-IF (n = 10 mice), and HFD-IF-KO (n = 11 mice) groups. i Plasma insulin levels of HFD-IF and HFD-IF-KO (n = 7 mice per group) groups. j Normalised proteomics LFQ intensity of INSR in eWAT of HFD-AL (n = 3 mice), HFD-IF (n = 4 mice), and HFD-IF-KO (n = 3 mice) mice. k Respiratory exchange ratio (RER) of HFD-IF and HFD-IF-KO (n = 3 mice per group) groups during a time-period of 48 h analysed by indirect calorimetry. l Tnfa expression analysed in HFD-IF (n = 10 mice) and HFD-IF-KO (n = 9 mice) groups. Data are presented as mean values ± SEM. Significant differences were analysed by two-tailed, unpaired t-test (ce, f, i, l) or by one-way (h, j) or two-way (a, b, g, k) ANOVA with Bonferroni post hoc tests. ***p < 0.001, **p < 0.01, and *p < 0.05. Exact p values: b HFD-IF before vs. after: <0.0001, HFD-IF-KO before vs. after: <0.0001, after IF HFD-IF vs. HFD-IF-KO: 0.0490; c HFD-IF vs. HFD-IF-KO sWAT: 0.0001; d 0.0049; f 0.0259; h CHOW vs. HFD-IF: 0.0166; HFD-IF vs. HFD-IF-KO: <0.0001; i 0.0414; j HFD-AL vs. HFD-IF: 0.0301, HFD-IF vs. HFD-IF-KO: 0.0055; k 13:36: p = 0.0325, 13:51: p = 0.0002, 14:21: p = 0.0133, 15:0:6 p = 0.0052, 17:21: p = 0.0007, 17:51 p = 0.0052; l 0.0241. Source data are provided as a Source Data file.
Fig. 6
Fig. 6. p53 ablation in adipocytes de-represses catabolic and oxidative gene expression programmes.
a Differentially expressed genes between HFD-IF-KO and HFD-IF groups were extracted from the single nuclei RNA-seq data set (Supplementary Data 2). Genes de-repressed by p53 KO in the adipocyte cluster were mapped to gene ontology (GO) biological processes. Categories with FDR < 0.05 (FDR value given in bars) are shown, with enrichment ratios on the x-axis. b mRNA expression levels of lipolysis-associated genes in the adipocyte-rich fraction isolated from eWAT of HFD-IF and HFD-IF-KO (n = 3–4 mice per group) mice. c Normalised proteomics LFQ intensity of ATGL of HFD-AL (n = 3 mice), HFD-IF (n = 4 mice), and HFD-IF-KO (n = 3 mice) groups. d, e mRNA expression levels of lipolysis-associated genes (d) and Adgre1 (=F4/80) (e) in bulk eWAT of lean (CHOW, n = 5 mice) and p53 KO (CHOW-KO, n = 4 mice) mice. f Adrb3 mRNA expression levels in the adipocyte-rich fraction isolated of eWAT of HFD-IF or HFD-IF-KO (n = 4 mice per group) mice. g Transcript abundance of Adrb3 in adipocytes of HFD-AL, HFD-IF, and HFD-IF-KO mice as determined by single-nuclei RNA sequencing. h mRNA expression levels of fatty acid oxidation-related genes in the adipocyte-rich fraction isolated of eWAT from HFD-IF and HFD-IF-KO (n = 4 mice per group) mice. i Pathway analysis using Wilcoxon Rank Sum test with Bonferroni multiple testing correction of cluster 5 (IF-repressed, elevated in HFD-IF-KO over HFD-IF) of proteomic analysis (Fig. 3f). Data are presented as mean values ± SEM. Significant differences were analysed by two-tailed, unpaired t-test (b, df, h) or by one-way ANOVA with Bonferroni post hoc tests (c). ***p < 0.001, **p < 0.01, and *p < 0.05. Exact p values: b Atgl: 0.00395, Mgl: 0.0465, Hsl: 0.0067, Cgi58: 0.0004, Plin1: 0.0047; c HFD-AL vs. HFD-IF-KO: 0.0003, HFD-IF vs. HFD-IF-KO: 0.0005; d Hsl: 0.0171, Mgl: 0.0365, Plin1: 0.0454; f 0.0061; h: Acadvl: 0.0008, Acadvm: 0.0007, Acadl: 0.0005, Aox: <0.0001, Lpin1: 0.0004, Pdk4: 0.0005. Source data are provided as a Source Data file.
Fig. 7
Fig. 7. p53 is associated with weight loss retention in obese humans.
a Plasma IL-6 levels before and after three cycles of fasting-mimicking diet (FMD) in a cohort of diabetic patients (n = 8). bd Fat mass loss (in percent from baseline), plasma triglycerides, and HbA1c after FMD and stratification according to the TP53 P72R polymorphism (R72, n = 14 patients; P72, n = 6 patients). eh Body mass index (BMI) regain, plasma triglycerides, HbA1c, and glucose in the same cohort (R72, n = 14 patients; P72, n = 6 patients) after 1 week of refeeding after three FMD cycles. i, j RNA-seq expression of TP53 (i) and the LAM marker TREM2 (j) in visceral AT from obese subjects that were collected at the time they underwent bariatric surgery and after follow-up of 2 years. Comparison between weight loss retainers (BMI ≥ 25% loss retained, n = 44 patients) and weight re-gainers (BMI < 25% loss retained, n = 36 patients). Data are presented as mean values ± SEM. Significant differences were analysed by two-tailed, paired (a, i, j) or unpaired (bh) t-test. Exact p values are given in figures. Source data are provided as a Source Data file.
Fig. 8
Fig. 8. Scheme of key findings.
In the context of obesity, intermittent fasting increases the abundance of lipid-associated macrophages (LAMs) in crown-like structures of visceral adipose tissue of mice. This coincides with adipocyte apoptosis and activation of p53 signalling. Knock out (KO) of p53 specifically in adipocytes reduces inflammatory and apoptotic signalling, while elevating the catabolic state of adipocytes. Consequently, p53 KO leads to increased weight loss, enhancing the metabolic health benefits of intermittent fasting. Data in human cohorts implicate p53 in clinical weight loss scenarios. Created with BioRender (www.biorender.com).

Similar articles

Cited by

References

    1. Blüher M. Obesity: global epidemiology and pathogenesis. Nat. Rev. Endocrinol. 2019;15:288–298. doi: 10.1038/s41574-019-0176-8. - DOI - PubMed
    1. Kane H, Lynch L. Innate immune control of adipose tissue homeostasis. Trends Immunol. 2019;40:857–872. doi: 10.1016/j.it.2019.07.006. - DOI - PubMed
    1. Reilly SM, Saltiel AR. Adapting to obesity with adipose tissue inflammation. Nat. Rev. Endocrinol. 2017;13:633–643. doi: 10.1038/nrendo.2017.90. - DOI - PubMed
    1. Crupi AN, Haase J, Brandhorst S, Longo VD. Periodic and intermittent fasting in diabetes and cardiovascular disease. Curr. Diab. Rep. 2020;20:83. doi: 10.1007/s11892-020-01362-4. - DOI - PubMed
    1. Bray GA, Frühbeck G, Ryan DH, Wilding JPH. Management of obesity. Lancet. 2016;387:1947–1956. doi: 10.1016/S0140-6736(16)00271-3. - DOI - PubMed

Substances