. 2024 Apr;27(4):666-678.
doi: 10.1038/s41593-023-01568-1. Epub 2024 Feb 15.

A neuron-glia lipid metabolic cycle couples daily sleep to mitochondrial homeostasis

Affiliations

A neuron-glia lipid metabolic cycle couples daily sleep to mitochondrial homeostasis

Paula R Haynes et al. Nat Neurosci. 2024 Apr.

Abstract

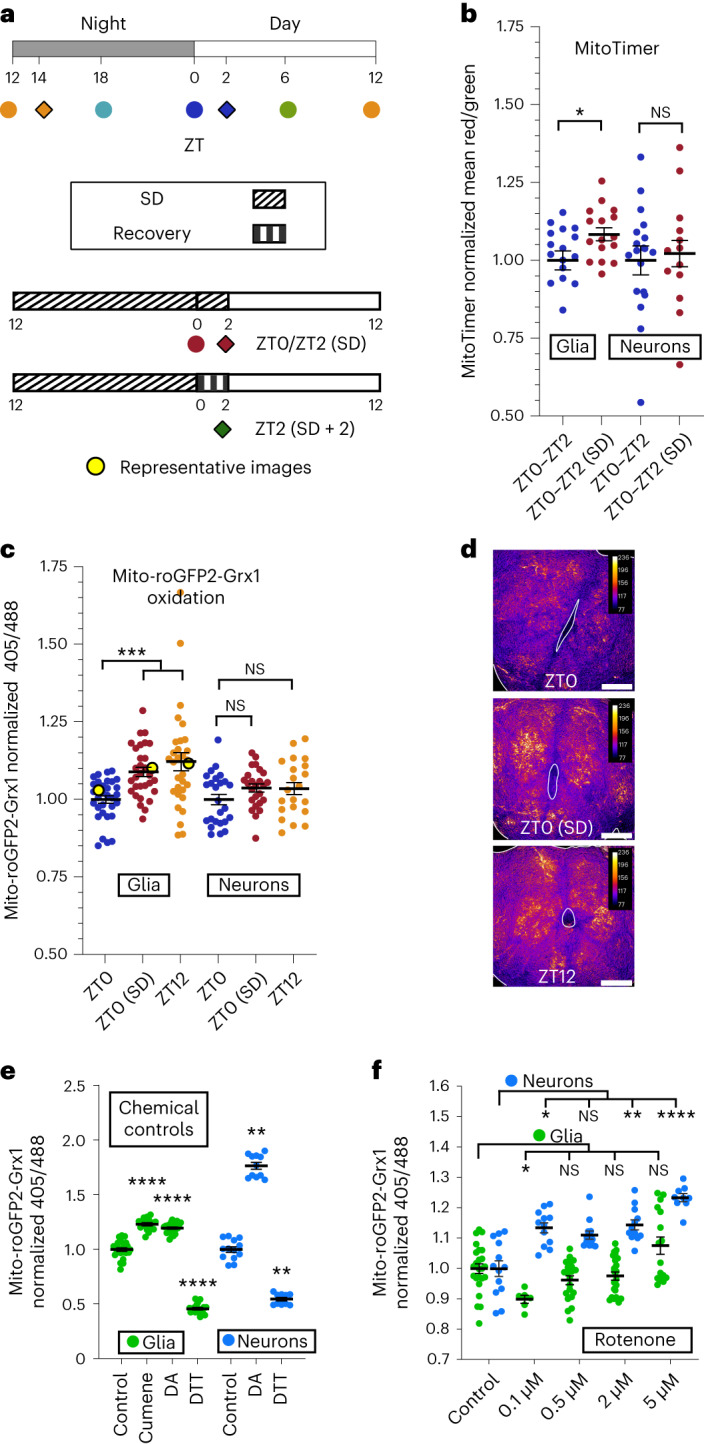
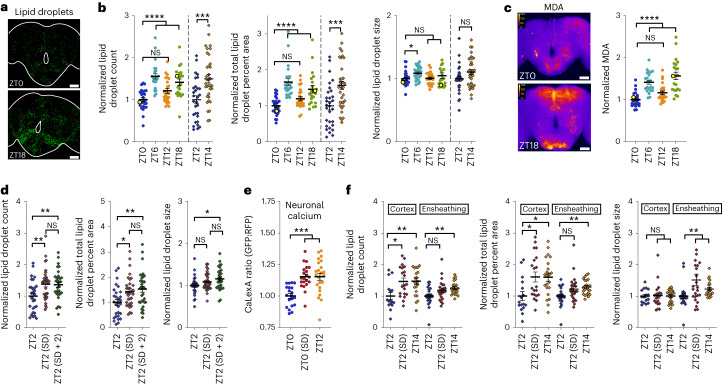
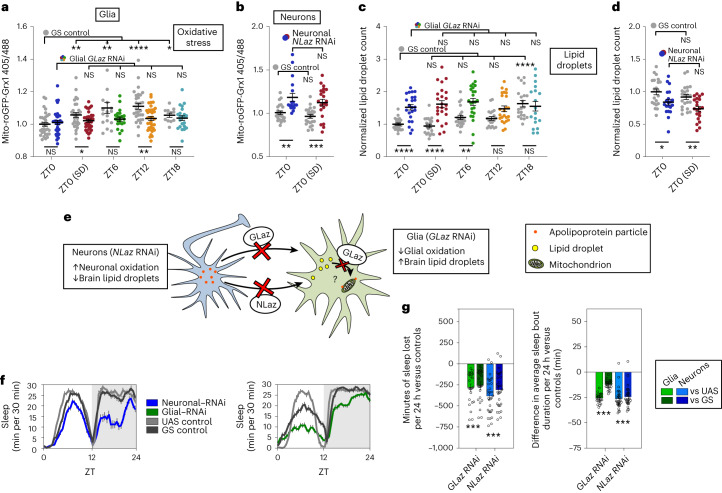
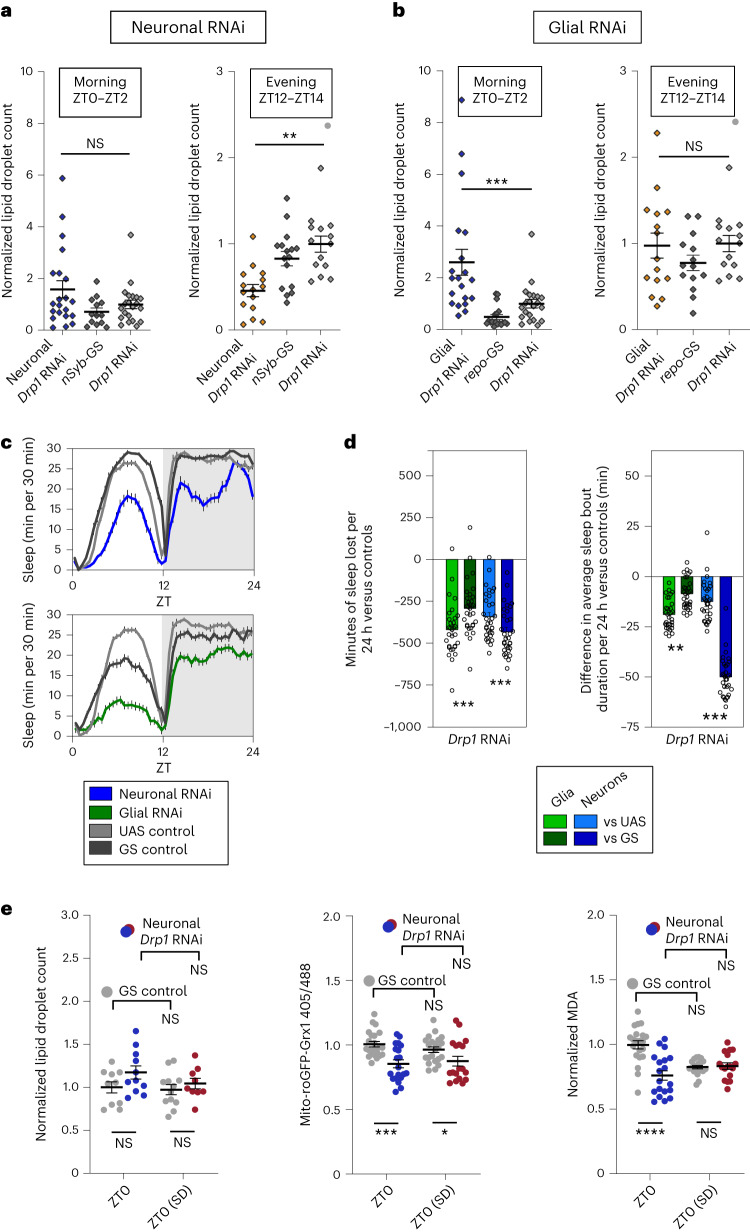
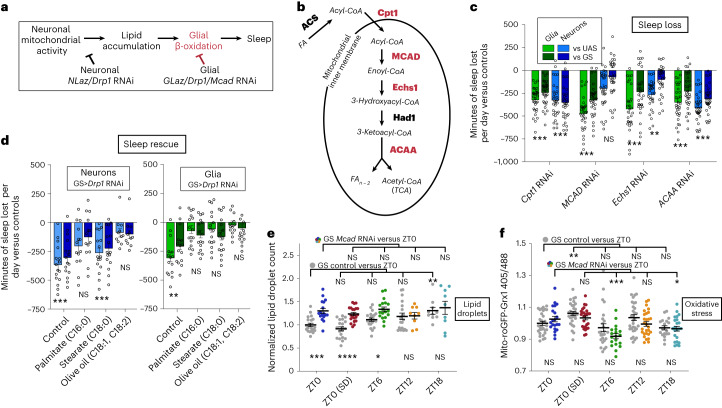
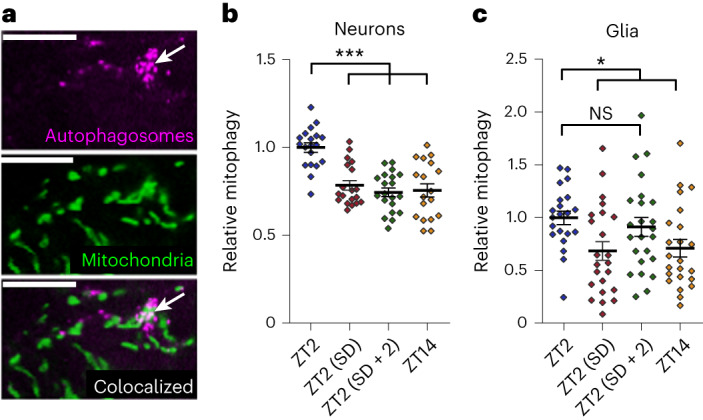
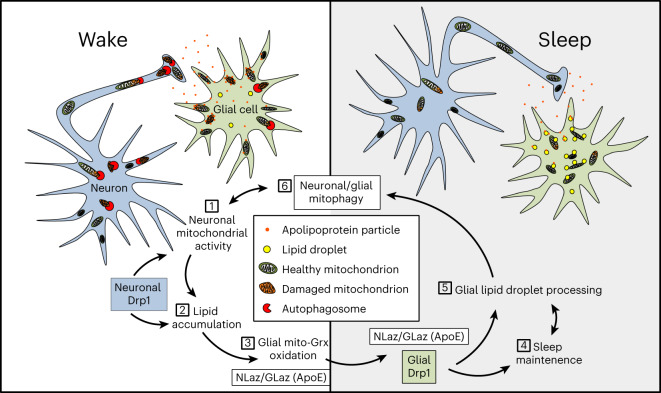
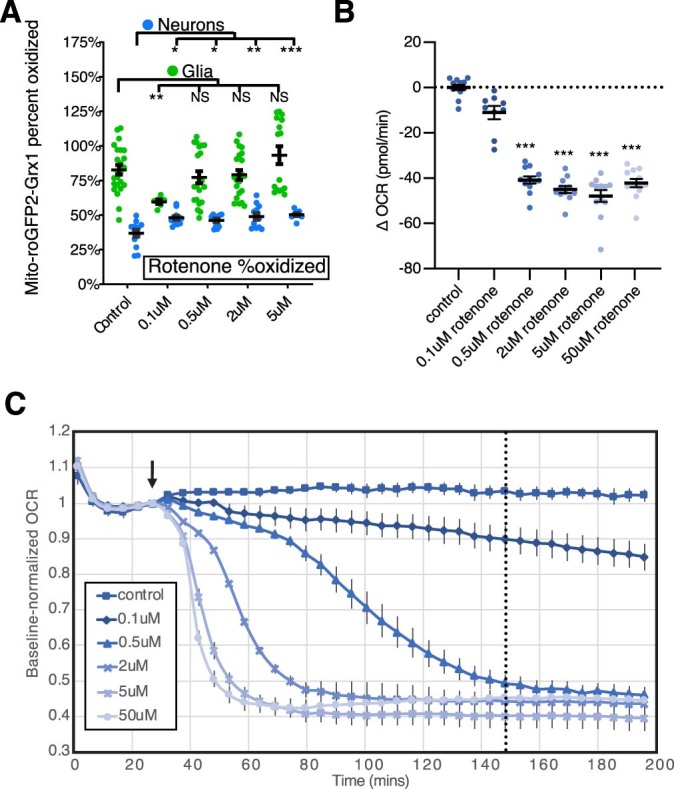
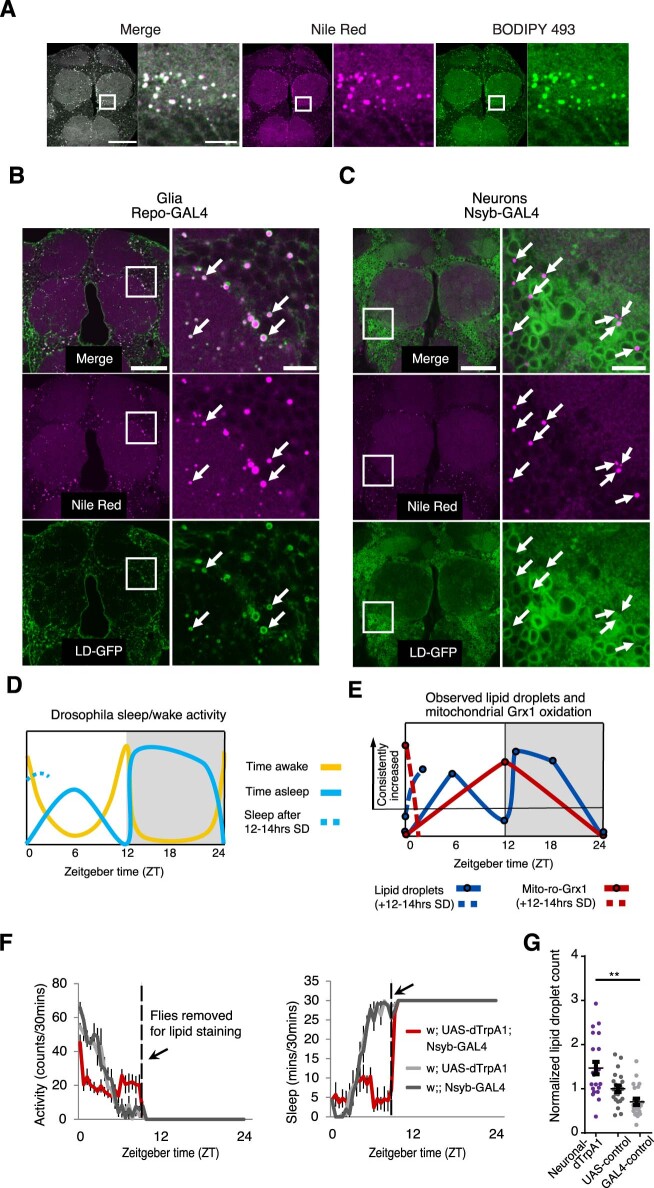
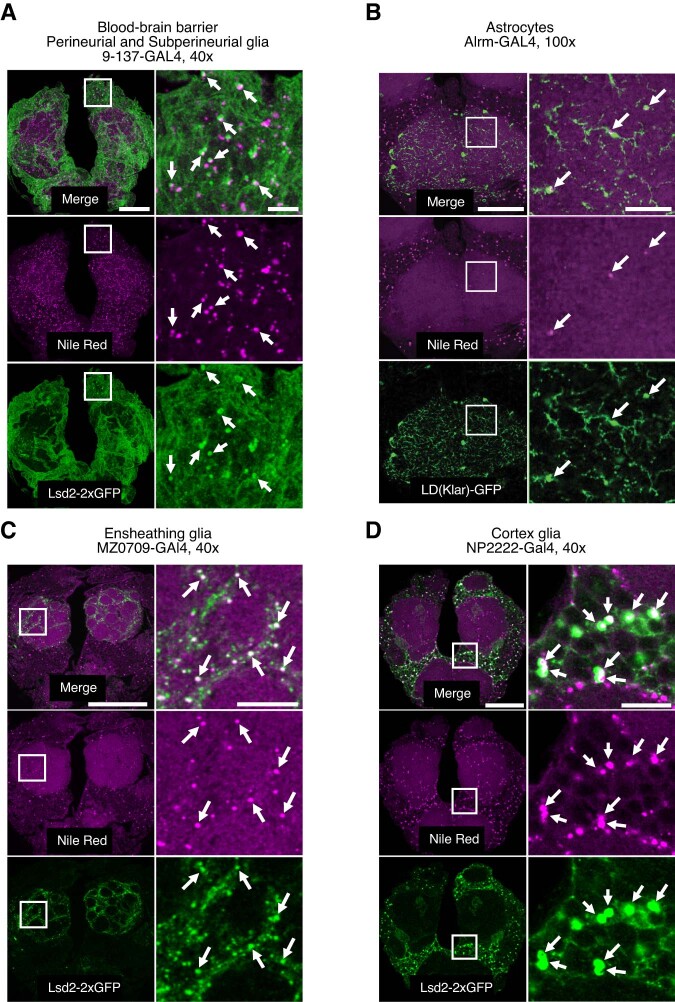
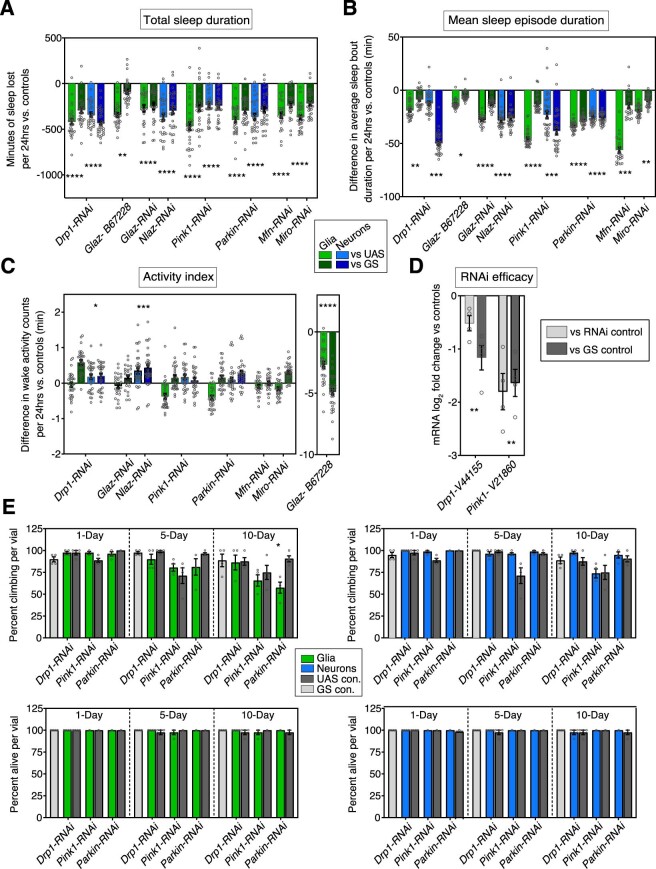
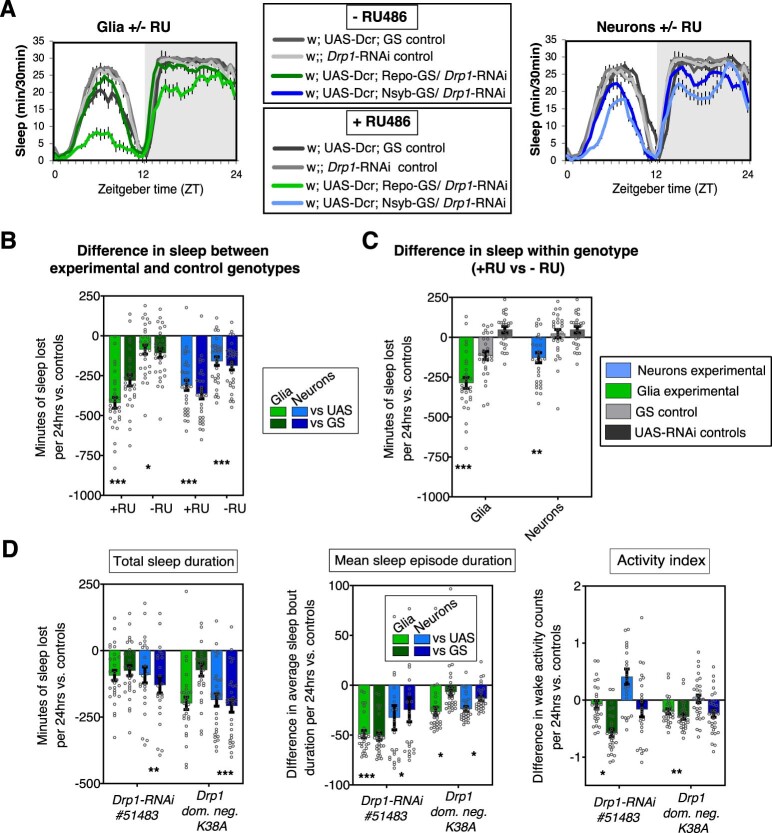
Sleep is thought to be restorative to brain energy homeostasis, but it is not clear how this is achieved. We show here that Drosophila glia exhibit a daily cycle of glial mitochondrial oxidation and lipid accumulation that is dependent on prior wake and requires the Drosophila APOE orthologs NLaz and GLaz, which mediate neuron-glia lipid transfer. In turn, a full night of sleep is required for glial lipid clearance, mitochondrial oxidative recovery and maximal neuronal mitophagy. Knockdown of neuronal NLaz causes oxidative stress to accumulate in neurons, and the neuronal mitochondrial integrity protein, Drp1, is required for daily glial lipid accumulation. These data suggest that neurons avoid accumulation of oxidative mitochondrial damage during wake by using mitophagy and passing damage to glia in the form of lipids. We propose that a mitochondrial lipid metabolic cycle between neurons and glia reflects a fundamental function of sleep relevant for brain energy homeostasis.


Conflict of interest statement

The authors declare no competing interests.

Figures

Fig. 1
Fig. 1. Wakefulness promotes oxidation of glial mitochondria.
a, Schematic showing light/dark entrainment, sleep deprivation (SD) and fly collection times for all experiments. Top, flies were collected at the indicated Zeitgeber Times, ZT. Bottom, Flies were sleep deprived for 12–14 h before collection at ZT0/2. If sleep recovery in the first 2 h of the morning was allowed, collection times for all groups were shifted by 2 h (ZT2/ZT14, filled diamonds/squares). b, Neuron/glia MitoTimer. Left, glial mitochondrial oxidation is increased in sleep-deprived flies compared to in control flies with a full night of sleep. Right, neuronal mitochondrial oxidation is not significantly affected by sleep deprivation; P = 0.73; NS, not significant. cf, Neuron/glia mito-roGFP2-Grx1. Glial mitochondrial oxidation is increased in flies at the end of the wake period (ZT12) and in sleep-deprived flies (ZT0; c, left). Neuronal mitochondrial oxidation is not significantly affected at the end of the wake period (ZT12) or by sleep deprivation; P ≥ 0.24 (c, right). Representative brains from glial mito-roGFP2-Grx1 experiments show the central brain with antennal lobes central and facing up (d; false colored with the fire LUT). Data points from the representative images are highlighted in yellow in c; scale bars, 50 μm each. e, Brains expressing mito-roGFP-Grx1 in neurons or glia were exposed to the chemical oxidizing agent DA (5 mM), the chemical reducing agent DTT (5 mM) or the lipid peroxide modeling compound cumene hydroperoxide (cumene; 2 mM). f, Brains were incubated with increasing doses of the complex I inhibitor rotenone (0.1, 0.5, 2 and 5 μM). Rotenone at all doses induced increases in neuronal, but not glial, mito-roGFP2-Grx1 oxidation. At 0.1 μM rotenone, glia exhibited a decrease in oxidation. In bf, repo-GAL4 was used for glial expression, and nSyb-GAL4 was used for neuronal expression. For all data shown, *P < 0.05, **P < 0.01, ***P < 0.001 and ****P < 0.0001. Bars/error bars indicate mean and s.e.m., respectively. Data points indicate individual flies/brains. The following are the numbers of flies (n) as plotted from left to right and the statistical tests used: glia n = 17 and 16 and neurons n = 16 and 16, Mann–Whitney test (two tailed; b); n = 32, 31, 31, 25, 21 and 25, Kruskall–Wallis test with a Dunn’s multiple testing correction (c); glia n = 24, 16, 22 and 18, analysis of variance (ANOVA), Fisher’s least significant different test, uncorrected; neurons n = 13, 11 and 10, Kruskall–Wallis test with a Dunn’s post hoc test, uncorrected (e); glia n = 24, 6, 21, 22 and 16, Kruskall–Wallis test with a Dunn’s multiple testing correction; neurons n = 13, 12, 12, 12 and 9, Kruskall–Wallis test with a Dunn’s multiple testing correction (f). Source data
Fig. 2
Fig. 2. Lipid droplets accumulate in glia following wake and neuronal activity.
a,b, Images of representative brains from lipid droplet experiments (a; data points in yellow in b) with BODIPY 493 brain lipid droplet staining. Lipid droplet count (b, left), percentage of brain area occupied (b, middle) and lipid droplet size (b, right) are shown; scale bars, 50 μm. c, Antibody staining for MDA. Right, central brain MDA. Left, images of representative brains from MDA staining experiments (data points in yellow on right); scale bars, 50 μm. d, Flies were sleep deprived for 14 h (ZT2 SD) or 12 h with 2 h of recovery sleep (ZT2 SD + 2). Lipid droplet count (left), percentage of brain area occupied (middle) and lipid droplet size (right) were quantified. e, Pan-neuronal (nSyb-GAL4) CaLexA-GFP shows that calcium is broadly increased in the brain following normal wake (ZT12) or a night of sleep deprivation (ZT0 SD); RFP, red fluorescent protein. f, A day of wake (ZT14) or a night (14 h) of sleep deprivation (ZT2 + SD) induces the accumulation of lipid droplets in the cortex and ensheathing glial subsets as quantified by UAS-Lsd-2-GFP. Increased lipid droplet count (left) in cortex glia (NP2222-GAL4) and ensheathing glia (MZ0709-GAL4) are apparent at ZT14 and ZT2 + SD. The percentages of brain area occupied by lipid droplets (middle) and lipid droplet size (right) in glial subsets are shown. Color and protocol designations are the same as in Fig. 1a. In b and d, ZT0/ZT6/ZT12/ZT18 (white Canton-S flies) were a separate set of experiments from ZT2/ ZT14 (Iso31). See Methods for further information. For all data shown, *P < 0.05, **P < 0.01, ***P < 0.001 and ****P < 0.0001, while some groups with P > 0.05 (not significant) are unmarked. Bars/error bars indicate mean and s.e.m., respectively. Data points indicate individual flies/brains. The following are the numbers of flies (n) as plotted from left to right and statistical tests used: ZT0/ZT6/ZT12/ZT18 n = 25, 24, 24 and 21, Kruskall–Wallis test with a Dunn’s multiple testing correction; ZT2/ZT14 n = 29 and 34, unpaired two-tailed t-test (b); n = 24, 22, 24 and 21, Kruskall–Wallis test with a Dunn’s multiple testing correction (c); n = 29, 33 and 33, ANOVA with a Holm–Sidak multiple testing correction (d); n = 20, 21 and 23, Kruskall–Wallis test with a Dunn’s multiple testing correction (e); nCortex = 16, 20 and 22; nEnsheathing = 24, 24 and 23; cortex, left and center: ANOVA with a Holm–Sidak multiple testing correction; cortex, right, and all ensheathing: Kruskall–Wallis test with a Dunn’s multiple testing correction (f). Source data
Fig. 3
Fig. 3. Adult-specific knockdown of lipid transport genes in neurons or glia causes sleep loss, alters cell-type-specific mitochondrial oxidation and impairs glial lipid droplet processing.
ad, Oxidative stress (mito-roGFP-Grx1; a and b) and lipid droplets (c and d) in glia (left) and neurons (right). The experimental GS>RNAi genotypes are shown in time point-specific colors (as in Fig. 1a), whereas the GS control genotypes are in gray. e, Schematic illustrating the effects of neuronal NLaz RNAi or glial GLaz RNAi on mito-roGFP2-Grx1 oxidation in neurons and glia, respectively, or on brain lipid droplets. Increased lipid droplets with glial GLaz RNAi suggests that GLaz may play an additional role in the delivery of lipids to mitochondria for breakdown. f, Total sleep (30-min bins) is reduced with adult-specific knockdown of NLaz in neurons (left) or GLaz in glia (right). Gray shading indicates the dark period. g, Adult-specific knockdown of the lipid transport genes GLaz in glia (green) or NLaz in neurons (blue) results in sleep loss (left) and reduced sleep bout duration (right). Sleep loss is represented as sleep of the experimental genotype minus the average sleep of each of the control groups (UAS or GS). repo-GS; Dcr with/without GLaz RNAi (V15389) and nSyb-GS; Dcr with/without NLaz RNAi (V35558) were used for all glial and neuronal experiments, respectively, in this figure along with mito-roGFP-Grx1 in non-sleep experiments. For ad, statistical differences across time points and within genotype are shown above the plotted points, whereas differences between experimental and control genotypes at each time point are shown below. For all data, bars/error bars indicate mean and s.e.m., respectively, where error due to subtraction between groups in sleep data has been propagated in the s.e.m. bars shown. Data points indicate individual flies/brains. For all data shown, *P < 0.05, **P < 0.01, ***P < 0.001 and ****P < 0.0001, while some groups with P > 0.05 (not significant) are unmarked. The following are the numbers of flies (n) as plotted from left to right and statistical tests used: n = 33, 30, 33, 33, 21, 21, 33, 33, 14 and 21; ZT0/ZT6/ZT12/ZT18, Kruskall–Wallis test with a Dunn’s multiple testing correction; ZT0/ZT0 SD (all comparisons), Mann–Whitney test (two tailed) except GS versus GS RNAi, which was analyzed by an unpaired two-tailed t-test (a); n = 22, 18, 22 and 21 (all comparisons), Mann–Whitney test (two tailed) except ZT0/ZT0 SD (GS versus GS), which was analyzed by an unpaired t-test (two tailed; b); n = 21, 23, 20, 24, 22, 24, 20, 24, 21 and 18; ZT0/ZT6/ZT12/ZT18, Kruskall–Wallis test with a Dunn’s multiple testing correction; ZT0/ZT0 SD (all comparisons), unpaired two-tailed t-test except ZT0/ZT0 SD (GS versus GS RNAi), which was analyzed by a two-tailed Mann–Whitney test (c); n = 21, 20, 22 and 21, all unpaired two-tailed t-test (d); n = 25, 25, 31 and 31, all Mann–Whitney test (two tailed; f and g). Source data
Fig. 4
Fig. 4. Accumulation of lipid droplets during wake depends on Drp1 in neurons while their clearance during sleep requires glial Drp1.
a,b,e, Lipid droplets were stained with BODIPY 493. a, Knockdown of Drp1 in neurons does not affect brain lipid droplet levels following sleep (left, ZT0–ZT2) but causes decreased lipid droplet accumulation after wake (right, ZT12–ZT14). b, Knockdown of Drp1 in glia causes an increase in brain lipid droplets following sleep (left, ZT0–ZT2) but does not affect lipid droplet accumulation after wake (right, ZT12–ZT14). c,d, Adult-specific knockdown of Drp1 in neurons (blue) or in glia (green) reduces total sleep (30-min bins (c) and 24-h bins (d, left)) and sleep bout duration (d, right). e, Neuronal Drp1 RNAi does not alter brain lipid droplet count (left) but reduces mito-roGFP2-Grx1 oxidation at ZT0 (middle) and brain MDA (right). Flies for lipid droplet experiments in a and b were collected from ZT0 to ZT2 or from ZT12 to ZT14, whereas flies in e were collected at ZT0. In e, statistical differences across time points and within genotype are shown above the plotted points, whereas differences between experimental and control genotypes at each time point are shown below. repo-GS; Dcr or nSyb-GS; Dcr with/without Drp1 RNAi (V44155) were used for all glial and neuronal experiments, respectively. In d, sleep loss is represented as sleep of the experimental genotype minus the average sleep of each of the control groups (UAS or GS). Data points indicate individual flies/brains. For all data, bars/error bars indicate mean and s.e.m., respectively, where error due to subtraction between groups in sleep data has been propagated in the s.e.m. bars shown. For all data shown, *P < 0.05, **P < 0.01, ***P < 0.001 and ****P < 0.0001, while some groups with P > 0.05 (not significant) are unmarked. The following are the numbers of flies (n) as plotted from left to right and statistical tests used: n = 21, 13, 21, 15, 16 and 14, all comparisons Mann–Whitney test (two tailed; a); n = 20, 18, 21, 15, 14, 14 and 14, all comparisons Mann–Whitney test (two tailed; b); n = 31, 31, 32 and 32, all comparisons Mann–Whitney test (two tailed; c and d); n = 10, 11, 12 and 9, all comparisons unpaired two-tailed t-test (e, left); n = 21, 17, 21 and 19, all comparisons Mann–Whitney test (two tailed) except GS versus GS, which was analyzed by unpaired two-tailed t-test (e, middle); n = 21, 19, 21 and 17, all comparisons unpaired two-tailed t-test (e, right). Source data
Fig. 5
Fig. 5. β-Oxidation of fatty acids in glia is required for sleep.
a, Model for lipid transporter and Drp1-knockdown effects on brain lipid droplets and sleep. If glial mitochondrial β-oxidation (red) is required for breakdown of lipids and sleep, glial Mcad or Drp1 RNAi should result in increased lipid accumulation and reduced sleep. b, Drosophila genes involved in mitochondrial fatty acid (FA) β-oxidation. Genes driving enzymatic steps are shown in bold, whereas fatty acid modifications are italicized. Red indicates the genes tested and shown to reduce sleep with RNAi expression in glia (RNAis were not tested for genes in black); TCA, tricarboxylic acid cycle. c, Adult-induced knockdown of fatty acid catabolism genes. Mcad and Echs1 in glia (green) cause greater sleep loss per 24 h than neuronal knockdown (blue). d, Dietary fatty acid supplementation rescues sleep loss resulting from neuronal (left, blue) or glial (right, green) Drp1 RNAi (V44155). The comparisons shown are between the experimental (GS>RNAi) and control genotypes (GS or RNAi) on each FA; within-genotype comparisons are shown in Extended Data Fig. 7a. e,f, Adult-induced glial Mcad RNAi disrupts lipid droplet processing during sleep (e) and the dynamics of glial mitochondrial oxidative stress as measured with mito-roGFP2-Grx1 (f). For c and d, individual points indicate sleep of individual experimental flies minus the average sleep of the respective control group. repo-GS; Dcr and nSyb-GS; Dcr with/without RNAis were used for all glial and neuronal experiments, respectively. In c and d, sleep loss is represented as sleep of the experimental genotype minus the average sleep of each of the control groups (UAS or GS). Data points indicate individual flies/brains. For all data, bars/error bars indicate mean and s.e.m., respectively, where error due to subtraction between groups in sleep data has been propagated in the s.e.m. bars shown. For all data shown, *P < 0.05, **P < 0.01, ***P < 0.001 and ****P < 0.0001, while some groups with P > 0.05 (not significant) are unmarked. The following are the numbers of flies (n) as plotted from left to right and statistical tests used: n = 32, 32, 32, 32, 32, 32, 31, 31, 30, 30, 31, 31, 32, 32, 32, 32 and 32, all comparisons Mann–Whitney test (two tailed; c); neurons n = 16, 16, 14, 14, 16, 16, 11 and 11 and glia = 15, 15, 16, 16, 16, 16, 14 and 14, all comparisons Mann–Whitney test (two tailed; d); n = 20, 17, 20, 21, 21, 18, 19, 9, 10 and 9, ZT0/ZT6/ZT12/ZT18, all ANOVA with a Holm–Sidak multiple testing correction except GS versus GS, which was analyzed by a Kruskall–Wallis test with a Dunn’s multiple testing correction; ZT0/ZT0 SD, all unpaired two-tailed t-test (e); n = 31, 24, 30, 26, 28, 21, 32, 28, 21 and 23, ZT0/ZT6/ZT12/ZT18, all Kruskall–Wallis test with a Dunn’s multiple testing correction; ZT0/ZT0 SD, all Mann–Whitney test (two tailed; f). Source data
Fig. 6
Fig. 6. Sleep is required for mitophagy in neurons and glia.
a, The mitochondrial and autophagy markers UAS-mito-GFP (middle) and UAS-Atg8-mCherry (top), respectively, were expressed in neurons with nSyb-GAL4 or glia with repo-GAL4. Colocalization (bottom) between autophagosomes and mitochondria was used to quantify mitophagy. The example images shown are from a small section of a single z slice of a brain with glial marker expression. The arrow indicates colocalization between mitochondria and autophagosomes (mitophagy); scale bars, 10 μm. b,c, Neuronal (b) and glial (c) mitophagy are greatest in the morning (ZT2) following a full night of sleep. Reduced mitophagy following a day of wake (ZT14) or a night of sleep deprivation (ZT2 (SD)) indicates that changes in mitophagy are sleep dependent rather than circadian clock dependent. Sleep deprivation/recovery and circadian time of fly collection are the same as shown in Fig. 1. For all data shown, *P < 0.05, **P < 0.01 and ***P < 0.001, while some groups with P > 0.05 (not significant) are unmarked. Bars/error bars indicate mean and s.e.m., respectively. Data points indicate individual brains/flies. The following are the numbers of flies (n) as plotted from left to right and statistical tests used: n = 19, 19, 20 and 18, Kruskall–Wallis test with a Dunn’s multiple testing correction (b); n = 21, 23, 24 and 23, Kruskall–Wallis test with a Dunn’s multiple testing correction (c). Source data
Fig. 7
Fig. 7. Model for a sleep-regulated metabolic cycle between neurons and glia.
(1) During wake, mitochondrial energetic activity in neurons results in the production of lipids, which are transferred to glia. (2) As lipids are transferred during wake, glial mitochondria become oxidized, as indicated by mito-roGFP-Grx1 and MitoTimer. Neuronal Drp1 (blue) is required for maximal mitochondrial energetic efficiency and subsequent glial lipid accumulation. (3) Wake-driven glial mitochondrial oxidative stress and lipid accumulation also require the expression of the lipid transfer genes GLaz in glia and NLaz in neurons. Reductions in GLaz or NLaz disrupt lipid droplet dynamics and cause mitochondrial oxidative stress to accumulate in neurons rather than in glia (Fig. 3e). Sustained lipid delivery and subsequent catabolism of lipids in glia, facilitated by neuronal NLaz, glial GLaz, Drp1 and glial mitochondrial β-oxidation (Mcad), are required for daily sleep (4), and, in turn, sleep is necessary for glial lipid catabolism (5). Finally, sleep promotes mitophagy in neurons and glia (6), ensuring the maintenance of a new/healthy population of mitochondria, which are critical for maximally efficient neuronal mitochondrial activity during a new day of wake (1).
Extended Data Fig. 1
Extended Data Fig. 1. Controls for mito-roGFP-Grx1 sensor function show that ROS-induced inhibition of mitochondrial CI respiration results in significant oxidation of neuronal mitochondria.
(A) The data in main Fig. 1e, f was used to calculate percent oxidation of rotenone-exposed neurons and glia relative to the specific minimum (DTT) and maximum (DA) oxidation levels in each cell type. The data shown here is the same as that in Fig. 1f, but presented in terms of percent oxidized for each cell type (calculation as indicated in Methods). (B) A Seahorse XFe96 system was used to measure oxygen consumption of individual Drosophila brains in the presence of increasing concentrations of the mitochondrial complex-I inhibitor, rotenone. OCR is significantly reduced following a 2 hr exposure to 0.5uM or greater doses of rotenone. ΔOCR was calculated for each brain as the change in OCR after 120 mins of rotenone exposure minus the baseline OCR at 27 mins. ΔOCR values were pooled within each group. (C) The Oxygen Consumption Rate (OCR in pmol/min) of each brain over time is shown normalized to its baseline OCR after a 27-minute stabilization period, indicated by the arrow, just prior to rotenone injection. The dotted line at 147 mins (120 mins after rotenone injection) indicates the timepoint used for quantification of ΔOCR values in B. For all data shown, *=p < 0.05, **=p < 0.01 and ***=p < 0.001 while some groups with p > 0.05 (not significant) are unmarked. Bars/ error bars indicate mean and SEM, respectively. Data points indicate individual brains. Number of flies/brains (n) as plotted from left to right and statistical test used: (A) n = 24,6,21,22,16; all Kruskall-Wallis-Dunn’s MC (B-C) n = 12,9,12,11,12,12; Kruskall-Wallis-Dunn’s MC. MC = corrected for multiple comparisons. Source data
Extended Data Fig. 2
Extended Data Fig. 2. Central brain lipid droplets in Drosophila are localized primarily to glia and increase with neural activity.
(A) The lipophilic dyes, BODIPY 493 and Nile Red, colocalize in Drosophila brains and can be used interchangeably. Here, the anterior region of a single, central brain is shown stained with both dyes. (A, right- green) BODIPY 493 staining, (A, center -magenta) Nile Red staining and (A, left) merge of both channels with colocalization in white. (n = 6 brains were imaged to verify colocalization between BODIPY and Nile Red.) (B and C) The lipid droplet marker, UAS-LD-GFP, was expressed in glia with Repo-GAL4 or in neurons with Nsyb-GAL4 and stained with the lipophilic dye, Nile Red. (B) LD-GFP expressed in glia was found to localize in a ring around nearly all Nile-Red stained lipid droplets (n = 7/7 of brains imaged showed GFP and Nile Red colocalization). (C) Conversely, neuronally-expressed LD-GFP exhibited a very bright, diffuse localization pattern in neuropil and the periphery of cell bodies and was never seen in a ring pattern around any lipid droplets stained by Nile Red (n = 0/7 of brains imaged showed GFP and Nile Red colocalization). For all images, the central brain is shown on the left with a white box indicating the enlarged region shown on the right. Arrows mark the locations of representative lipid droplets. Scale bars at left are 50uM each and at right (enlarged) are 10uM each. All images were acquired with sequential, independent imaging of red and green excitation/emission. Proper dye-staining protocols can be found in the Methods section and were critical for visualization of central brain lipid droplets. (D) Known patterns of time spent awake (yellow) and time spent asleep (blue) throughout the day in Drosophila on a 12:12 light: dark cycle or following sleep deprivation (dotted). (E) Schematic summarizing experimental timepoints from all figures, connected by lines, from lipid droplet count (dark blue) and glial mito-roGFP2-Grx1 oxidation (red) experiments showing when each metric is or is not consistently increased. While both dependent on prior wake, increases in mito-roGFP2-Grx1 oxidation are most consistent during known wake periods (ZT0 + SD and ZT12, as in D), while lipid droplet count only increases consistently during periods with some sleep (ZT2 + SD, ZT6, ZT14, ZT18, as in D). In flies on RU-486, mito-roGFP-Grx1 is most consistently increased after SD and lipid droplets are most consistently increased at ZT18. (F) Activity counts per 30 minutes (left) and sleep per 30 minutes (right) of flies with dTrpA1-induced neuronal hyperactivation (red) and controls (grey). The temperature was increased from 23 °C to 25.5 °C at ZT0 and remained at 25.5°C from ZT0-ZT9. (G) Hyperactivation of all neurons with Nsyb>dTrpA1 (25.5 °C) from ZT0-ZT9 causes a further increase in lipid droplet accumulation over controls. For all data shown, *=p < 0.05, **=p < 0.01, ***=p < 0.001 and ****=p < 0.0001. Bars/ error bars indicate mean and SEM, respectively. Data points indicate individual flies/brains. Number of flies (n) as plotted from left to right and statistical test used: (F-G) n = 22,23,23; Mann-Whitney-two tailed. Source data
Extended Data Fig. 3
Extended Data Fig. 3. Lipid droplets in the Drosophila brain are localized primarily to cortex and ensheathing glia.
Glial subset-specific GAL4 lines were used to express the LD-GFP or Lsd2-GFP, and brains were stained with the lipophilic dye, Nile Red. Colocalization of subset-specific LD/Lsd2-GFP puncta with Nile-red stained lipid droplets was taken as indication of the capacity for lipid droplet formation within a given glial subset. (A) Blood-brain barrier (BBB) glia encompassing the perineurial and subperineurial populations (9-137-GAL4), contain a small number of lipid droplets. Generally, no more than ~20 lipid droplets per brain could be observed in the BBB and counts did not appear to be obviously altered by a night of sleep deprivation. (n = 9 non-deprived and n = 9 sleep-deprived brains). In order to illustrate the presence of BBB lipid droplets, the images shown are a maximum projection of 3-confocal Z-planes showing an unusually dense region of BBB lipid droplet expression. (B) Astrocytes expressing LD-GFP in the Alrm-GAL4 expression pattern form only a few, sparse lipid droplets (n = 3 brains). The region shown is of the subesophageal area of the central brain (100x magnification). Other neuropil areas exhibited a similar sparseness of astrocytic lipid droplets. (C) Ensheathing glia (MZ0709-GAL4) contain large numbers of very small lipid droplets. The majority of Nile-Red stained lipid droplets within neuropil regions appear to localize to neuropil compartment boundaries where ensheathing glia are located, as shown here surrounding antennal lobe glomeruli. (n = 10/10 brains imaged). (D) Cortex glia (NP2222-GAL4) contain a high density of larger lipid droplets. Nearly all Nile-Red-stained lipid droplets outside of neuropil regions localize to cortex glia. (n = 8/8 brains imaged). For all images, the central brain is shown on the left with a white box indicating the enlarged region shown on the right. Scale bars at left are 50uM each and at right (enlarged) are 10uM each. The bottom panel of each group of images shows Lsd2/LD-GFP expression driven by the respective GAL4, the central panel shows Nile Red staining of the same brain/z-slice and the top panel shows a merge of the green and red channels. Arrows mark the locations of representative lipid droplets. All images were acquired with sequential imaging of red and green excitation/emission to prevent any bleed-through between channels. Source data
Extended Data Fig. 4
Extended Data Fig. 4. RNAi knockdown of lipid transfer or mitochondrial damage control genes: additional sleep parameters, qPCR, negative geotaxis and survival.
Knockdown of lipid transfer and mitochondrial damage control genes reduces total sleep duration (A), and mean sleep episode duration (B) without general effects on activity index (C). RNAi was adult-induced with Nsyb-GS;Dcr or Repo-GS;Dcr: Drp1-RNAi (V44155), Glaz-RNAi (V15389) Nlaz-RNAi (V35558) Pink1-RNAi (V21860), Parkin-RNAI (V47636), Mfn-RNAi (B67158), Miro-RNAi (V330334). Neuronal, but not glial, Drp1-RNAi expression results in an increased activity index when flies are awake and does not occur with an alternative Drp1-RNAi insertion or dominant negative Drp1(Extended Data Fig. 5). Neuronal Nlaz-RNAi, but neither glial Glaz-RNAi construct results in an increased activity index, suggesting increased activity index is not general phenomenon associated with lipid-transfer RNAis. An alternative Glaz-RNAi line (B67228) exhibited sleep loss and fragmentation (A-B) in spite of a severe activity index deficit (C, right). (D) Drp1-(V44155) or Pink1-(V21860) RNAi expression was induced with Actin5C-GS for 5-6 days and the difference in mRNA expression between experimental and UAS/GS controls was quantified by qPCR. Nlaz, Glaz, Pink1, Parkin, Mfn and Miro-RNAi knockdown have been verified elsewhere, as indicated in the Methods section. (E) Negative geotaxis (top) and survival (bottom) with adult-induced expression of Drp1-RNAi (V44155), Pink1-RNAi (V21860) or Parkin-RNAi (V47636) in neurons (blue) or glia (green). Neuronal knockdown does not affect negative geotaxis or survival within the first 10-days while glial knockdown of Pink1 or Parkin causes negative geotaxis at 10-days only. Glial Drp1-RNAi animals are unaffected. Bars/error bars indicate mean and SEM, respectively, where error due to subtraction between groups in sleep data has been propagated in the SEM bars shown. For sleep data, individual points indicate sleep of individual experimental flies minus the average sleep of the respective control group. P-values shown are the greater (least significant) of these two sets of comparisons, where *=p < 0.05, **=p < 0.01, ***=p < 0.001 and ****=p < 0.0001. Number of flies (n) as plotted from left to right and statistical test used: (A-C) n = 31,31,32,32,32,32,25,25,31,31,30,30,31,31,32,32,32,31,31,25,25,32,32; all Mann-Whitney-2T (D) n = 4 biological replicates with 10 flies per genotype in each replicate; paired T-test-2T (E) n = 4 vials (replicates) per genotype with 10 flies per vial; unpaired T-test-2T. 2T = two-tailed. Source data
Extended Data Fig. 5
Extended Data Fig. 5. Drp1-knockdown sleep phenotypes are driven by RU486-specific induction and corroborated by alternative methods of Drp1 knockdown.
(A-C) Repo-GS;Dcr or Nsyb-GS;Dcr was used to drive Drp1-RNAi (V44155) expression in glia or neurons, respectively, and total sleep was compared for all genotypes in the presence or absence of the GS activator, RU-486. (A) Total sleep per 30 minutes of glial (left, green) and neuronal (right, blue) experimental and control groups with or without RU486 in the food. (B) Difference in total sleep between the experimental and control genotypes on the same food (+RU or –RU). The experimental genotypes show some sleep loss both in the presence and absence of RU-486, as has been reported previously, however sleep loss is significantly greater in the presence of RU-486, indicating additional adult-specific induction. (C) Difference in total sleep as compared within each genotype in the presence or absence of RU-486. In spite of some leakiness, experimental groups (Repo/Nsyb-GS>Drp1-RNAi) show greater sleep loss in the presence of RU486 than in the absence of RU486, while control groups show no consistent differences. (D) Repo-GS;Dcr or Nsyb-GS;Dcr was used to drive an alternative RNAi against Drp1 (B51483), as well as over-expression of dominant-negative Drp1 (K38A) in glia or neurons, respectively. (D, left) Total sleep duration is reduced with neuronal knockdown of Drp1 expression/activity. (D, center) Mean sleep episode duration is reduced with knockdown of Drp1 expression/activity in neurons or glia. (D, right) activity index is reduced with knockdown of Drp1 expression/activity in glia. Bars/error bars indicate mean and SEM, respectively, where error due to subtraction between groups has been propagated in the SEM bars shown. Individual points indicate sleep of individual experimental flies minus the average sleep of the respective control group. P-values shown are the greater (least significant) of these two sets of comparisons, where *=p < 0.05, **=p > 0.01 and ***=p < 0.001. Groups with p > 0.05 (not significant) are unmarked. Number of flies (n) as plotted from left to right and statistical test used: (A-B) n = 29,29,30,30,30,30,30,30; all comparisons - Mann-Whitney-2T (C) n = 29,30,28,30,30,28; all comparisons - Mann-Whitney-2T (D, all) n = 28,28,23,23,29,29,29,29; all comparisons - Mann-Whitney-2T. 2T = two-tailed. Source data
Extended Data Fig. 6
Extended Data Fig. 6. Effects of mitochondrial and beta oxidation gene expression knockdown on sleep.
(A and B) Constitutive knockdown of Drp1 in wake-promoting neuronal subsets (Dopaminergic/ple-GAL4, MB-α’β’-m/R26E01-GAL4) or sleep-promoting neuronal subsets (GABAergic/Gad2B-GAL4, dFSB/R23E10-GAL4) reduces and fragments 24 hr sleep (A and B, blue). As opposed to adult-induced induction with Geneswitch, constitutive expression of Drp1-RNAi in glia (Repo-GAL4) increases 24 hr sleep (A, green) and sleep consolidation (B, green). However, constitutive expression of Drp1-RNAi in all neurons (Nsyb-GAL4, blue) is consistent with the adult-induced sleep loss resulting from induction with Geneswitch. (C) Activity while awake is not significantly altered with constitutive Drp1-RNAi in any of these populations. The Drp1-RNAi line used in A-C is the same as that in Fig. 4 (VDRC #44155). (D) Temperature-sensitive-GAL80-mediated, adult-induced knockdown of fatty acid catabolism gene, MCAD, in ensheathing glia (driven by MZ0709-GAL4, yellow/orange) or cortex glia (driven by NP2222-GAL4, red) results in sleep loss. Black bars at the top indicate baseline and recovery periods at 18 °C, while the red bar indicates induction of RNAi expression (derepression of GAL4 activity) at 31 °C. Unshaded regions indicate daytime sleep change (ZT0-12), while shaded regions indicate nighttime sleep change (ZT12-24). (E) Mean Sleep bout duration and (F) activity index associated with the experiment in Fig. 5c. All glial-RNAis cause reduced mean sleep episode duration. Neuronal RNAi against CPT1 and ACAA reduced sleep episode duration while increasing activity index. Bars/error bars indicate mean and SEM, respectively, where error due to subtraction between groups has been propagated in the SEM bars shown. Individual points indicate sleep of individual experimental flies minus the average sleep of the respective control group. P-values shown are the greater (least significant) of these two sets of comparisons, where *=p < 0.05, **=p < 0.01, ***=p<0.001 and ****=p < 0.0001. Groups with p > 0.05 (not significant) are unmarked. Number of flies (n) as plotted from left to right and statistical test used: (A-C) n = 23,23,24,24,31,31,28,28,28,28,32,32; all comparisons- Mann-Whitney-2T (D) n = 27 for all genotypes; all comparisons- Mann-Whitney-2T (E-F) n = 32,32,32,32,32,32,31,31,30,30,31,31,32,32,32,32,32 all comparisons- Mann-Whitney-2T. 2 T = two-tailed. Source data
Extended Data Fig. 7
Extended Data Fig. 7. Additional comparisons and sleep parameters for Drp1-RNAi lines with fatty acid rescue.
Additional comparisons from the experiment shown in main Fig. 5d with adult-induced neuronal (Nsyb-GS;Dcr) or glial (Repo-GS;Dcr) knockdown of Drp1 (V44155) in the presence of fatty acid feeding. (A) Difference in total sleep duration within each genotype on control food or food supplemented with the indicated fatty acid. As with comparisons between genotypes (main Fig. 5d), comparisons within each genotype indicate that sleep loss with neuronal Drp1-RNAi is rescued only by olive oil, while sleep loss with glial knockdown is rescued by palmitate, stearate and olive oil. The Nsyb and Repo-GS control groups also show some sleep gain with fatty acid supplementation, but this gain is not as great as within the experimental groups and is not observed consistently in repeat experiments or in UAS controls. (B) Difference in activity index within each genotype and between genotypes (C) indicates fatty acid feeding does not impair locomotor activity during wake and may increase it in some conditions. Bars/error bars indicate mean and SEM, respectively, where error due to subtraction between groups has been propagated in the SEM bars shown. Individual points indicate sleep of individual experimental flies minus the average sleep of the respective control group. P-values shown are the greater (least significant) of these two sets of comparisons, where *=p < 0.05, **=p < 0.01, ***=p < 0.001 and ****=p < 0.0001. Groups with p > 0.05 (not significant) are unmarked. Number of flies (n) as plotted from left to right and statistical test used: (A-B) neurons n = 14,14,16,16,16,16,11,13,9 glia n = 16,16,16,16,16,16,14,13,9 all comparisons- Mann-Whitney-2T (C) n = 15,15,16,16,16,16,14,14,16,16,16,16,14,14,11,11 all comparisons- Mann-Whitney-2T. 2 T = two-tailed. Source data

References

    1. Xie L, et al. Sleep drives metabolite clearance from the adult brain. Science. 2013;342:373–377. doi: 10.1126/science.1241224. - DOI - PMC - PubMed
    1. DiNuzzo M, Nedergaard M. Brain energetics during the sleep–wake cycle. Curr. Opin. Neurobiol. 2017;47:65–72. doi: 10.1016/j.conb.2017.09.010. - DOI - PMC - PubMed
    1. Bedont JL, et al. Short and long sleeping mutants reveal links between sleep and macroautophagy. eLife. 2021;10:e64140. doi: 10.7554/eLife.64140. - DOI - PMC - PubMed
    1. Petit J-M, Magistretti PJ. Regulation of neuron–astrocyte metabolic coupling across the sleep–wake cycle. Neuroscience. 2016;323:135–156. doi: 10.1016/j.neuroscience.2015.12.007. - DOI - PubMed
    1. Artiushin G, Zhang SL, Tricoire H, Sehgal A. Endocytosis at the Drosophila blood–brain barrier as a function for sleep. eLife. 2018;7:e43326. doi: 10.7554/eLife.43326. - DOI - PMC - PubMed

LinkOut - more resources