. 2024 Feb 15;7(1):184.
doi: 10.1038/s42003-024-05883-6.

Compressive stress triggers fibroblasts spreading over cancer cells to generate carcinoma in situ organization

Affiliations

Compressive stress triggers fibroblasts spreading over cancer cells to generate carcinoma in situ organization

Fabien Bertillot et al. Commun Biol. .

Abstract

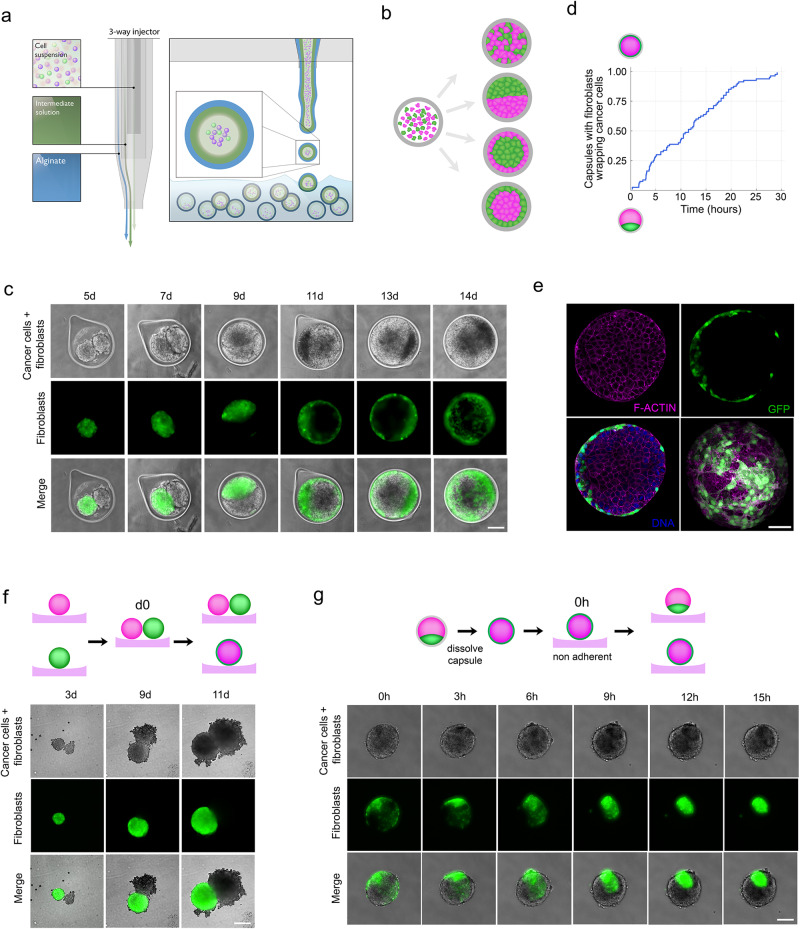
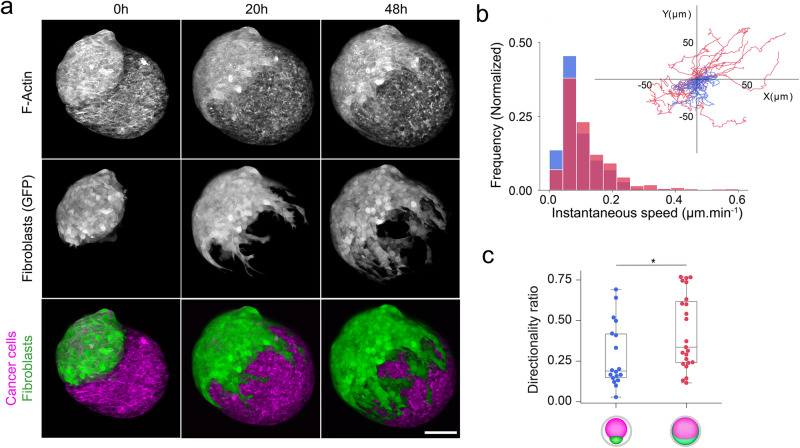
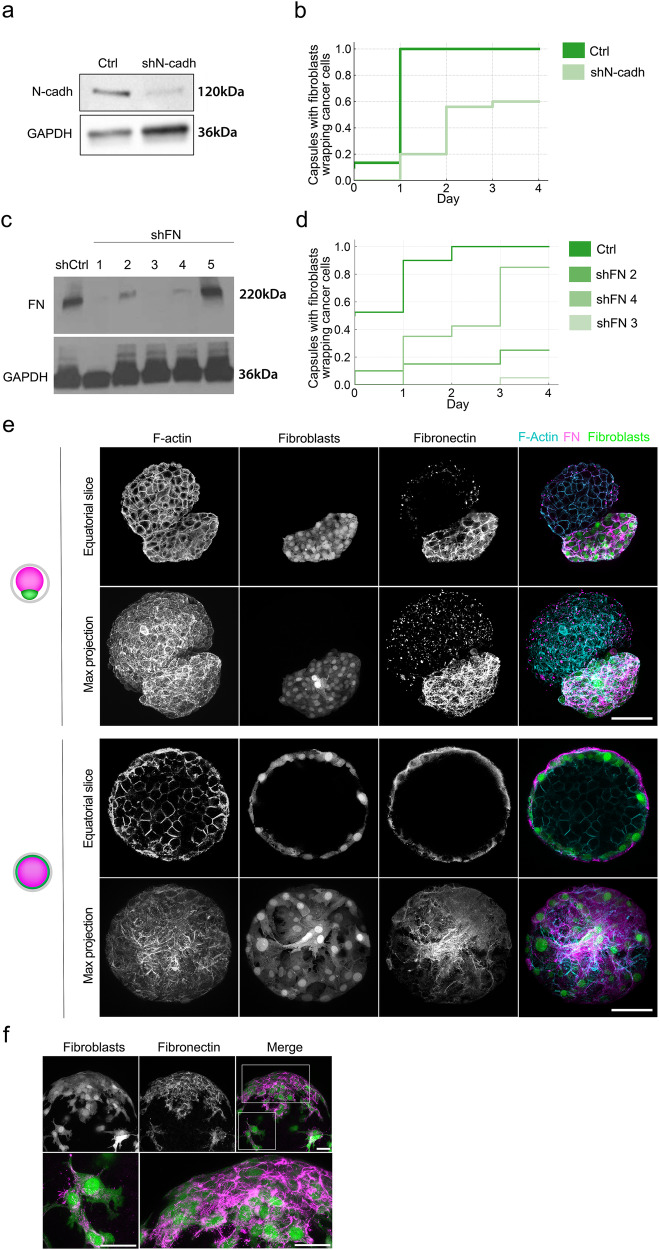
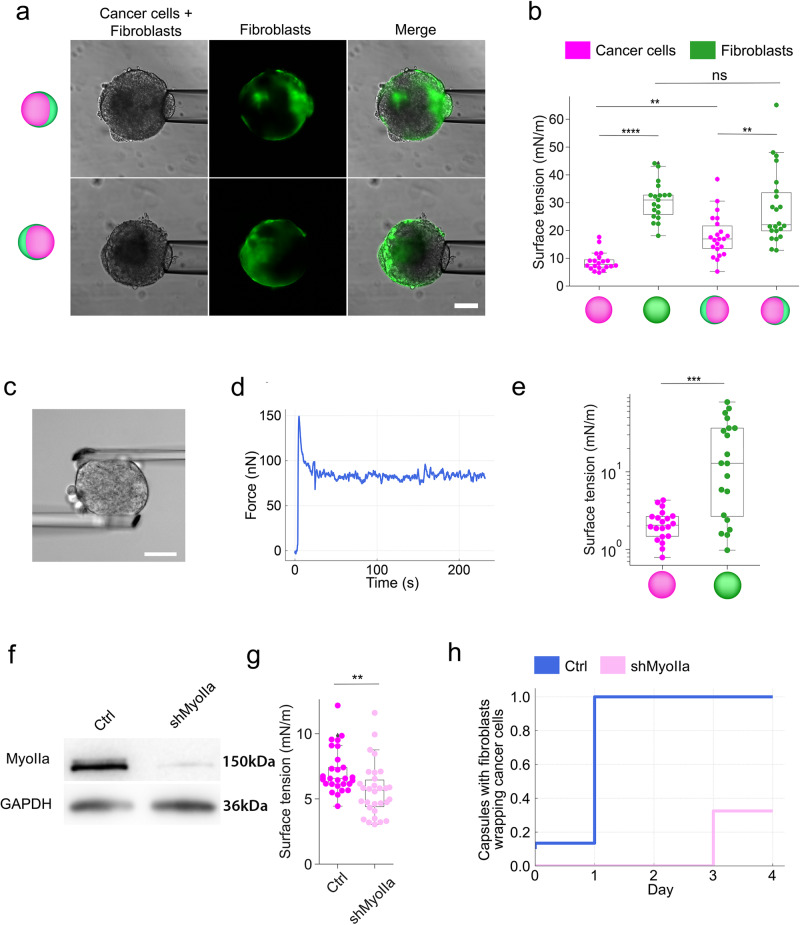
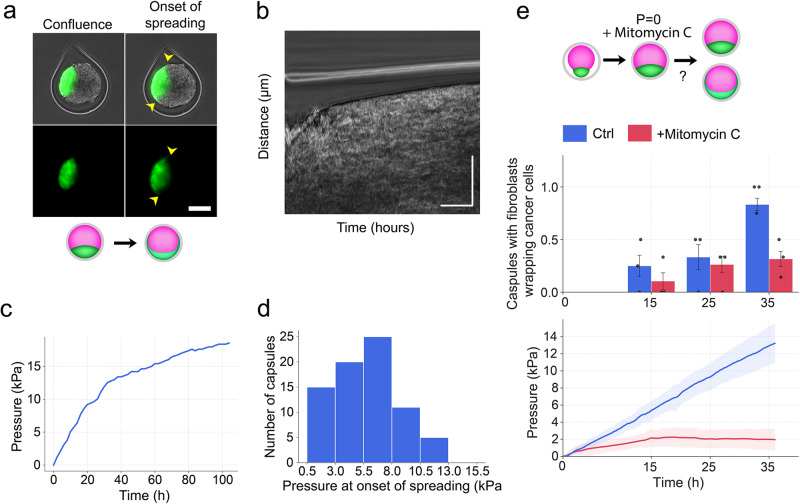
At the early stage of tumor progression, fibroblasts are located at the outer edges of the tumor, forming an encasing layer around it. In this work, we have developed a 3D in vitro model where fibroblasts' layout resembles the structure seen in carcinoma in situ. We use a microfluidic encapsulation technology to co-culture fibroblasts and cancer cells within hollow, permeable, and elastic alginate shells. We find that in the absence of spatial constraint, fibroblasts and cancer cells do not mix but segregate into distinct aggregates composed of individual cell types. However, upon confinement, fibroblasts enwrap cancer cell spheroid. Using a combination of biophysical methods and live imaging, we find that buildup of compressive stress is required to induce fibroblasts spreading over the aggregates of tumor cells. We propose that compressive stress generated by the tumor growth might be a mechanism that prompts fibroblasts to form a capsule around the tumor.


Conflict of interest statement

The authors declare no competing interests.

Figures

Fig. 1
Fig. 1. Fibroblasts envelop cancer cells under confinement.
a Schematic representation of the encapsulation. Cells are encapsulated into hollow alginate spheres using a three-way injector consisting of the outermost phase containing alginate, the intermediate phase containing sorbitol and the innermost phase containing cells. Gelation of alginate occurs upon the fall of droplets into the gelation bath containing calcium chloride hexahydrate. Capsules were then filtered and transferred to the appropriate culture medium within less than 5 min. b Schematic representation of possible outcomes after encapsulation of cancer cells and fibroblasts as single cells into alginate capsules. c Evolution of co-culture of HT29 cancer cells and GFP expressing NIH3T3 fibroblasts over time in alginate capsules. Time t = 0 corresponds to the encapsulation of cells. Time represented in days, d First row: Phase contrast image showing cancer cell and fibroblast spheroids; second row: epifluorescent image of fibroblasts expressing GFP (green); last row: Merge. Scale bar, 100 μm. d Percentage of capsules in which fibroblasts envelop spheroids of cancer cells over time. t = 0 corresponds to the confluent stage. n = 79 capsules. e Confocal image of a fixed spheroid. All cells were visualized by staining F-actin (phalloidin, red) and DNA (DAPI, blue). Fibroblasts were discriminated as cells expressing GFP (green). Left, equatorial slices. Bottom right, maximal projection. Scale bar, 50 μm. f Evolution of co-culture of HT29 cancer cells and GFP expressing NIH3T3 fibroblasts over time on agarose-coated individual wells. Time t = 0 corresponds seeding of cells. Time represented in days, d First row: Phase contrast image showing cancer cell and fibroblast spheroids; second row: epifluorescent image of fibroblasts expressing GFP (green); last row: Merge. Scale bar, 100 μm. g Evolution of cancer cells spheroids enwrapped with GFP expressing NIH3T3 fibroblasts over time after removal of alginate capsules. Time t = 0 corresponds to capsule dissolution, thus the release of the confinement. Time represented in hours, h Scale bar, 100 μm.
Fig. 2
Fig. 2. Confinement does not increase cell migration of fibroblasts.
a Two-photon live imaging of a co-culture of cancer cells stained by membrane die FM 4-64 (red) and fibroblasts expressing GFP (green) at the onset of confluency. Time in hours, h. Scale bar: 50 μm. b Distribution of the instantaneous speed prior (blue bars) and after confluence (red bars). Reconstituted fibroblast 2D trajectories prior to confluence (blue line) and after confluence (red line). Time step: 20 min. Typical trajectory length: 15 h. c Path persistence prior to confluence (blue) and after confluence (red). Wilcoxon rank-sum test was performed (*p < 0.05). n = 38 cells.
Fig. 3
Fig. 3. Cell–cell and cell–matrix adhesions are required for fibroblast spreading.
a Western blot showing N-cadherin expression level in Control fibroblasts (Ctrl, transfected with scrambled shRNA) and fibroblast depleted from N-cadherin (shN-cadh). GAPDH is used as a loading control. b Frequency of capsules in which fibroblasts enveloped cancer cells. Capsules contain cancer cells with control or N-cadherin-depleted fibroblasts. t = 0 corresponds to the confluent stage. n ≥ 30 capsules per condition. c. Western blot showing Fibronectin expression level in Control fibroblasts (shCtrl, transfected with scrambled shRNA) and fibroblast depleted from fibronectin (shFN) using five different shRNA probes. GAPDH is used as a loading control. d Frequency of capsules in which fibroblasts enveloped cancer cells. Capsules contain fibroblasts showing different degrees of fibronectin depletion. t = 0 corresponds to the confluent stage. n = 40 capsules. e Confocal images of co-culture at day 5, which corresponds to the early stage, before confluency (two upper rows) and 10 days, which corresponds to the final stage with fully spread fibroblasts (two bottom rows). Both cell types are labeled with phalloidin (F-actin, red), fibroblasts express GFP (green), fibronectin is labeled with antibodies (magenta). Scale bar: 100 μm. f Confocal images of co-culture at the onset of fibroblasts spreading. Fibroblasts expressed GFP (green), cancer cells are unstained, and fibronectin is labeled with antibodies (magenta). Insets, higher magnification of boxed regions. Scale bars: 20 μm.
Fig. 4
Fig. 4. The surface tension of fibroblast spheroid is higher than cancer cells.
a Measurement of surface tension using the micropipette aspiration assay. First row: Phase contrast and epifluorescent image showing micropipette aspiration of HT29 cancer cell side; second row: Phase contrast and epifluorescent image showing micropipette aspiration of GFP expressing NIH3T3 fibroblasts side. Scale bar, 50 μm. b Individual (dots) surface tension measurements on cancer cell spheroids (red) and fibroblast spheroids (green) growing without confinement and co-cultures after the onset of fibroblast spreading. N = 3 runs of encapsulation, n = 82 capsules. One-way ANOVA test was performed (***p < 0.001). Three independent experiments were performed. n = 82 capsules. c Measurement of a spheroid using microplates assay. Scale bars: 25 μm. d Evolution of force as a function of time in a microplate assay. e Individual (dots) surface tension measurements on cancer cell spheroids (red) and fibroblast spheroids (green) growing without confinement. One-way ANOVA test (***p < 0.001). n = 40 spheroids from three independent experiments. f Western blot showing myosin IIA expression level in control HT29 cancer cells (Ctrl, transfected with scrambled shRNA) and myosin II-depleted cancer cells (shMyosinIIa). GAPDH is used as a loading control. g Individual (dots) surface tension measurements on cancer cell spheroids made of control and myosin IIa-depleted cancer cells growing without confinement. One-way ANOVA test was performed (**p < 0.01). Three independent experiments were performed. n = 59 capsules, from N = 3 experiments. h Frequency of capsules in which fibroblasts enveloped cancer cells. Capsules contain fibroblasts and control or myosin IIa-depleted cancer cells. t = 0 corresponds to the confluent stage. n ≥ 40 capsules per condition.
Fig. 5
Fig. 5. The buildup of pressure triggers fibroblasts spreading.
a Images representing the onset of confluence and onset of spreading. The yellow arrowhead represents the early onset of spreading. b Phase-contrast intensity plot as a function of time and radial distance from the two spheroids center. Scale bars, 20 h and 50 μm. c Pressure evolution over time, starting from confluence (t = 0). d Frequency of capsules with specified pressure at the onset of fibroblast spreading. n = 79 capsules. e Lower graph, the volume of the capsule normalized to the volume at the onset of confluence as a function of time for control (blue line) and cells treated with mitomycin C (red line). Gray shadow: standard deviation. Time t = 0 corresponds to confluence. (Upper graph) Frequency of capsules in which fibroblasts started to envelop cancer cells at different time points (T1 = 15 h, T2 = 25 h, and T3 = 35 h) for control (blue bars) and mitomycin C-treated co-cultures (red bars). n = 31 capsules from N = 3 independent experiments. Values are mean ± standard error.

Similar articles

Cited by

References

    1. Kalluri R. The biology and function of fibroblasts in cancer. Nat. Rev. Cancer. 2016;16:582–598. doi: 10.1038/nrc.2016.73. - DOI - PubMed
    1. Sahai E, et al. A framework for advancing our understanding of cancer-associated fibroblasts. Nat. Rev. Cancer. 2020;20:174–186. doi: 10.1038/s41568-019-0238-1. - DOI - PMC - PubMed
    1. Labernadie A, et al. A mechanically active heterotypic E-cadherin/N-cadherin adhesion enables fibroblasts to drive cancer cell invasion. Nat. Cell Biol. 2017;19:224–237. doi: 10.1038/ncb3478. - DOI - PMC - PubMed
    1. Attieh Y, et al. Cancer-associated fibroblasts lead tumor invasion through integrin-beta 3-dependent fibronectin assembly. J. Cell Biol. 2017;216:3509–3520. doi: 10.1083/jcb.201702033. - DOI - PMC - PubMed
    1. Glentis A, et al. Cancer-associated fibroblasts induce metalloprotease-independent cancer cell invasion of the basement membrane. Nat. Commun. 2017;8:13. doi: 10.1038/s41467-017-00985-8. - DOI - PMC - PubMed

Publication types