. 2024 May;43(10):1919-1946.
doi: 10.1038/s44318-024-00046-z. Epub 2024 Feb 15.

Shared and distinct mechanisms of UBA1 inactivation across different diseases

Affiliations

Shared and distinct mechanisms of UBA1 inactivation across different diseases

Jason C Collins et al. EMBO J. 2024 May.

Abstract

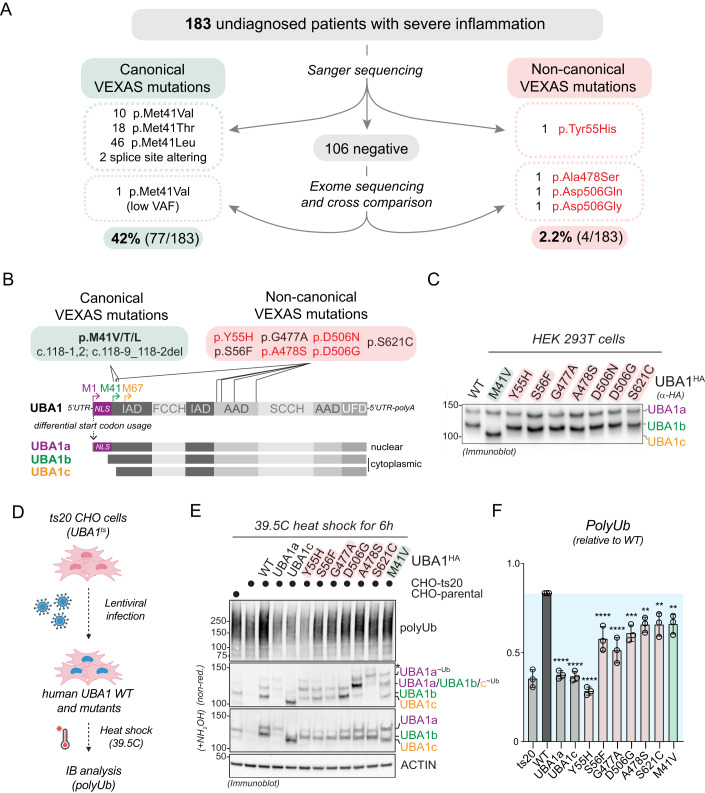
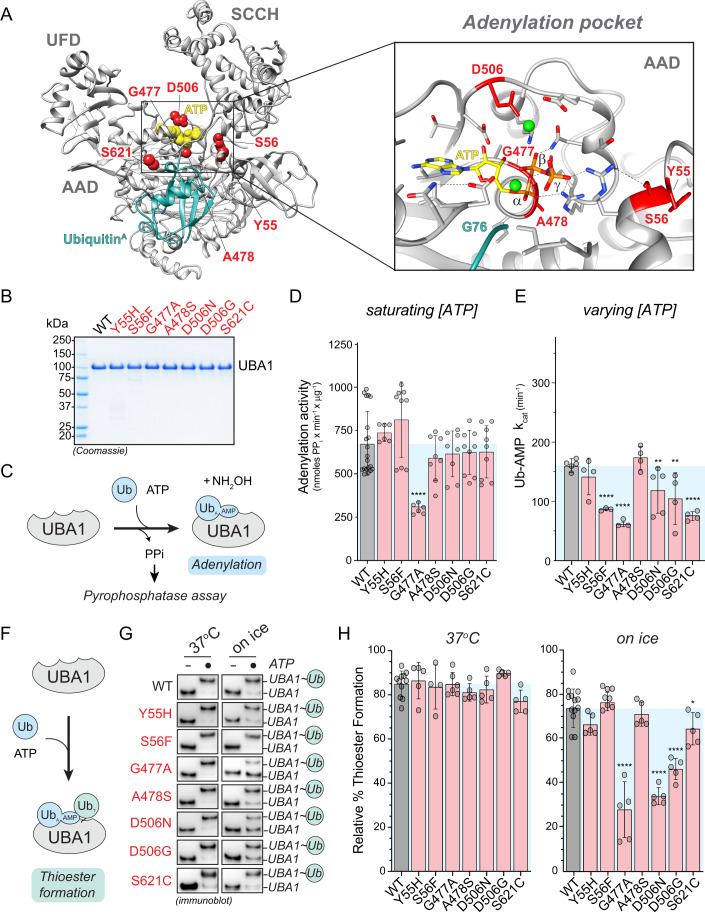
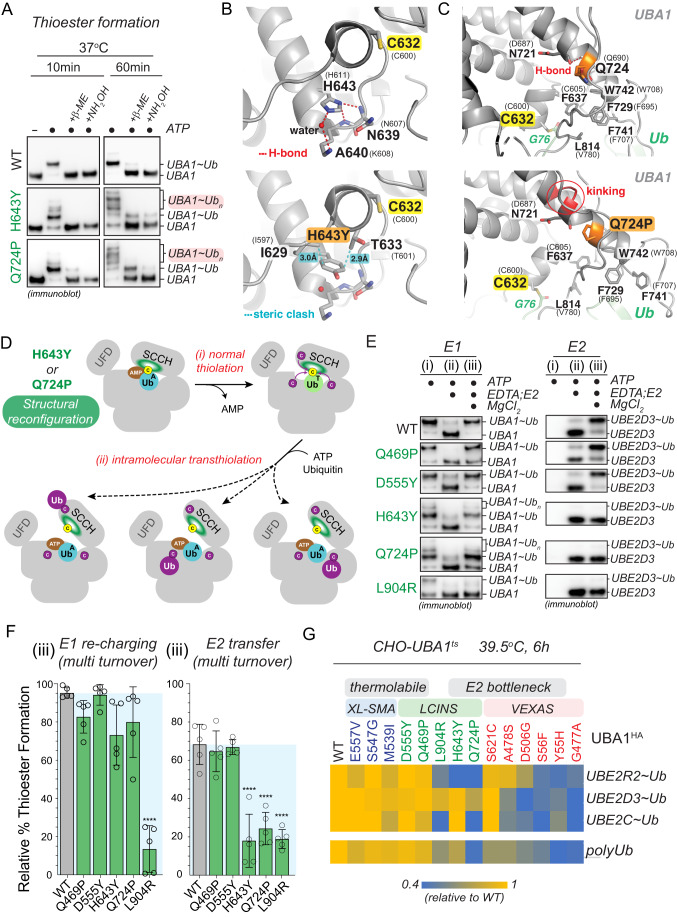
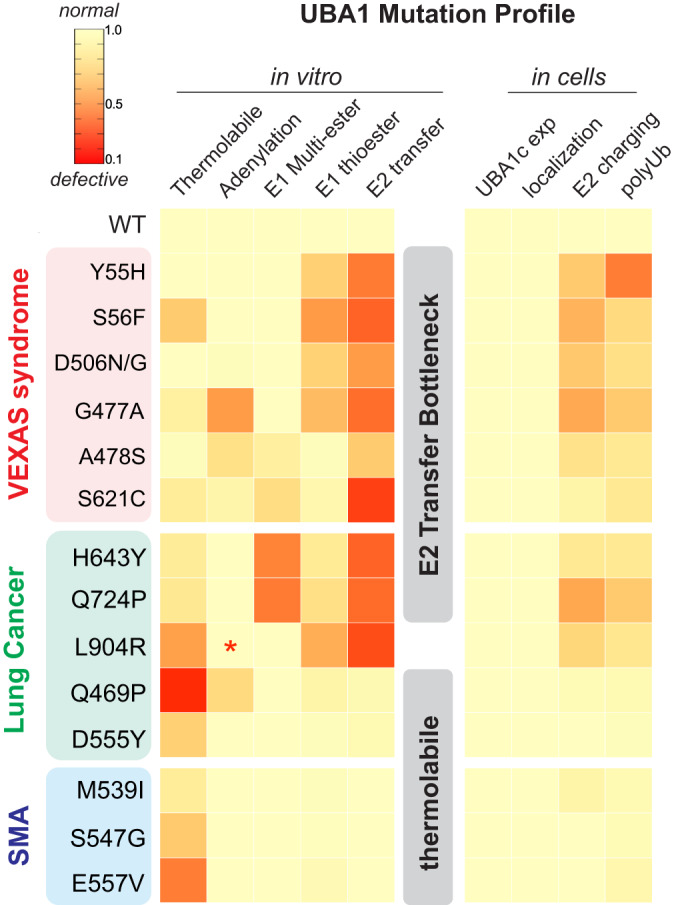
Most cellular ubiquitin signaling is initiated by UBA1, which activates and transfers ubiquitin to tens of E2 enzymes. Clonally acquired UBA1 missense mutations cause an inflammatory-hematologic overlap disease called VEXAS (vacuoles, E1, X-linked, autoinflammatory, somatic) syndrome. Despite extensive clinical investigation into this lethal disease, little is known about the underlying molecular mechanisms. Here, by dissecting VEXAS-causing UBA1 mutations, we discovered that p.Met41 mutations alter cytoplasmic isoform expression, whereas other mutations reduce catalytic activity of nuclear and cytoplasmic isoforms by diverse mechanisms, including aberrant oxyester formation. Strikingly, non-p.Met41 mutations most prominently affect transthioesterification, revealing ubiquitin transfer to cytoplasmic E2 enzymes as a shared property of pathogenesis amongst different VEXAS syndrome genotypes. A similar E2 charging bottleneck exists in some lung cancer-associated UBA1 mutations, but not in spinal muscular atrophy-causing UBA1 mutations, which instead, render UBA1 thermolabile. Collectively, our results highlight the precision of conformational changes required for faithful ubiquitin transfer, define distinct and shared mechanisms of UBA1 inactivation in diverse diseases, and suggest that specific E1-E2 modules control different aspects of tissue differentiation and maintenance.

Keywords: Lung Cancer in Never Smokers (LCINS); Spinal Muscular Atrophy (SMA); UBA1; Ubiquitin; VEXAS Syndrome.


Conflict of interest statement

The authors declare no competing interests.

Figures

Figure 1
Figure 1. Identification of novel somatic UBA1 mutations that cause VEXAS syndrome by a non-canonical mechanism.
(A) Systematic analyses of UBA1 in a cohort of undiagnosed inflammatory patients identified canonical VEXAS mutations in 42% (77/183) of patients and non-canonical VEXAS mutations (not affecting p.Met41) in 2.2% (4/183) of patients. (B) Schematic overview of UBA1 mRNA and protein isoforms that are produced through alternative start codon usage. Canonical VEXAS mutations (green box) reduce the translation of the cytoplasmic isoform UBA1b (initiated from p.M41, highlighted in green) and result in expression of a shorter, catalytically impaired isoform UBA1c (initiated from p.M67, highlighted in orange). Non-canonical VEXAS mutations identified previously (in red box) or in this study (highlighted in red) do not affect p.M41 and are positioned in the inactive adenylation domain (IAD) or active adenylation domain (AAD). (C) Non-canonical VEXAS mutations do not lead to the cytoplasmic isoform swap from UBA1b to UBA1c, as evidenced by immunoblotting of HEK293T cell lysates transfected with the indicated UBA1 variants. (D) Workflow of a cellular assays to test for a functional impact of UBA1 variants in cells. Chinese hamster ovary (CHO) cells carrying a temperature sensitive UBA1 allele are lentivirally transfected with indicated UBA1 variants, incubated at the restrictive temperature, and lysates are analyzed by immunoblotting. (E) Immunoblots of CHO cells treated according to the flow diagram in panel (D), revealing that similar to the canonical VEXAS mutation p.M41V, non-canonical VEXAS mutations are impaired in their ability to support ubiquitylation in CHO cells, thus suggesting that they compromise the catalytic activity of UBA1. * = UBA1 ubiquitin oxyesters as demonstrated in Fig. 3. (F) Quantification of global polyubiquitylation levels shown in panel (E). n = 3 biological replicates, mean −/+ s.d., **p < 0.01, ***p < 0.001, ****p < 0.0001, one-way ANOVA. Source data are available online for this figure.
Figure 2
Figure 2. Non-canonical VEXAS mutations cluster around UBA1’s ATP-binding site and a subset causes small reductions in ubiquitin adenylation and thiolation.
(A) Structure of human UBA1 (gray) with ubiquitin (cyan) at the adenylation site (PDB: 6DC6) highlighting where non-canonical VEXAS mutations occur (red). An expansion of the adenylation pocket is included (right). ATP (yellow spheres (left) or stick view (right)) was modeled into the structure using an S. pombe UBA1-Ub/ATP•Mg structure (PDB:4II3). Residues substituted by non-canonical VEXAS mutations are highlighted in red (spheres (left) or stick view (right)), revealing that they cluster around the adenylation site and participate in orienting ATP and Mg+2 (green spheres) in the catalytic pocket. To clearly visualize the ATP binding pocket in the expanded view, the cross over loop containing the S621 is not shown. All stick representations: carbon (gray), oxygen (red), nitrogen (blue), and phosphorus (orange). (B) Coomassie gel of WT UBA1bHis and indicated non-canonical VEXAS mutants (red) recombinantly expressed and purified from E. coli, revealing high purity. (C) Schematic overview of the in vitro pyrophosphatase assay used to determine the efficiency of the adenylation reaction of UBA1. (D) Only UBA1 p.G477A, but no other non-canonical VEXAS variant significantly affects adenylation activity in vitro at saturating ATP and ubiquitin conditions. n = 2–3 biological replicates with 3 technical replicates each, mean −/+ s.d., ****p < 0.0001, one-way ANOVA. (E) Michaelis-Menten kinetics for ATP usage showed ~2-fold deficiency in forming the Ub-AMP in UBA1 p.S56F, p.G477A, and p.S621C. The rate of Ub-AMP formation (kcat) was calculated for n = 3–5 biological as indicated, mean −/+ s.d., **p < 0.01, ****p < 0.0001, one-way ANOVA. (F) Schematic overview of the UBA1 thioester formation assay. (G) Non-reducing immunoblot analysis of in vitro ubiquitin thioester formation reactions carried out at 37 °C (left panel) or on ice (right panel). Reactions on ice reveal defects for UBA1 p.G477A, p.D506N, p.D506G. (H) Quantification of thioester formation percentage (UBA1~Ub/total UBA1 signal) of the experiments shown in panel (G). n = 5–10 biological replicates, mean −/+ s.d., *p < 0.05, ****p < 0.0001, one-way ANOVA. Source data are available online for this figure.
Figure 3
Figure 3. UBA1 p.S621C and p.A478S form aberrant oxyesters by distinct mechanisms.
(A) UBA1 p.S621C and p.A478S form aberrant ubiquitin conjugates in cells that are reducible by NH2OH but not β-ME, indicative of oxyesters. Indicated UBA1HA variants (canonical VEXAS mutation M41 in green, non-canonical VEXAS mutations in red) were expressed in HEK293 T cells and lysates were either not treated (non-reducing, NR) or treated with indicated reducing agents and subjected to anti-HA immunoblotting. Aberrant UBA1 species are highlighted by a red box. (B) UBA1 p.S621C- and p.A478S-dependent oxyester formation requires the catalytic cysteine residue C632 (yellow). Indicated UBA1bHA variants were expressed in HEK293T cells and lysates were either not treated (non-reducing, NR) or treated with indicated reducing agents and subjected to anti-HA immunoblotting. Additional UBA1 species are highlighted by a red box. (C) UBA1 p.S621C, but not UBA1 p.A478S, forms aberrant ubiquitin conjugates in vitro. Indicated recombinant UBA1b proteins (500 nM) were incubated with 10 μM ubiquitin and 5 mM ATP for 10 min at 37 °C followed by anti-UBA1 immunoblot analysis. Additional UBA1 species are highlighted by a red box. (D) Crystal structure of S. cerevisiae UBA1 (gray) bound to Ub-AMP (UbA, PDB: 4NNJ) was modeled with the p.A478S mutation (S. cerevisiae p.A444S), showing that the introduced hydroxyl-group is in optimal position to attack the phospho-anhydride bond of the ubiquitin adenylate (cyan). Human numbering is displayed in bold with S. cerevisiae in parentheses. All stick representations: carbon (gray), oxygen (red), nitrogen (blue), and phosphorus (orange). (E) UBA1 p.A478S forms an oxyester at the mutation site. C-terminally FLAG tagged UBA1 p.A478S was expressed in HEK293T cells, followed by anti-FLAG immunoprecipitation and mass spectrometry analysis. The ubiquitylated residue is colored in orange and labeled with a diGly remnant (GG). Detected b and y ions for the oxyester-containing peptide are highlighted in red and dark blue, respectively. (F) UBA1 p.A478C does not support formation of aberrant ubiquitin conjugates in cells. Indicated UBA1HA variants were expressed in HEK293T cells and lysates were either not treated (non-reducing, NR) or treated with indicated reducing agents and subjected to anti-HA immunoblotting. (G) UBA1 p.A478S forms oxyesters in vitro in the presence of an E2 enzyme. (i) 500 nM UBA1b WT or p.A478S were incubated with 10 μM ubiquitin and 5 mM ATP, followed by (ii) addition of 100 mM EDTA and 2 μM E2 enzyme (UBE2D3). Reactions were either not treated (non-reducing, NR) or treated with indicated reducing agents and subjected to anti-UBA1 immunoblotting. (H) Model of how UBA1 p.A478S forms oxyesters. Recruitment of an E2 enzyme to a doubly loaded UBA1 complex reduces intramolecular movements in the domains of UBA1 that bind the ubiquitin in the adenylation site (UbA), thereby promoting the attack of the phospho-anhydride bond of the ubiquitin adenylate by the hydroxyl-group of A478S. Catalytic cysteines of UBA1 and the E2 are highlighted in yellow. Source data are available online for this figure.
Figure 4
Figure 4. UBA1 S621C forms an oxyester at S619 via a thioester intermediate.
(A) Structure of human UBA1 (gray) with ubiquitin (cyan) at the adenylation site (PDB: 6DC6) highlighting S621 (red spheres) and its location in the cross-over loop (magenta). ATP (stick representation with carbon, oxygen, nitrogen, and phosphorus in gray, red, indigo, and orange) was modeled as described for Fig. 2A. An expanded view to the right illustrates that S621 is in the vicinity of the catalytic residue C632 (highlighted in yellow spheres) and in close proximity to four serine residues (shown as sticks with oxygen in red). (B) UBA1 p.S621C forms an oxyester at S619 (highlighted in orange). C-terminally FLAG tagged UBA1 p.S621C was expressed in HEK293T cells, followed by anti-FLAG immunoprecipitation and mass spectrometry analysis. The ubiquitylated residue is colored in orange and labeled with a diGly remnant (GG). Detected b and y ions for the oxyester-containing peptide are highlighted in red and dark blue, respectively. (C) UBA1 p.S621C forms an oxyester at S619 but not at any other nearby serine residue. Indicated UBA1HA variants were expressed in HEK293T cells and lysates were either not treated (non-reducing, NR) or treated with indicated reducing agents and subjected to anti-HA immunoblotting. Additional UBA1 species are highlighted by a red box. (D) Ribbon diagram of the serine-rich region surrounding UBA1 p.S621C following 100 ns of molecular dynamics. The simulation was performed using a yeast UBA1 structure (PDB: 4NNJ) with cysteine substitution of S589 (corresponding to human S621). For consistency, we refer to the corresponding human residues and indicate yeast residues in parentheses. Interactions highlighted with dashed lines are color coded for panels (E) and (F). Sidechain heavy atoms are displayed in gray, red, or yellow for carbon, oxygen and sulfur respectively. Double red sticks indicate carbonyl oxygen atoms. (E) Distance (Å) over time (ns) between serine sidechain hydroxyl hydrogen atoms and the nearest sidechain oxygen of D585 or E616 as indicated and displayed in panel (D). Overlayed with the displayed measurements is a moving window average of 100 ps (solid line). S617 is >4 Å from D585 (black) and >6 Å (blue) from E616. S619 has a stable hydrogen bonding interaction (<1.6 Å) with D585 (orange) and is stable during most of the simulation. S620 forms a transiently stable hydrogen bonding interaction with E616 (purple) fluctuating from 1.6 Å to approximately 3 Å. (F) A plot of the average distance between a serine and one of the two catalytic bases from a 100 ns molecular dynamics simulation. Interactions between S617 with D585 (black) or E616 (blue) are >4 Å, while interactions between S619 with D585 (orange) and S620 with E616 (purple) have an average distance of approximately 3 Å, allowing for a proton transfer to occur. n = 10001 frames across the trajectory, error bars = s.d. (G) Calculated pKa values of the D585 and E616 catalytic base and S617, S619, S620, and S628 sidechain oxygen atoms and of the S621C and the catalytic cysteine C632 sulfur atoms. The pKa values were also calculated for a structure in which a D585 and E616 sidechain oxygen atom were protonated (D585-H/E616-H). D585, but not E616, has an increased calculated pKa with a value of 6.38 ± 0.25, which is amenable for its activity as a base at physiological pH. All serines in proximity to D585 and E619 display reduced pKa values, with S617 and S619 close to physiological pH, making them candidates for deprotonation by D585. When D585 and E619 are protonated, the pKa values of the serines return to their expected value of approximately 13, suggesting D585 and E619 are driving their changes in the pKa values. (H) Proposed mechanism of oxyester formation for the UBA1 p.S621C variant. Source data are available online for this figure.
Figure 5
Figure 5. Most non-canonical VEXAS mutations exhibit a bottleneck in ubiquitin transfer to E2 enzymes.
(A) Schematic overview of the sequential, three-phase in vitro assay used to measure UBA1 transthiolation. (i) Charging of UBA1 by incubation of 250 nM UBA1b with 10 μM ubiquitin and 5 mM ATP (ii) Quenching of UBA1 charging and single transfer to E2 enzyme by addition of 100 mM EDTA and 1 μM UBE2D3 (iii) Reactivation of UBA1 charging and multi-transfer to E2 enzyme by addition of 100 mM MgCl2. (B) Non-canonical VEXAS mutations (red) are impaired in E2 transthiolation in vitro. Immunoblot analysis of the sequential, three-phase in vitro assay described in panel (A) using antibodies against UBA1 (left panel) or UBE2D3 (right panel). (C) Non-canonical VEXAS mutations (red) are impaired in E2 transthiolation in vitro, as revealed by quantifications of relative E2 thioester levels (UBE2D3~Ub/total signal) of multi-turnover reactions (phase iii) depicted in panel (B). n = 5–7 biological replicates as indicated, mean −/+ s.d., ****p < 0.0001, one-way ANOVA. (D) Some non-canonical VEXAS mutations exhibit ~2-fold defects in UBA1 re-charging, as revealed by quantifications of relative UBA1 thioester levels (UBA1~Ub/total signal) of multi-turnover reactions (phase iii) depicted in panel (B). n = 5–7 biological replicates as indicated, mean −/+ s.d., ***p < 0.001, ****p < 0.0001, one-way ANOVA. (E) Non-canonical VEXAS mutations most strongly affect the E2 transthiolation step in vitro, as revealed by quantification of the relative E2 transthiolation over the relative UBA1 re-charging defects of multi-turnover reactions (phase iii) depicted in panel (B). n = 5–7 biological replicates as indicated, mean −/+ s.d., *p < 0.05, **p < 0.01, ***p < 0.001, ****p < 0.0001, one-way ANOVA. (F) Non-canonical VEXAS mutations (red) are defective in charging different classes of E2s in vitro. Heatmap depicting the relative log2-fold changes in E2 ubiquitin thioester formation measured by multi-turnover reactions (phase iii) using FITC-labeled ubiquitin (for details refer to Fig. EV4A–C). For quantifications, E2 ubiquitin thioester levels in phase (iii) were first normalized to the total FITC signal in phase (i) and then normalized to WT. n = 3 biological replicates per condition. (G) CHO cells with UBA1a, UBA1c, or non-canonical VEXAS mutants (red) as sole source of UBA1 generally exhibit lower ubiquitin thioester levels for select E2 enzymes as compared to CHO cells with WT UBA1. CHO rescue assays were performed as described in Fig. 1D, followed by anti-E2 immunoblotting. Heatmap depicts the relative log2-fold changes in ubiquitin thioester levels of UBE2C, UBE2D3, and UBE2R2. n = 3 biological replicates per condition. (H) CHO cells with the p.S621C mutant as sole source of UBA1 exhibit lower ubiquitin thioester levels for UBE2S and UBE2L3 as compared to CHO cells with WT UBA1. CHO rescue assays were performed as described in Fig. 1D, followed by anti-UBE2L3 and anti-UBE2S-immunoblotting and quantification. n = 3 biological replicates per condition. (I) Schematic representation of our in vitro findings, revealing that non-canonical VEXAS mutations inactivate UBA1 by most prominently affecting ubiquitin transfer to E2 enzymes. Source data are available online for this figure.
Figure 6
Figure 6. SMA-associated UBA1 mutations and a subset of never smoker lung cancer mutations render UBA1 activity thermolabile.
(A) Schematic overview of UBA1 domains highlighting the location of mutations causing canonical and non-canonical VEXAS syndrome (red), causing spinal muscular atrophy (SMA, blue), or implicated in lung cancer in never smokers (LCINS, green). (B) Structural mapping of the position of the different disease-associated UBA1 amino acid substitutions using the crystal structure of human UBA1 (gray) with ubiquitin (cyan) in the adenylation site (PDB: 6DC6) and ATP (yellow spheres) modeling as described for Fig. 2A. Non-canonical VEXAS mutations (red) are clustered around the ATP binding site. SMA mutations (blue) are also in the AAD but on the opposite side of the catalytic adenylation center. LCINS mutations (green) are structurally more dispersed and present in both the AAD and SCCH domain. (C) Overview of the experimental workflow to test for a temperature-dependent impact of mutations on UBA1 activity. UBA1 proteins were pre-incubated at varying temperatures in the absence of substrate and subsequently subjected to ubiquitin thioester formation assays on ice using 500 nM UBA1b, 10 μM ubiquitin, and 5 mM ATP. (D) UBA1 p.S56F is the only non-canonical VEXAS mutation that renders UBA1 thiolation thermolabile. Indicated UBA1 proteins were subjected to the assay described in panel (C) followed by anti-UBA1 immunoblotting. Top graph: relative UBA1 thioester levels (UBA1~Ub/total) were quantified and plotted against the pre-incubation temperatures. Compared to WT UBA1, only the p.S56F variant is more greatly reduced in activity with increasing pre-incubation temperatures. Bottom graph: Quantification of the relative percentage of UBA1~Ub thioester retained after 37 °C pre-incubation as compared to pre-incubation on ice. n = 3–9 biological replicates as indicated, mean −/+ s.d., **p < 0.01, one-way ANOVA. (E) LCINS mutations p.Q649P and p.D555Y render UBA1 thiolation thermolabile. Indicated UBA1 proteins were subjected to the assay described in panel (C) followed by anti-UBA1 immunoblotting. Top graph: relative UBA1 thioester levels (UBA1~Ub/total) were quantified and plotted against the pre-incubation temperatures. Bottom graph: Quantification of the relative percentage of UBA1~Ub thioester retained after 37 °C pre-incubation as compared to pre-incubation on ice. n = 5 biological replicates for each condition, mean −/+ s.d., ****p < 0.0001, one-way ANOVA. (F) All SMA-associated mutations render UBA1 thiolation thermolabile. Indicated UBA1 proteins were subjected to the assay described in panel (C) followed by anti-UBA1 immunoblotting. Top graph: relative UBA1 thioester levels (UBA1~Ub/total) were quantified and plotted against the pre-incubation temperatures. Bottom graph: Quantification of the relative percentage of UBA1~Ub thioester retained after 37 °C pre-incubation as compared to pre-incubation on ice. n = 5–9 biological replicates as indicated, mean −/+ s.d., *p < 0.05, ****p < 0.0001, one-way ANOVA. Source data are available online for this figure.
Figure 7
Figure 7. LCINS mutations UBA1 p.H643Y and p.Q724P form aberrant ubiquitin thioesters and exhibit an E2 transfer bottleneck.
(A) UBA1 p.H643Y and p.Q724P (green) form aberrant ubiquitin thioester species in vitro. Denoted recombinant UBA1b proteins (500 nM) were incubated with 10 μM ubiquitin and 5 mM ATP for 10 or 60 min at 37 °C. Reactions were treated with reducing agents (β−ME or NH2OH) as indicated, followed by anti-UBA1 immunoblot analysis. (B) Ribbon diagram of an expanded region of S. cerevisiae UBA1 (PDB: 4NNJ) wild-type protein (upper panel) and with H643Y substitution (lower panel). Labeling for this panel and panel (C) follows Fig. 3D. The mutation disrupts hydrogen bonds (red dashed lines) from H643 to N639 and a bound water molecule (red sphere) and forces rearrangements to prevent steric clashes between Y643 and T633/I629 (cyan dashed lines). Stick representation is used to display sidechain heavy atoms of UBA1 residue I629, C632, T633, N639, A640, and H643. In this panel and panel (C), oxygen, nitrogen, and sulfur are colored red, blue, and yellow, respectively. (C) Ribbon diagram of an expanded region of S. cerevisiae UBA1 (gray, PDB: 4NNJ) wild-type protein (upper panel) with a thioester-linked ubiquitin (light green) and the final frame of a 100 ns molecular dynamics simulation of UBA1 Q724P mutant (lower panel). A hydrogen bond (red dashed line) between the N721 backbone oxygen atom and Q724 (orange) backbone nitrogen atom is disrupted in the Q724P mutant by kinking of the helix (noted in red). The thioester bond between UBA1 C632 and ubiquitin G76, as well as the sidechain heavy atoms of UBA1 residue F637, N721, Q724, F729, F741, W742 and L814 are displayed by stick representation. (D) Model of how UBA1 p.H643Y and p.Q724P lead to the formation of aberrant UBA1 ubiquitin thioesters via intramolecular transthiolation reactions. (E) Aberrant thioester-forming (p.H643Y, p.Q724P) but not thermolabile (p.Q469P, p.D555Y) LCINS mutations (green) are impaired in E2 transthiolation in vitro. Immunoblot analysis of the sequential, three-phase in vitro assay described in panel 5A using antibodies against UBA1 (left panel) or UBE2D3 (right panel). (F) Quantifications of relative UBA1 re-charging (UBA1~Ub/total signal) and relative E2 thioester levels (UBE2D3~Ub/total signal) of multi-turnover reactions (phase iii) depicted in panel (E). UBA1 p.H643Y and p.Q724P significantly reduce transthiolation while not markedly affecting thiolation, revealing an E2 bottleneck. n = 5 biological replicates, mean −/+ s.d., ****p < 0.0001, one-way ANOVA. (G) CHO cells with E2 bottleneck but not with thermolabile disease mutants as sole source of UBA1 exhibit markedly lower ubiquitin thioester levels for select E2 enzymes and reduced polyubiquitylation as compared to CHO cells with WT UBA1. CHO rescue assays were performed as described in Fig. 1D, followed by anti-E2 and anti-ubiquitin immunoblotting. Heatmap depicts the relative log2-fold changes in polyubiquitylation or ubiquitin thioester levels of UBE2C, UBE2D3, and UBE2R2. n = 3 biological replicates per condition. Non-canonical VEXAS mutations (red), LCINS mutations (green), SMA mutations (blue). Source data are available online for this figure.
Figure 8
Figure 8. Systematic mutation profiling defines shared and distinct mechanisms of UBA1 inactivation in different human diseases.
Heatmap summarizing the findings of the of biochemical and cellular characterization of disease-associated UBA1 mutations conducted in this study. For each determined parameter, defects were normalized to WT, which was set to 1. We find that UBA1 mutations fall into two classes that (i) bottleneck at the E2 transfer step in vitro and reduce levels of E2 ubiquitin thioesters and polyubiquitylation when present as sole source of E1 in CHO cells and (ii) render UBA1 activity thermolabile in vitro and only show small cellular defects. While LCINS mutations (green) are comprised of both classes, SMA mutations (blue) are exclusively thermolabile and non-canonical VEXAS mutations (red) bottleneck at the E2 transfer step, suggesting distinct and shared molecular mechanisms of UBA1 inactivation across different disease states. * = not determined. Source data are available online for this figure.
Figure EV1
Figure EV1. Identification and clinical phenotypes of novel non-pMet41 VEXAS mutations.
(A) Sanger sequencing confirming novel variants. (B) Digital droplet PCR (ddPCR) confirmation for novel variants in P3, P4, P5. n = 3 technical replicates, error bars = s.d. (C) Conservation of protein sequence for UBA1. (D) Cytoplasmic vacuoles were seen in a subset of the proerythroblasts (Panel i, ii, iii) and promyelocytes (Panel iii, iv, v, vi) from P6. Scale bar = 20 µm. (E) Sweets syndrome in P6.
Figure EV2
Figure EV2. UBA1 p.A478S forms an aberrant oxyester at the mutation site.
(A) Annotated MS/MS spectrum of A478S peptide with (red) and without (black) diGly remnant. Insert highlights the difference of 114 Da, indicative of the diGly remnant. (B) Table summarizing the masses of fragments of the unmodified and ubiquitylated A478S peptide, pinpointing the diGly remnant (Δm/z 114.04 Da) on S478. (C) Side-by-side ribbon diagrams of UBA1 bound to ubiquitin (cyan) and ATP (indicated as a stick diagram with carbon, oxygen, nitrogen, and phosphorus in gray, red, blue, and orange) following 100 ns of molecular dynamics in the absence (left, PDB: 6DC6) or presence (right, PDB: 6NYA) of E2 enzyme (Ubc3, purple). The per residue r.m.s.f. (root mean square fluctuation) value is indicated as a red gradient (scale bar). A black dashed circle highlights the region where ubiquitin, ATP, and Mg2+ (green sphere) bind.
Figure EV3
Figure EV3. UBA1 p.S621C forms an aberrant oxyester at S619 via a thioester intermediate at S621C.
(A) Annotated MS/MS spectrum of S621C peptide with (red) and without (black) diGly remnant. Insert highlights the difference of 114 Da, indicative of the diGly remnant. (B) Table summarizing the masses of fragments of the unmodified and ubiquitylated S621C peptide, pinpointing the diGly remnant (Δm/z 114.04 Da) on S619. (C) Proposed catalytic mechanism for oxyester formation through deprotonation of S619 via the putative catalytic base D585 forming an oxyanion that promotes a nucleophilic attack of the thioester at S621C.
Figure EV4
Figure EV4. Non-canonical VEXAS mutations are deficient in transferring ubiquitin to diverse E2 enzymes in vitro and exhibit defects in cells.
(A) Schematic overview of the sequential, three-phase in vitro assay used to measure UBA1 transthiolation. (i) Complete charging of UBA1 by incubation of 250 nM UBA1b with 10 μM FITC-ubiquitin and 5 mM ATP (ii) Quenching of UBA1 charging and single transfer to E2 enzyme by addition of 100 mM EDTA and 1 μM E2 enzyme (iii) Reactivation of UBA1 charging and multi-transfer to E2 enzyme by addition of 100 mM MgCl2 (B) UBA1 WT was subjected to the experiment described in panel (A) using UBE2D3. Reactions were subjected to SDS page and analyzed by fluorescence imaging. Upper panel: Fluorescence scan showing UBA1 and UBE2D3 ubiquitin thioester levels after each reaction phase. Lower panel: UBE2D3 ubiquitin thioester levels in reaction phase (iii) were quantified and plotted against the reaction time, revealing that UBE2D3 is maximally charged after 60 min. (C) Non-canonical VEXAS mutations (red) are deficient in E2 transthiolation in vitro. Indicated UBA1 proteins were subjected to the experiment described in panel (A) using either UBE2D3, UBE2R2, or UBE2S. Reactions were subjected to SDS page and analyzed by fluorescence imaging. Upper panel: Fluorescence scan showing UBA1 charging after reaction phase (i) as control. Lower panel: Fluorescence scan showing UBA1 re-charging and E2 transfer after reaction phase (iii). Quantifications of 3 biological replicates are shown in Fig. 5F. (D) Non-canonical VEXAS mutations (red) are impaired in supporting E2 ubiquitin thioester levels in cells. CHO ts20 cells were reconstituted with indicated UBA1 variants and incubated at the permissive temperature for 6 h, followed by immunoblotting using antibodies against indicated E2 enzymes. (EG) Quantification of ubiquitin charging levels of indicated E2s (charged/total) shown in panel (D). n = 3 biological replicates, error bars = s.d., *p < 0.05, **p < 0.01, ***p < 0.001, one-way ANOVA.

Update of

References

    1. Al-Hakim A, Kulasekararaj A, Norouzi M, Medlock R, Patrick F, Cargo C, Savic S. S56F UBA1 variant is associated with haematological predominant subtype of VEXAS. Br J Haematol. 2023;203:331–335. doi: 10.1111/bjh.19021. - DOI - PubMed
    1. Balak CD, Hunter JM, Ahearn ME, Wiley D, D’Urso G, Baumbach-Reardon L. Functional characterizations of rare UBA1 variants in X-linked Spinal Muscular Atrophy. F1000Res. 2017;6:1636. doi: 10.12688/f1000research.11878.1. - DOI - PMC - PubMed
    1. Beck DB, Bodian DL, Shah V, Mirshahi UL, Kim J, Ding Y, Magaziner SJ, Strande NT, Cantor A, Haley JS, et al. Estimated prevalence and clinical manifestations of UBA1 variants associated with VEXAS syndrome in a clinical population. JAMA. 2023;329:318–324. doi: 10.1001/jama.2022.24836. - DOI - PMC - PubMed
    1. Beck DB, Ferrada MA, Sikora KA, Ombrello AK, Collins JC, Pei W, Balanda N, Ross DL, Ospina Cardona D, Wu Z, et al. Somatic mutations in UBA1 and severe adult-onset autoinflammatory disease. N Engl J Med. 2020;383:2628–2638. doi: 10.1056/NEJMoa2026834. - DOI - PMC - PubMed
    1. Beck DB, Werner A, Kastner DL, Aksentijevich I. Disorders of ubiquitylation: unchained inflammation. Nat Rev Rheumatol. 2022;18:435–447. doi: 10.1038/s41584-022-00778-4. - DOI - PMC - PubMed

MeSH terms

Substances