. 2024 Mar;43(6):956-992.
doi: 10.1038/s44318-024-00049-w. Epub 2024 Feb 15.

LET-381/FoxF and its target UNC-30/Pitx2 specify and maintain the molecular identity of C. elegans mesodermal glia that regulate motor behavior

Affiliations

LET-381/FoxF and its target UNC-30/Pitx2 specify and maintain the molecular identity of C. elegans mesodermal glia that regulate motor behavior

Nikolaos Stefanakis et al. EMBO J. 2024 Mar.

Abstract

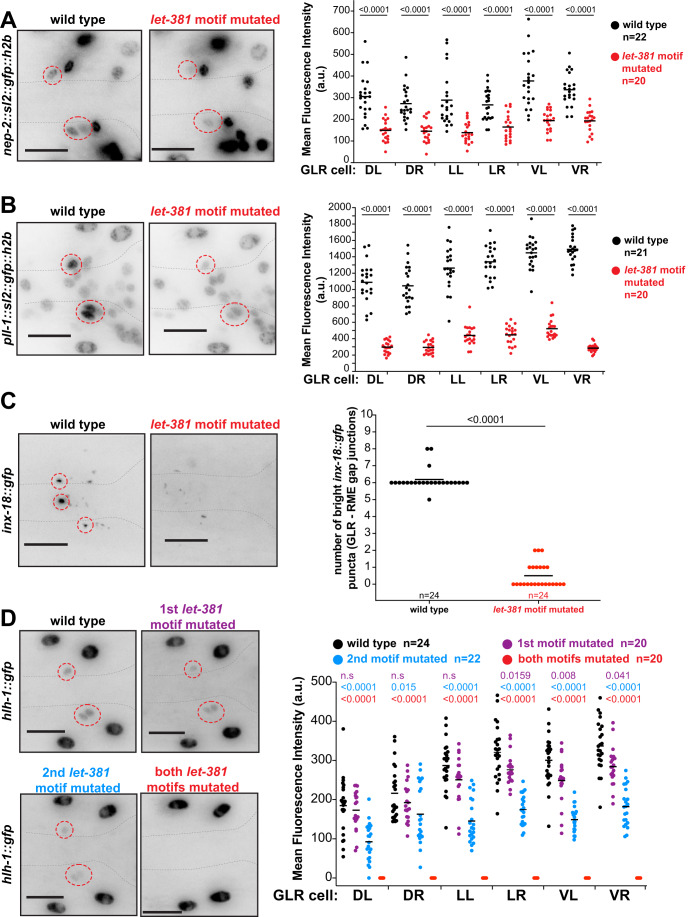
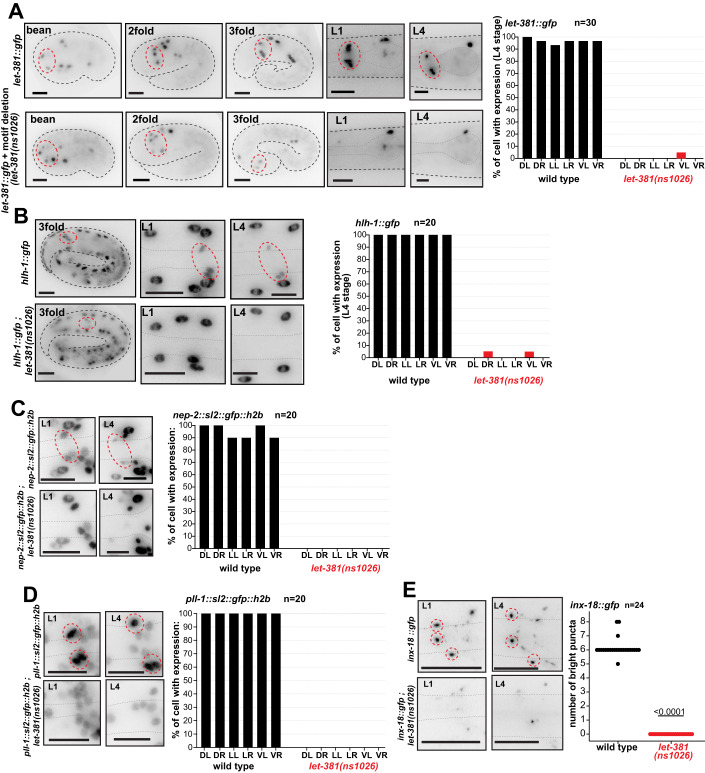
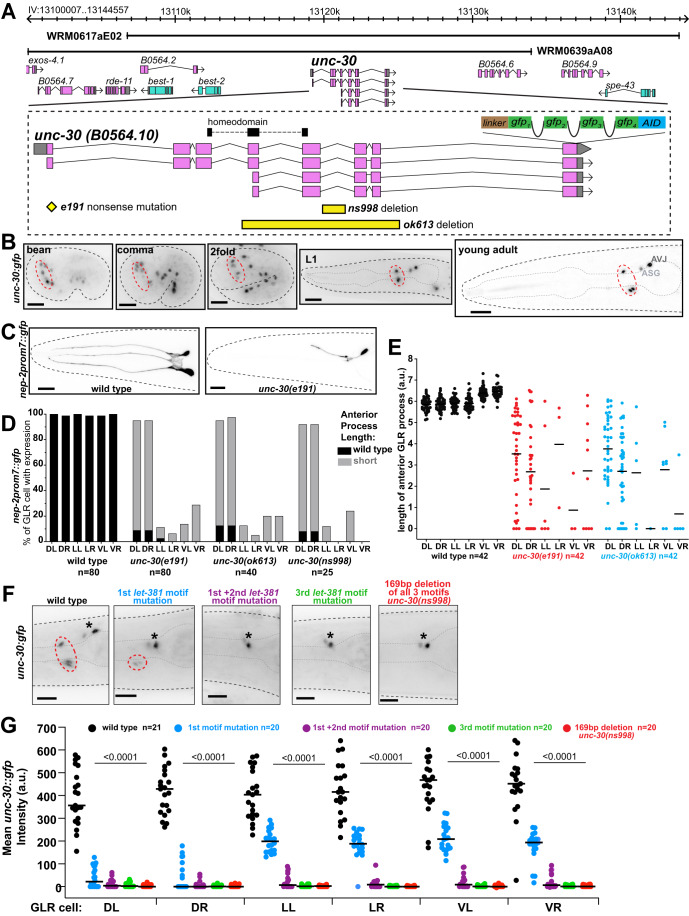
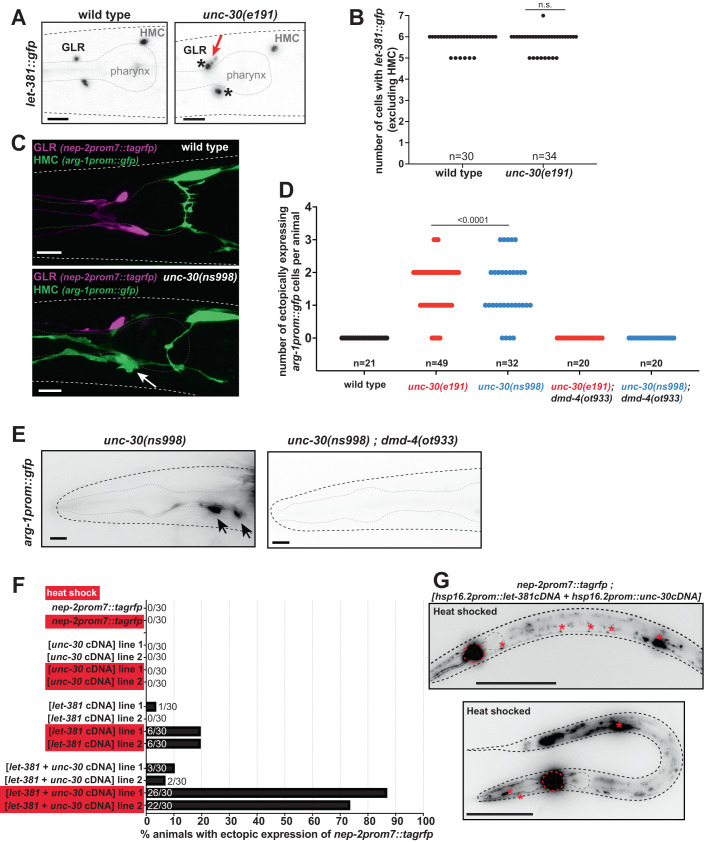
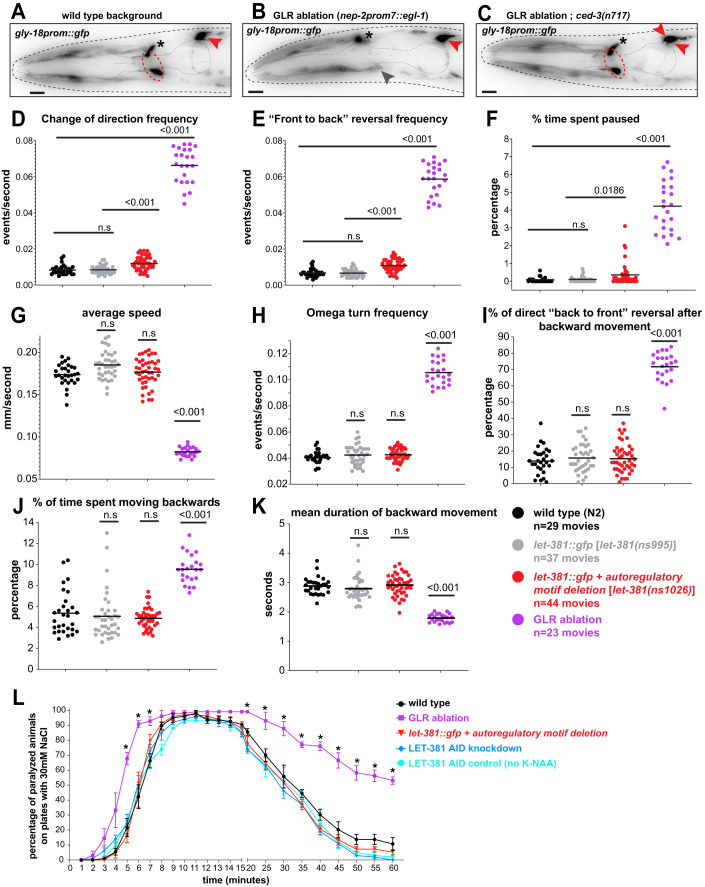
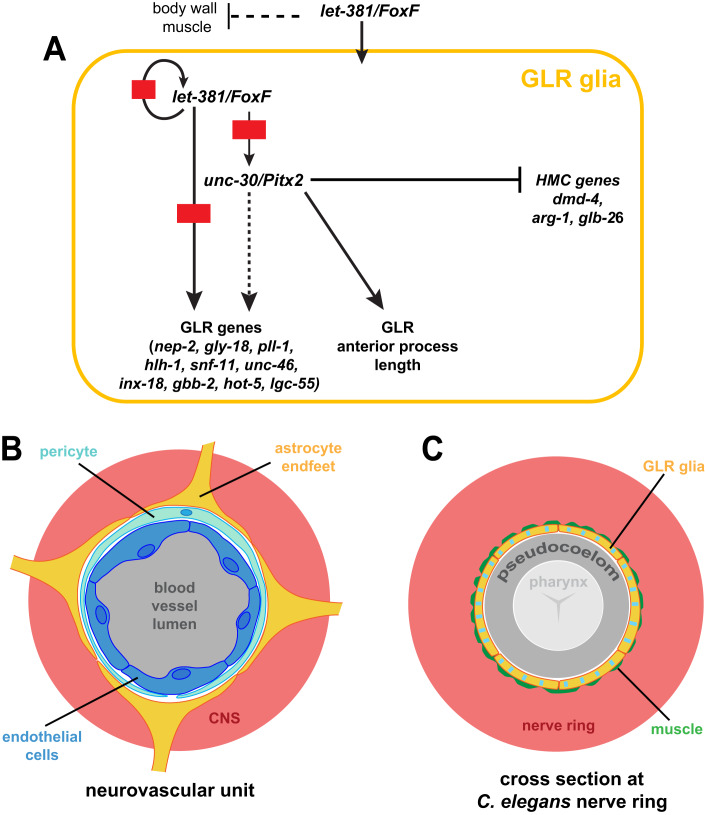
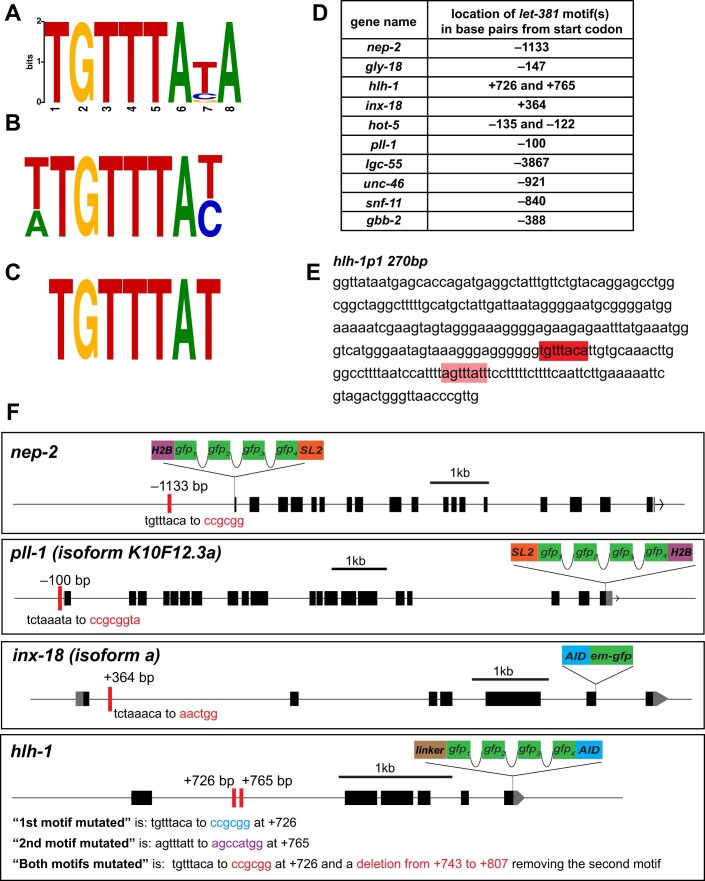
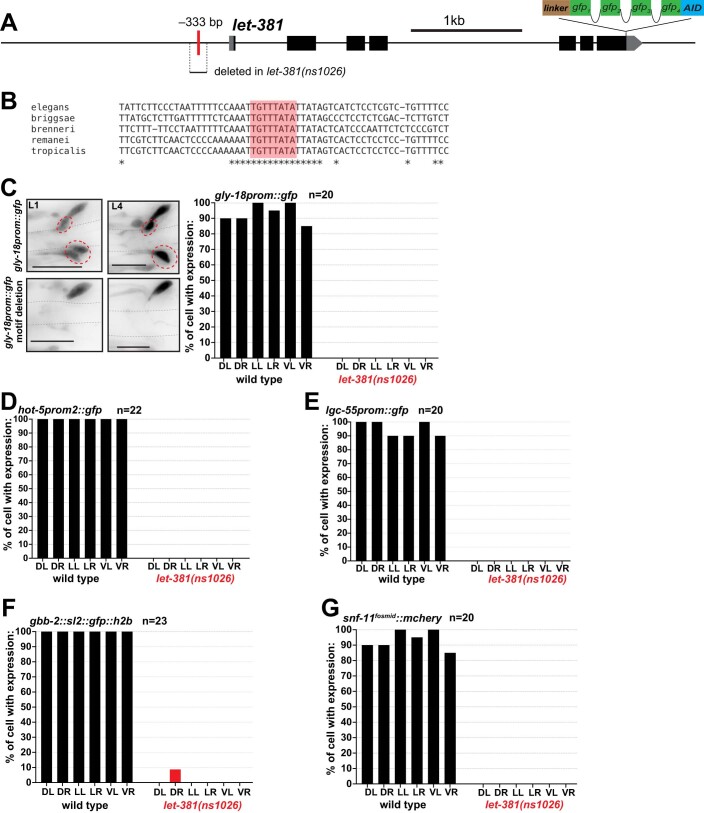
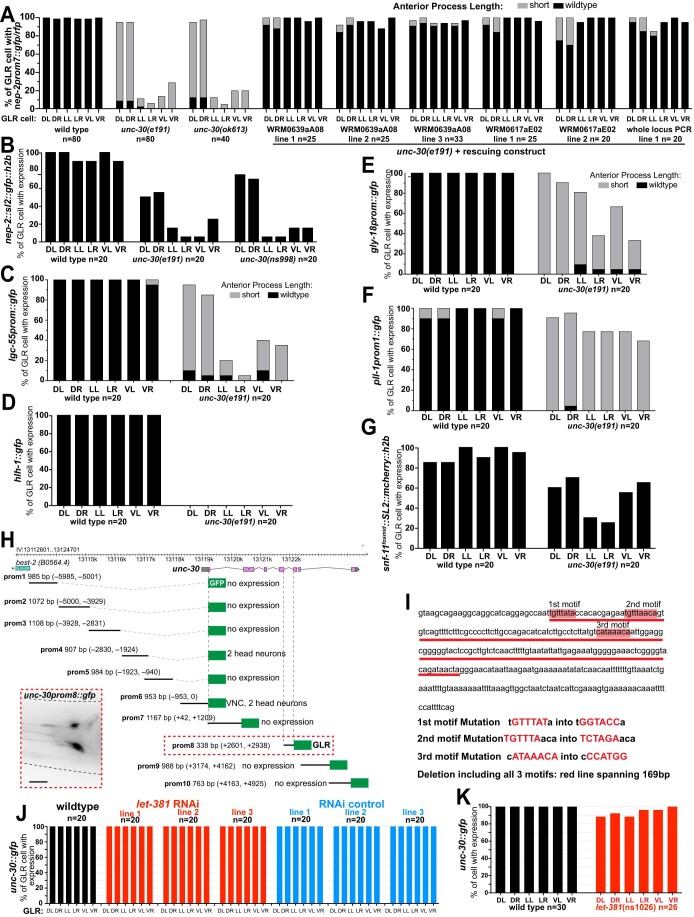
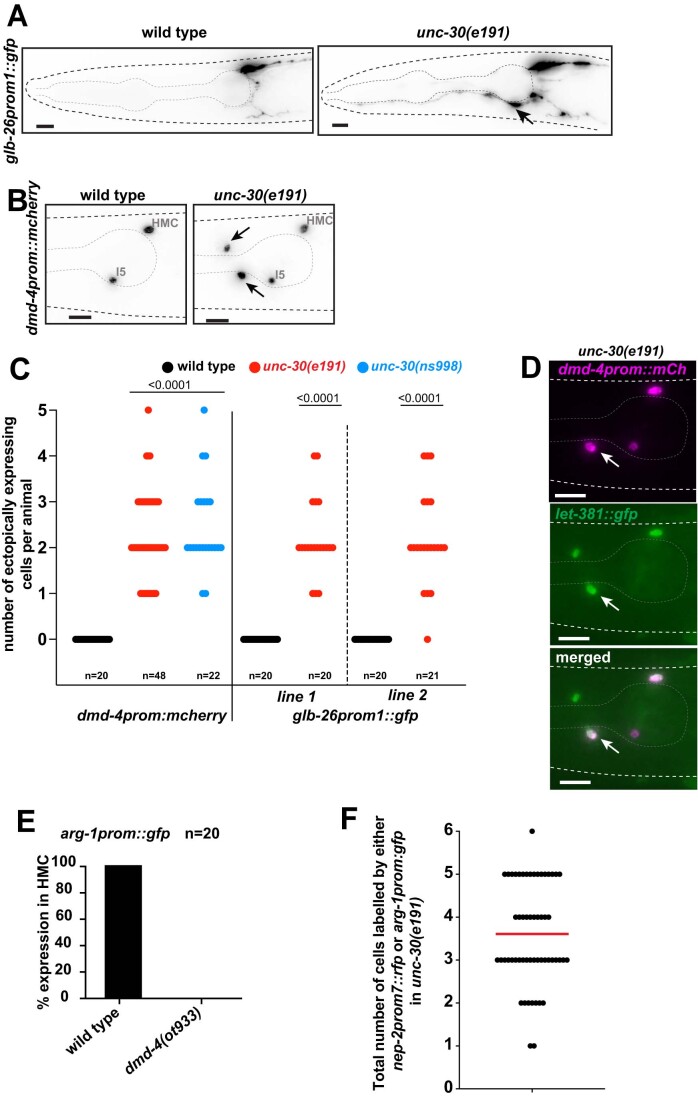
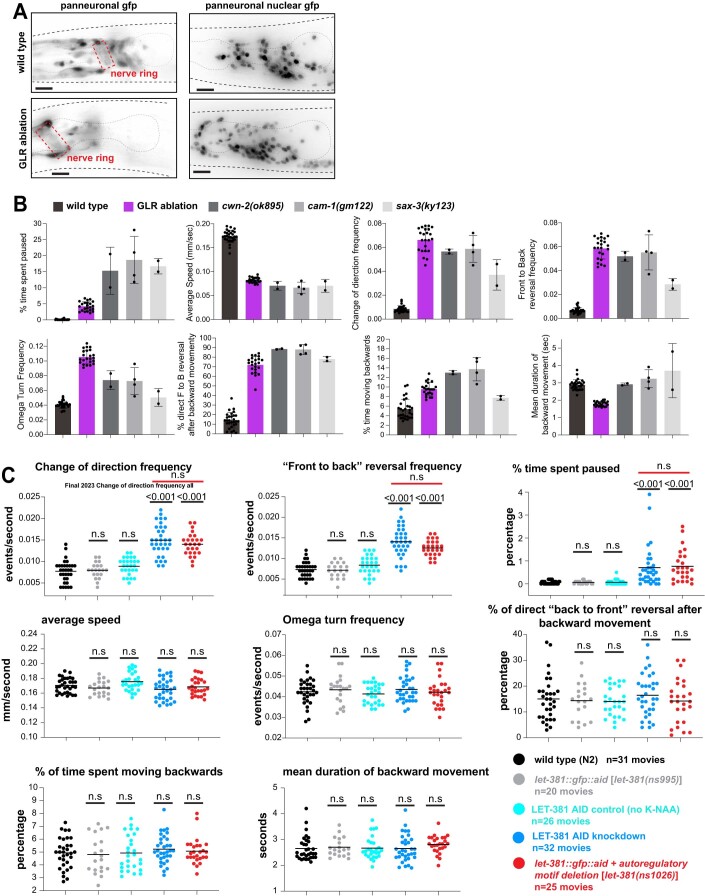
While most glial cell types in the central nervous system (CNS) arise from neuroectodermal progenitors, some, like microglia, are mesodermally derived. To understand mesodermal glia development and function, we investigated C. elegans GLR glia, which envelop the brain neuropil and separate it from the circulatory system cavity. Transcriptome analysis shows that GLR glia combine astrocytic and endothelial characteristics, which are relegated to separate cell types in vertebrates. Combined fate acquisition is orchestrated by LET-381/FoxF, a fate-specification/maintenance transcription factor also expressed in glia and endothelia of other animals. Among LET-381/FoxF targets, the UNC-30/Pitx2 transcription factor controls GLR glia morphology and represses alternative mesodermal fates. LET-381 and UNC-30 co-expression in naive cells is sufficient for GLR glia gene expression. GLR glia inactivation by ablation or let-381 mutation disrupts locomotory behavior and promotes salt-induced paralysis, suggesting brain-neuropil activity dysregulation. Our studies uncover mechanisms of mesodermal glia development and show that like neuronal differentiation, glia differentiation requires autoregulatory terminal selector genes that define and maintain the glial fate.

Keywords: let-381; unc-30; Glia Development; Locomotory Behavior; Terminal Selector.


Conflict of interest statement

The authors declare no competing interests.

Figures

Figure 1
Figure 1. Generation of a GLR-specific driver to study the expression profile of the mesodermal GLR glia.
(A) GLR glia (yellow boxes) derive from the lineage of the blast cell MS. This lineage produces mainly body wall muscle and pharyngeal muscle cells (green). GLR glia (yellow) are born at around the embryonic bean stage (360 min of embryonic development). The HMC cell and coelomocytes (CC) also derive from the MS lineage. Schematic adapted from (Sulston et al, 1983). (B) Schematic representation of the GLR glia (yellow). Pharynx is shown in green. The inset shows how C. elegans Nerve Ring (red) wraps around the sheet-like GLR glia processes. Schematic redrawn and modified from (Altun and Hall, 2016). (C) Cis-regulatory dissection analysis for the gene nep-2 resulted in isolation of a GLR glia-specific driver, prom7 (red box). (D) Fluorescence image of an L4 C. elegans showing expression of nep-2prom7::gfp specifically in GLR glia. Anterior is left, dorsal is up, and scale bar is 10 μm. (E) Genes from three families (neurotransmitter receptors and transporters, potassium channels and extracellular matrix genes) are overrepresented among GLR-enriched genes.
Figure 2
Figure 2. let-381/FoxF is required for GLR glia fate specification.
(A) let-381 genomic locus showing mutant alleles, reporters, fosmid genomic clones and RNAi sequences used in this study. (B) Expression of the endogenous let-381::gfp reporter at different stages during development. Dashed red boxes outline expression in GLR glia. (C) Absence of nep-2prom7::rfp expression in GLR glia (dashed red box) in homozygous let-381(gk302) mutants (right) as opposed to heterozygous animals (left). Quantification (number of GLR glia with nep-2prom7::rfp expression) is shown in the bar graph on the right. (D) Absence of pll-1prom1::rfp expression in GLR glia (dashed red box) in homozygous let-381(h107) mutants (right) as opposed to heterozygous animals (left). Quantification (number of GLR glia with pll-1prom1::rfp expression) is shown in the bar graph. Red “N” denotes pll-1prom1::rfp expression in neurons. (E) Similar to GLR glia-ablated animals (schematic), let-381(gk302) homozygous mutants lacking GLR glia exhibit anteriorly displaced nerve ring (NR). Dashed red box outlines a neuronal axon of the NR. Red circle in schematic indicates the Nerve Ring and pharynx is shown in green. Quantification is shown in the bar graph. Transgenic animals carrying the fosmid genomic clone WRM069bF08 with wild-type let-381 (rescue lines 1 and 2) display normal NR position. (F) Number of body wall muscle cells in the first three muscle columns of head and neck in wild type and let-381(gk302) mutants. Data information: unpaired t test was used for statistical analysis in (F). Anterior is left, dorsal is up and scale bars are 10 μm for all animal images. Source data are available online for this figure.
Figure 3
Figure 3. Postembryonic let-381 knockdown affects GLR glia gene expression.
(AG) gfp or mCherry-based reporter expression (green) in GLR glia of endogenously tagged (A) let-381, (B) nep-2, and (C) hlh-1 and transgenic (D) snf-11 (E) unc-46, (F) gly-18, and (G) lgc-55 in wild-type (left column), GLR-specific postembryonic let-381 RNAi (middle column) and RNAi control animals (right column). Fluorescence images of L4 animals are shown. GFP expression in GLR glia (dashed white circles) is downregulated in the let-381 RNAi animals but not affected in RNAi control. RNAi and control lines carry a co-injection marker expressed in body wall muscle (magenta). Quantification is shown in bar graphs on the right. Each bar represents % of expression in each of the six GLR glia (DL, DR, LL, LR, VL, VR) in the three different backgrounds (wild type = black, GLR-specific RNAi = red, RNAi control = blue). Three independent extrachromosomal lines were scored for the RNAi and RNAi controls. Data information: anterior is left, dorsal is up, and scale bars are 10 μm for all animal images. Source data are available online for this figure.
Figure 4
Figure 4. Acute larval and adult LET-381 depletion results in loss of GLR gene expression.
(A) Schematic representation of auxin-induced degradation (Zhang et al, 2015) of LET-381. TIR1 is transgenically provided and expressed specifically in GLR glia by the nep-2prom7 promoter. (B) Timeline of the auxin-inducible depletion experiment. Synchronized populations of L1 or late-L4/Young-adult animals were placed on plates containing the auxin analog K-NAA and imaged after a three-day exposure to K-NAA. Fluorescence intensities of gene expression in GLR glia were compared to age-matched animals grown on control plates without K-NAA. (C, D) Fluorescence images showing the result of (C) larval and (D) adult depletion of LET-381 using auxin-inducible degradation. Animals grown on control plates without K-NAA (left panels) show expression of let-381::gfp (green) and nep-2prom7::rfp (magenta) in GLR glia (dashed white circles). Age-matched animals grown on K-NAA-containing plates (right panels) show depletion of endogenous let-381::gfp expression specifically in the GLR glia; as shown expression in HMC remains unaffected. As a result, expression of the GLR-specific nep-2prom7::rfp reporter is downregulated in GLR glia. (E, F) Quantification (mean fluorescence intensity in cell bodies) of (E) larval and (F) adult LET-381 depletion on expression of nep-2prom7::rfp reporter in each GLR glia. Cell bodies of Lateral and Ventral GLR glia are too close to be clearly distinguished, thus they were grouped (LL + VL, LR + VR) for quantification purposes for this experiment. Red lines in dot plots indicate averages. Data information: unpaired t test used for statistical analysis in (E, F). n = 16 for control and depletion in (E), n = 23 for control and n = 26 for depletion in (F). a.u. = arbitrary units. Anterior is left, dorsal is up and scale bars are 10 μm for all animal images. Source data are available online for this figure.
Figure 5
Figure 5. let-381 motifs are required for endogenous gene expression in GLR glia.
(AD) Endogenous expression of (A) nep-2, (B) pll-1, (C) hlh-1, and (D) inx-18 in wild-type and let-381 motif-mutated animals (details on endogenous gfp reporters and molecular identity of let-381 motif mutations are shown in Fig. EV1F). Animal images are on the left. Dashed circles outline expression in GLR glia. Quantifications are shown in the dot plots on the right. Data information: Mean fluorescence expression intensity for each GLR glia cell for (A, B, D) and number of bright gap-junction puncta for (C) is compared between the wild-type and let-381-motif-mutated backgrounds. Black lines indicate averages. Unpaired t test used for statistical analysis. a.u. = arbitrary units. Anterior is left, dorsal is up, and scale bars are 10 μm for all animal images. Source data are available online for this figure.
Figure 6
Figure 6. let-381 positively regulates its own expression.
(A) Endogenous let-381::gfp expression in different development stages in two different backgrounds: wild type (top), let-381 autoregulatory motif deletion (bottom). Animal images are shown on the left and quantification of expression in the L4 stage is shown on the right: percentage of each GLR cell expressing let-381::gfp in wild-type and autoregulatory motif deletion backgrounds. Red dashed circles outline GLR glia. (BE) Effect of autoregulatory motif deletion on endogenous (B) hlh-1, (C) nep-2, (D) pll-1, and (E) inx-18 gfp reporter expression in GLR glia at different developmental stages. Quantification is shown on the right of each animal image panel for L4 animals. Red dashed circles outline GLR glia. Data information: unpaired t test used for statistical analysis in (E). Anterior is left, dorsal is up, and scale bars are 10 μm for all animal images. Source data are available online for this figure.
Figure 7
Figure 7. unc-30 acts downstream of let-381 to control GLR glia gene expression and the length of GLR anterior process.
(A) unc-30 genomic locus showing mutant alleles, reporters, fosmid genomic clones used in this study. (B) Expression of the endogenous unc-30::gfp reporter at different stages during development. Dashed red circles outline GLR glia. (C) nep-2prom7::gfp expression in a wild-type L4 (left) and a unc-30(e191) null mutant L4 animal (right). GFP expression is lost in the lateral and ventral GLR glia in unc-30(e191). The anterior process of the dorsal GLR glia still expressing GFP is shorter than that of a wild-type animal. (D) Quantification of percentage of each GLR glia cell with nep-2prom7::gfp expression (L4 stage) for different unc-30 mutant backgrounds. (E) Quantification of the length of GLR anterior processes (L4 stage) for different unc-30 mutant backgrounds. (F) Images of L4 animals showing differences in endogenous unc-30::gfp expression upon mutation of the let-381 motifs present in the fifth intron of unc-30. Dashed red circles outline GLR glia and black asterisks denote expression in the ASG and AVJ head neurons. (G) Quantification of unc-30::gfp fluorescence intensity for each GLR glia cell; black lines in bar graphs indicate averages. Data information: unpaired t test used for statistical analysis in (G). a.u. = arbitrary units. Anterior is left, dorsal is up, and scale bars are 10 μm for all animal images. Source data are available online for this figure.
Figure 8
Figure 8. unc-30 represses HMC gene expression in GLR glia.
(A) Images showing let-381::gfp expression in wild type (left) and unc-30(e191) mutants (right). Expression is observed in GLR glia anterior to the pharynx bulb and the HMC above and posterior to the pharynx bulb. In wild-type background animals, GLR glia have a small sesame-like nucleus shape. In contrast in unc-30 mutants, some GLR glia nuclei appear larger and more round (black asterisks), reminiscent to the nucleus of the HMC cell. In addition, GLR glia are often mispositioned along the dorsoventral or left-right axis in unc-30 mutants. Red arrow points to dorsally mispositioned cells. (B) Number of let-381::gfp expressing cells is unaffected in unc-30(e191) null mutants. (C) Expression of GLR-specific nep-2prom7::tagrfp (magenta) and HMC-specific arg-1prom::gfp (green) in wild-type and unc-30(ns998) mutant backgrounds. Fluorescence images of L4 animals are shown. In the GLR-specific unc-30(ns998) mutant background, GLR glia lose GLR-specific RFP expression and ectopically express HCM-specific GFP instead (white arrow). (D) Quantification of ectopic expression of the HMC-specific arg-1prom::gfp in GLR glia in unc-30(e191) and unc-30(ns998) mutants. (E) Ectopic arg-1prom::gfp expression in unc-30 mutants is not observed in the dmd-4(ot933) mutant background. Black arrows point to ectopic arg-1prom::gfp expression. (F) Percentage of animals displaying ectopic expression of the GLR glia-specific reporter nep-2prom7::rfp, upon heat-shock-induced misexpression of let-381 and unc-30. Heat-shocked animals (red boxes) are compared to age-matched non-heat-shocked controls. (G) Images showing animals with ectopic nep-2prom7::rfp expression after heath shock-induced misexpression of LET-381 and UNC-30. Red dashed circles outline the expression GLR glia. Red asterisks point to expression in ventral nerve cord motor neurons and stomatointestinal muscle (upper panel) and body wall and pharynx muscle (bottom panel). Data information: unpaired t test used for statistical analysis in (B, D). Anterior is left, dorsal is up, and scale bars are 10 μm for (A, C, E). Scale bars are 100 μm for (G). Source data are available online for this figure.
Figure 9
Figure 9. GLR glia-defective animals display locomotion abnormalities and hypersensitivity at high-salt concentrations.
(AC) Images of L4 animals showing expression of gly-18prom::gfp reporter in (A) wild-type, (B) GLR glia ablation and (C) GLR glia ablation; ced-3(n717) backgrounds. GLR glia are outlined by red dashed circles. Black asterisks denote expression in a neuronal cell just above the dorsal GLR glia and red arrowheads point to HMC cells. In the GLR glia-ablation background, the nerve ring is anteriorly displaced as noted by a head muscle arm (gray arrowhead) penetrating the nerve ring at the anterior pharynx bulb. The HMC sister cell that normally dies by programmed apoptotic cell death in a wild-type animal, survives and also expresses gly-18prom::gfp in the ced-3(n7171) mutant background in (C). (DK) Locomotion parameters of foraging wild-type (black), control (gray), GLR glia-defective (red), and GLR glia-ablated (purple) animals were analyzed using automated tracking (Katz et al, ; Katz et al, 2019). (D) change of direction frequency, (E) “front to back” reversal frequency, (F) % time spent paused, (G) average speed, (H) omega turn frequency, (I)% direct “back to front” reversal after backward movement, (J) % time spent moving backwards, (K) mean duration of backward movement. Black lines in dot plots indicate averages. (L) GLR glia-ablated animals paralyze at a significantly higher rate than wild-type animals and animals in which LET-381 is downregulated [let-381(ns1026) and LET-381 AID knockdown] when exposed to 300 mM NaCl. GLR glia-ablated animals also recover motility at a significantly lower rate. Data information: unpaired t test was used for statistical analysis in (DL), *<0.05 in (L). For (L), 4 replicates were performed per genotype, n = 20–25 for replicate, error bars indicate standard error of the mean. Anterior is left, dorsal is up, and scale bars are 10 μm for all animal images. Source data are available online for this figure.
Figure 10
Figure 10. Regulatory network for the specification and identity maintenance of the C. elegans GLR glia.
(A) Schematic of the regulatory network identified in this study controlling fate specification and differentiation of GLR glia. (B) At the neurovascular unit, endothelial cells (dark blue), pericytes (light blue), and astrocytic endfeet (yellow) form the Blood–Brain Barrier isolating the central nervous system (CNS—red) from blood circulation (gray). (C) Similarly, the GLR glia sheet-like processes (yellow with blue stripes to show a mixed astrocytic-endothelial/mural fate) isolate the C. elegans nerve ring (red) from the pseudocoelom (gray). A thin layer of head muscle arms (green) penetrates the C. elegans nerve ring and therefore GLR flat processes are in close proximity to head neuromuscular junctions (White et al, 1986). The pseudocoelom is shown larger than its actual volume.
Figure EV1
Figure EV1. let-381 motifs are required for endogenous GLR gene expression and let-381 autoregulation in GLR glia.
(A) let-381 motif identified in this study. (B) Motif of the let-381 ortholog foxf from (Peterson et al, 1997). (C) let-381 motif from (Narasimhan et al, 2015). Similarities between the three motifs are apparent. (D) Locations (distances from start codons) of let-381 motifs of genes whose expression in GLR is downregulated in let-381 mutants (either GLR-specific let-381 RNAi and/or the let-381 autoregulatory allele). (E) Minimal promoter hlh-1prom1 was one of the promoters used in MEME to identify common motifs present in GLR glia genes. The let-381 motif identified by MEME is highlighted in dark red. A let-381 motif with slightly altered sequence (light red) was identified manually later and is required, together with the first motif, to control hlh-1 expression in GLR glia. (F) Schematics showing details on endogenous gfp-based tags, location of let-381 motifs and their mutation for nep-2, pll-1, hlh-1 and inx-18 genes. Red bars represent let-381 motifs. Distance from ATG is indicated above each motif. Nucleotide changes for each motif mutation is shown below the motifs.
Figure EV2
Figure EV2. GLR gene expression is lost in let-381 autoregulatory mutant animals.
(A) Schematic showing the location of the let-381 motif (red bar) in the let-381 promoter region and region deleted in the let-381(ns1026) mutation. (B) Conservation of the let-381 autoregulatory motif sequence (red box) is shown among five nematode species. Asterisks indicate conserved nucleotides. (CG) Effect of let-381 autoregulatory motif deletion, let-381(ns1026), on expression of (C) gly-18, (D) hot-5, (E) lgc-55, (F) gbb-2, and (G) snf-11 in GLR glia. Bar graphs show quantifications of gene expression at the L4 stage. For (C) animal images showing gene expression at L1 and L4 stages in wild-type and mutant backgrounds are shown on the left. Dashed red circles outline expression in GLR glia. Data information: Anterior is left, dorsal is up and scale bars are 10 μm for all animal images.
Figure EV3
Figure EV3. Effect of unc-30 on GLR gene expression.
(A) Transgenic constructs containing different fosmid clones (WRM) or PCR amplicons carrying wild-type copies of UNC-30 can rescue the effect of unc-30(e191) on GLR gene expression and anterior process length. (B-G) Effect of unc-30 mutation on expression of different genes in GLR glia. Expression of (E) gly-18, (F) pll-1 and (G) snf-11 is affected at a lesser extent compared to (B) nep-2, (C) lgc-55 and (D) hlh-1. (H) Cis-regulatory dissection analysis of unc-30. The fifth intron (prom8) of unc-30 is sufficient to drive expression in GLR glia. (I) Three let-381 motifs are found in the fifth intron of unc-30 (red boxes). Details on let-381 motif mutation alleles are shown below the DNA sequence. (J, K) Endogenous unc-30::gfp expression is not affected by postembryonic let-381 knockdown either (J) by GLR-specific RNAi or (K) in the GLR-specific let-381 autoregulatory motif deletion allele let-381(ns1026). Data information: Anterior is left, dorsal is up and scale bars are 10 μm for all animal images.
Figure EV4
Figure EV4. unc-30 represses HMC gene expression in GLR glia.
(A) Fluorescence images showing expression of glb-26prom::gfp in wild type and unc-30(e191) mutants. (B) Fluorescence images showing expression of dmd-4prom::mCherry in wild type and unc-30(e191) mutants. Arrows point to ectopic expression in unc-30(e191) mutants. (C) Quantification of ectopic expression of the two HMC reporters shown in (A) and (B) in unc-30 mutant backgrounds. (D) Cells ectopically expressing (white arrow) the HMC reporter dmd-4prom::mCherry (magenta) always co-express let-381::gfp (green). (E) Expression of arg-1prom::gfp is lost in HMC in dmd-4(ot933) mutants. (F) Total number of GLR glia cells expressing either the GLR glia-specific nep-2prom7::rfp or the HMC-specific arg-1prom::gfp in unc-30(e191) mutants. Data information: unpaired t test used for statistical analysis in (C). Anterior is left, dorsal is up and scale bars are 10 μm for all animal images.
Figure EV5
Figure EV5. Locomotion defects of GLR-ablated animals could partially be due to anteriorly displaced nerve ring.
(A) In wild-type animals (top row), axons of the nerve ring (dashed red box) are located between the two pharyngeal bulbs. In GLR-ablated animals (bottom row) the nerve ring is anteriorly displaced, located on top of the anterior pharynx bulb. As evidenced in the images on the right, not only the axonal projections, but also neuronal cell bodies (panneuronal nuclear gfp) are anteriorly displaced. Panneuronal gfp = unc-119prom::gfp, panneuronal nuclear gfp = rab-3prom1::nls::yfp. (B) cwn-2(ok895), cam-1(gm122), sax-3(ky123) mutants with anteriorly displaced nerve rings exhibit locomotion defects to the same direction, although of different magnitude as the GLR glia-ablated animals. (C) Auxin (K-NAA) dependent LET-381::AID knockdown results in similar defects in the same locomotion parameters as the let-381(ns1026) autoregulatory mutation. Genotypes are: wild-type N2 (black), let-381(ns995) control (gray), LET-381::AID knockdown [let-381(ns995);nsIs879 (nep-2prom7::TIR1)] exposed to K-NAA auxin (dark blue), LET-381::AID control [let-381(ns995) ; nsIs879 (nep-2prom7::TIR1)] not exposed to K-NAA auxin (light blue) and let-381(ns1026) autoregulatory mutation (red). Data information: in (B) wild type n = 29 movies, GLR ablation n = 23 movies, cwn-2(ok895) n = 2 movies, cam-1(gm122) n = 4 movies, sax-3(ky123) n = 2 movies. Bar height indicates average (center of error bars) and error bars show standard deviation in (B). Unpaired t test used for statistical analysis in (C); controls (gray and light blue) were compared to wild type (black). LET-38::AID knockdown (dark blue) was compared to its control group (light blue) and let-381(ns1026) was compared to its control (gray). No statistically significant differences were observed between the LET-381::AID knockdown and let-381(ns1026) as indicated by the red line on the top of the three upper diagrams. Anterior is left, dorsal is up and scale bars are 10 μm for all animal images.

Update of

Similar articles

Cited by

References

    1. Allen NJ, Lyons DA. Glia as architects of central nervous system formation and function. Science. 2018;362:181–185. - PMC - PubMed
    1. Altun ZF, Hall DH (2016) Handbook of C. elegans anatomy. WormAtlas
    1. Altun-Gultekin Z, Andachi Y, Tsalik EL, Pilgrim D, Kohara Y, Hobert O. A regulatory cascade of three homeobox genes, ceh-10, ttx-3 and ceh-23, controls cell fate specification of a defined interneuron class in C. elegans. Development. 2001;128:1951–1969. - PubMed
    1. Amin NM, Shi H, Liu J. The FoxF/FoxC factor LET-381 directly regulates both cell fate specification and cell differentiation in C. elegans mesoderm development. Development. 2010;137:1451–1460. - PMC - PubMed
    1. Bacaj T, Tevlin M, Lu Y, Shaham S. Glia are essential for sensory organ function in C. elegans. Science. 2008;322:744–747. - PMC - PubMed

MeSH terms

Substances