. 2024 Mar;16(3):475-505.
doi: 10.1038/s44321-024-00032-2. Epub 2024 Feb 15.

Targeting NUPR1-dependent stress granules formation to induce synthetic lethality in KrasG12D-driven tumors

Affiliations

Targeting NUPR1-dependent stress granules formation to induce synthetic lethality in KrasG12D-driven tumors

Patricia Santofimia-Castaño et al. EMBO Mol Med. 2024 Mar.

Abstract

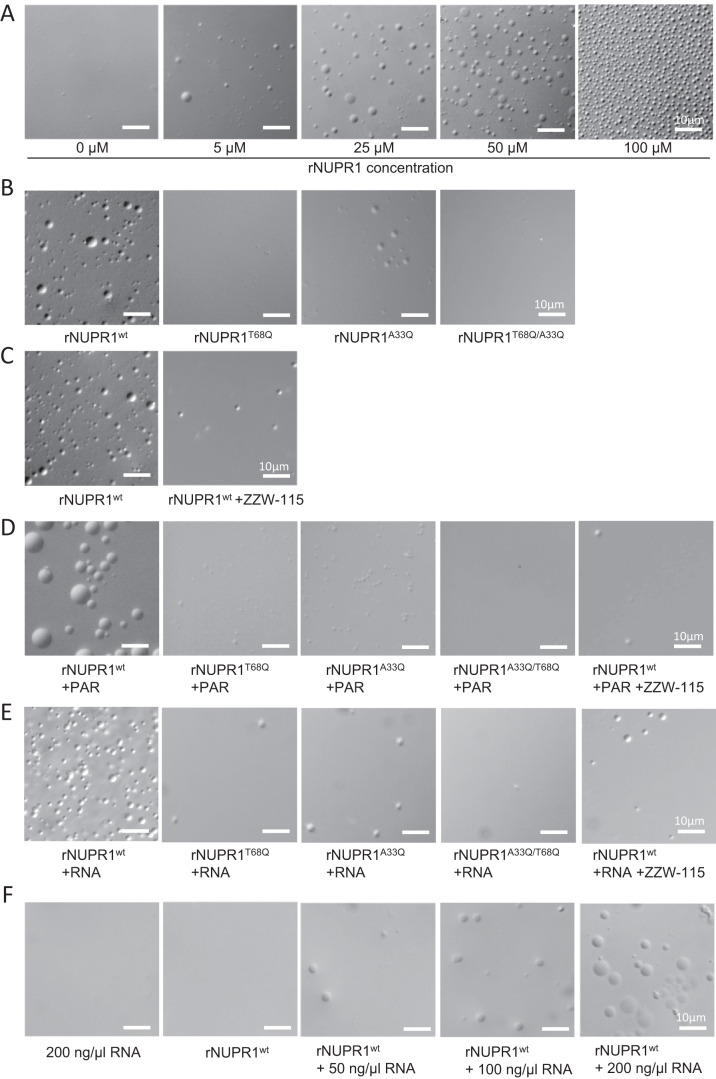
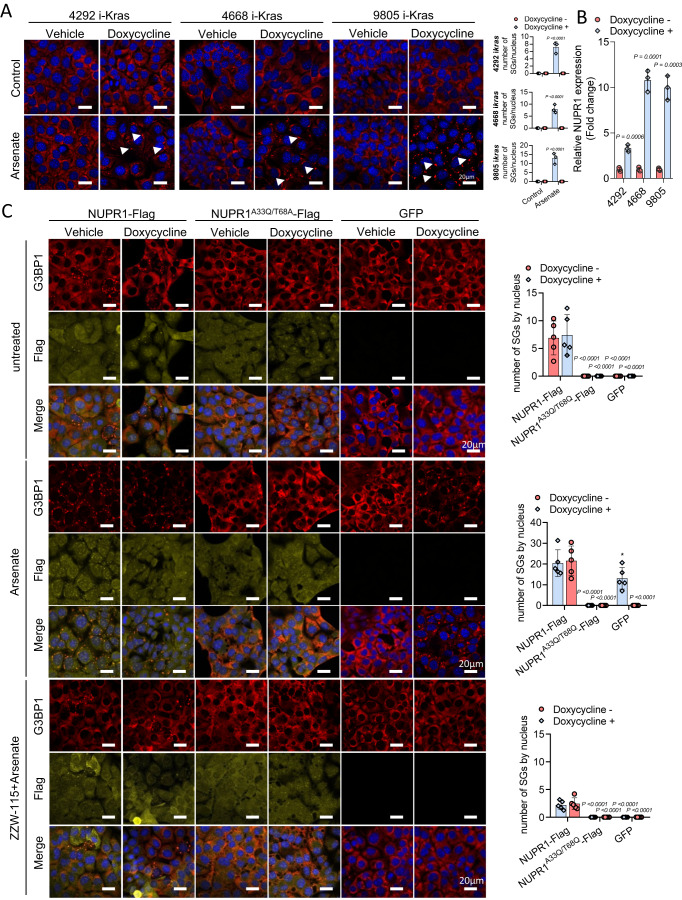
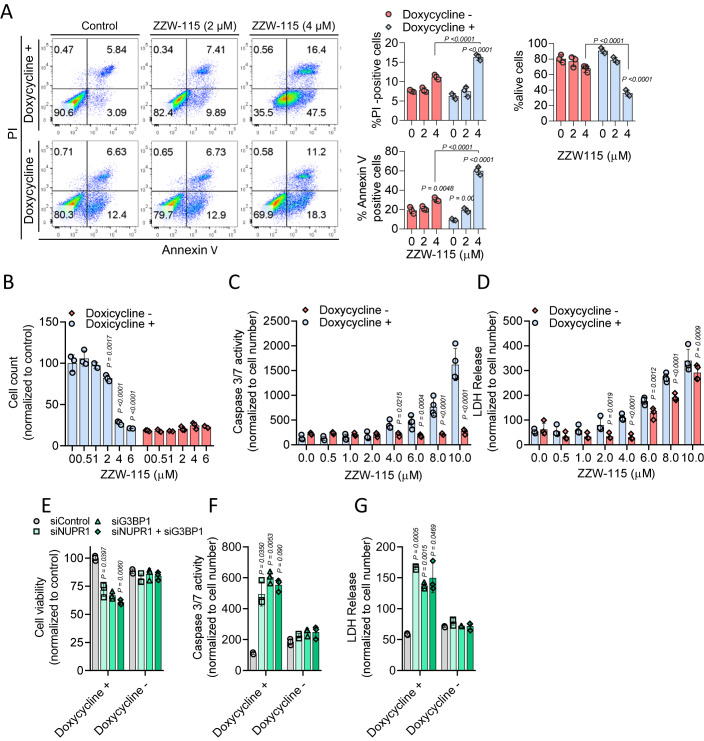
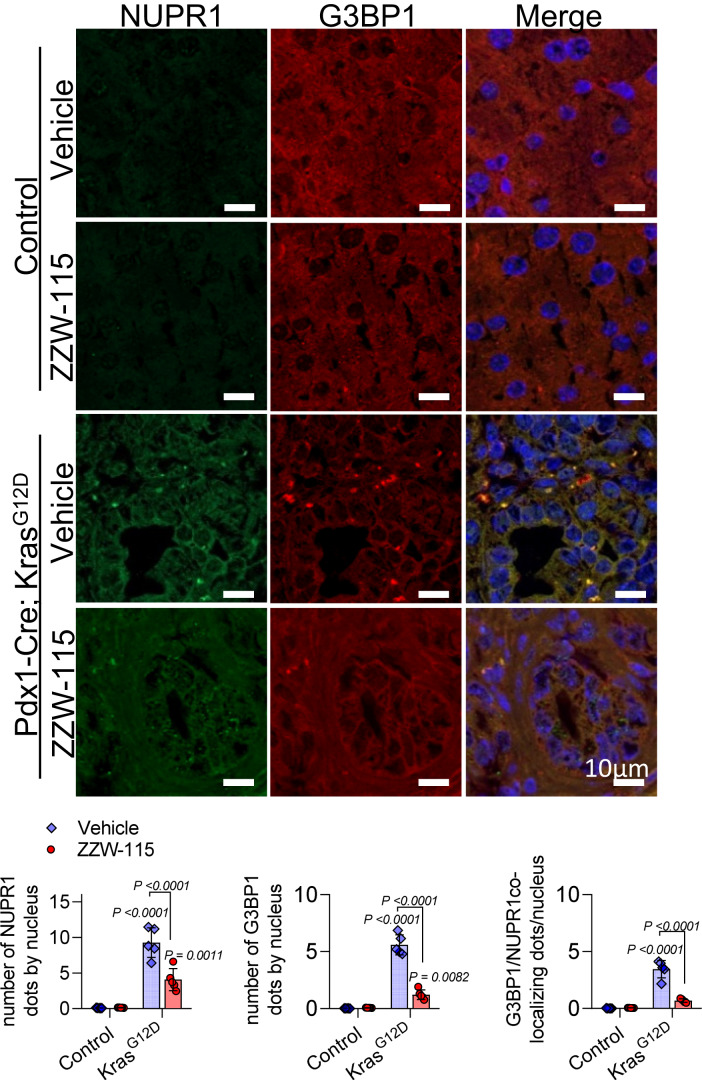
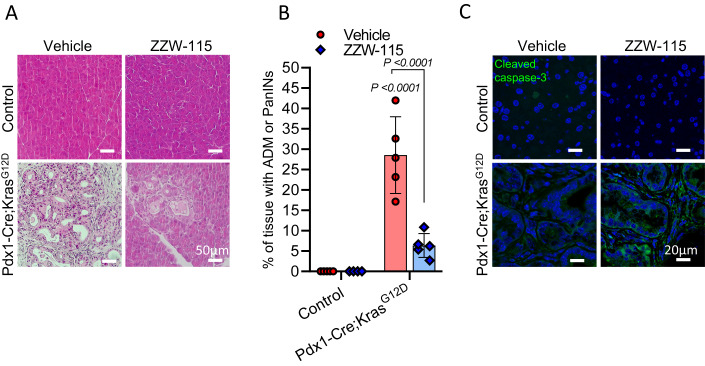
We find that NUPR1, a stress-associated intrinsically disordered protein, induced droplet formation via liquid-liquid phase separation (LLPS). NUPR1-driven LLPS was crucial for the creation of NUPR1-dependent stress granules (SGs) in pancreatic cancer cells since genetic or pharmacological inhibition by ZZW-115 of NUPR1 activity impeded SGs formation. The KrasG12D mutation induced oncogenic stress, NUPR1 overexpression, and promoted SGs development. Notably, enforced NUPR1 expression induced SGs formation independently of mutated KrasG12D. Mechanistically, KrasG12D expression strengthened sensitivity to NUPR1 inactivation, inducing cell death, activating caspase 3 and releasing LDH. Remarkably, ZZW-115-mediated SG-formation inhibition hampered the development of pancreatic intraepithelial neoplasia (PanINs) in Pdx1-cre;LSL-KrasG12D (KC) mice. ZZW-115-treatment of KC mice triggered caspase 3 activation, DNA fragmentation, and formation of the apoptotic bodies, leading to cell death, specifically in KrasG12D-expressing cells. We further demonstrated that, in developed PanINs, short-term ZZW-115 treatment prevented NUPR1-associated SGs presence. Lastly, a four-week ZZW-115 treatment significantly reduced the number and size of PanINs in KC mice. This study proposes that targeting NUPR1-dependent SGs formation could be a therapeutic approach to induce cell death in KrasG12D-dependent tumors.

Keywords: Kras; NUPR1; Stress Granules; Synthetic Lethality; ZZW-115.


Conflict of interest statement

JI is co-founder of PanCa Therapeutics and PredictingMed. The other authors declare no competing interests. The funders had no role in the design of the study; in the collection, analyses, or interpretation of data, in the writing of the manuscript, or in the decision to publish the results.

Figures

Figure 1
Figure 1. NUPR1 undergoes LLPS.
(A) Differential interference microscopy (DIC) revealed the concentration-dependent formation of liquid droplets of NUPR1 in the presence of PEG-8000 5% and NaCl 50 mM pH 7.2 (Tris buffer). (B) In the same conditions, wild-type rNUPR1 or rNUPR1 mutated on positions A33Q, T68Q, or A33Q/T68Q at 50 µM were tested. (C) The wild-type rNUPR1 at 50 µM was co-incubated with the NUPR1 inhibitor, ZZW-115, at the same concentration. The wild-type rNUPR1 or rNUPR1 mutated on positions A33Q, T68Q, or A33Q/T68Q at 5 µM were co-incubated with (D) Poly(ADP-ribose) (PAR; 5 µM) or (E) RNA (0.2 µg/µl). (F) The wild-type rNUPR1 at 50 µM was co-incubated with RNA at increasing concentration in absence of PEG-8000. Several representative DIC pictures are shown (n = 4). Source data are available online for this figure.
Figure 2
Figure 2. NUPR1 is essential for the formation of SGs.
(A) Number of individual proteins identified after co-immunoprecipitation with anti-Flag or anti-GFP agarose beads and LC-MS/MS proteomic analysis in MiaPaCa-2 cells transfected with NUPR1-Flag plasmid (up) or NUPR1-GFP (down). (B) PLA was performed in MiaPaCa-2 cells in the presence or in the absence of ZZW-115 at 6 µM for 6 h in the presence or in the absence of Arsenate at 0.5 mM for 1 h. Mouse anti-G3BP1 and rabbit anti-NUPR1 antibodies were used. A representative experiment is shown (n =  4). (C) Immunofluorescence was performed in MiaPaCa-2 cells transfected with siControl or siNUPR1 for 48 h. Mouse anti-G3BP1 and Alexa 568-labeled goat anti-mouse secondary antibodies were used. A representative experiment is shown, arrowheads in the figure highlight the SGs. Quantification of the number of SGs by nucleus is shown (n = 5). Data represent mean ± SD, two-way ANOVA with Sidak correction. (D) Immunofluorescence was performed in MiaPaCa-2 cells treated with ZZW-115 at 6 µM for 6 h in the presence or in the absence of arsenate at 0.5 mM for 1 h. Mouse anti-G3BP1 and rabbit anti-NUPR1 and then, Alexa 568-labeled goat anti-mouse and Alexa 488-labeled goat anti-mouse secondary antibodies were used, arrowheads in the figure highlight the SGs. Quantification of number of G3BP1 or NUPR1 by nucleus or number of colocalizing NUPR1/G3BP1 dots by nucleus is shown (n = 5). Data represent mean ± SD, two-way ANOVA with Sidak correction. (E) Pdx1-cre;LSL-KrasG12D/INK4a/Arffl/fl/NUPR1+/+ or Pdx1-cre;LSL-KrasG12D/INK4a/Arffl/fl/NUPR1-/- mice cells were treated with Arsenate at 0.5 mM for 1 h. Mouse anti-G3BP1 and rabbit anti-NUPR1 and then, Alexa 568-labeled goat anti-mouse and Alexa 488-labeled goat anti-mouse secondary antibodies were used. Representative pictures are shown, arrowheads in the figure highlight the SGs. Quantification of number of G3BP1 or NUPR1 by nucleus or number of colocalizing NUPR1/G3BP1 dots by nucleus is shown (n = 5). Data represent mean ± SD, two-way ANOVA with Sidak correction. Source data are available online for this figure.
Figure 3
Figure 3. NUPR1 induced SGs formation in KrasG12D-independent manner.
(A) Immunofluorescence staining was performed in 4292 i-Kras, 4668 i-Kras and 9805 i-Kras cells exposed or no to doxycycline and treated with Arsenate at 0.5 mM for 1 h. Mouse anti-G3BP1 and Alexa 568-labeled goat anti-mouse antibodies were used. Representative pictures are shown, arrowheads in the figure highlight the SGs. Quantification of number of SGs in 4292 i-Kras (up), 4668 i-Kras (middle), and 9805 i-Kras cells (down) (n = 3, mean of SGs in 5 pictures per n) data represent mean ± SD, two-way ANOVA with Sidak correction. (B) NUPR1 mRNA levels were measured in 4292 i-Kras, 4668 i-Kras, and 9805 i-Kras cells treated or not with doxycycline, expressed as fold changes (n = 3, mean of the fold change, triplicates were done in each independent experiment). Data represent mean ± SD. Student’s 2-tailed unpaired t test was used. (C) Immunofluorescence staining was performed in 9805 i-Kras cells 24 h post-transfection of NUPR1-Flag wild-type, its double mutant NUPR1A33Q/T68Q-Flag, or a GFP plasmids in control conditions (up), upon treatment with Arsenate at 0.5 mM for 1 h (middle), or upon treatment with ZZW-115 at 6 µM for 6 h in the presence or in the absence of Arsenate at 0.5 mM for 1 h (down). Mouse anti-G3BP1 and rabbit anti-Flag and then, Alexa 568-labeled goat anti-mouse and Alexa 647-labeled goat anti-rabbit secondary antibodies were used. Quantification of the number of SG by nucleus is shown (n = 5). Data represent mean ± SD, two-way ANOVA with Sidak correction. Source data are available online for this figure.
Figure 4
Figure 4. Inhibition of NUPR1 induced cell death only in KrasG12D cells.
(A) Flow cytometry analysis of annexin V/PI staining was done in 9805 i-Kras cells following 24 h of treatment with increasing concentrations of ZZW-115 in presence or not of doxycycline. A representative experiment of the dot plot profile of cells is shown (n = 3 independent experiments, triplicates were made on each one). Percentage of PI positive cells, Annexin V positive cells and alive cells were counted. Data represent mean ± SD, two-way ANOVA with Sidak correction. (B) Cell count of 9805 i-Kras cells measured by IncuCyte live-cell imaging after 30 h of treatment of increasing concentrations of ZZW-115 in presence or not of doxycycline was evaluated (n = 3). Data represent mean ± SD, two-way ANOVA with Sidak correction. 9805 i-Kras cells were incubated at increasing concentrations ZZW-115 in presence or absence of doxycycline for 24 h and (C) caspase 3/7 activity and (D) LDH release were measured (n = 4) data represent mean ± SD, two-way ANOVA with Sidak correction. (E) Cell viability, (F) caspase 3/7 activity, and (G) LDH release were measured in 9805 i-Kras cells transfected with siControl, siG3BP1, siNupr1 or both together for 48 h in the presence or absence of doxycycline (n = 3 independent experiments, triplicates were made on each one). Data represent mean ± SD, two-way ANOVA with Sidak correction. Source data are available online for this figure.
Figure 5
Figure 5. NUPR1’s in the presence of ZZW-115 treatment inhibits PanINs formation in KrasG12D mice.
Representative pictures of histologic sections of the pancreas of control mice or Pdx1-cre;LSL-KrasG12D mice (both from vehicle or 5 mg/kg ZZW-115-treated mice) stained with H&E (A) or Masson-trichrome staining (B) (n = 3). Quantification of surface with lesion tumors was calculated by ImageJ analysis, data represent mean ± SD, two-way ANOVA with Sidak correction. Immunohistofluorescence staining were performed in histologic sections of the pancreas of control mice or Pdx1-cre;LSL-KrasG12D mice (both from vehicle or 5 mg/kg ZZW-115-treated mice). Rabbit anti-pERK (C), rabbit anti-p-AKT (D), rabbit anti-KrasG12D (E) or, rabbit anti-CK19 (F) or rabbit anti-amylase (G) primary antibodies were used, then, Alexa 488-labeled goat anti-rabbit secondary antibody was used (n = 3). (H) Western-blot analysis was performed to evaluate p-ERK, ERK, p-AKT, AKT, and vinculin levels (n = 3). Source data are available online for this figure.
Figure 6
Figure 6. NUPR1 inhibition prevents PanINs formation and SG development in the pancreas of KrasG12D mice.
Immunohistofluorescence staining was performed on histologic sections of the pancreas of the different experimental groups. Mouse anti-G3BP1 and rabbit anti-NUPR1 (A) or Mouse anti-PABP and rabbit anti-p-EIF2α (B) and then, Alexa 568-labeled goat anti-mouse and Alexa 488-labeled goat anti-rabbit secondary antibodies were used. Representative pictures are shown, arrowheads in the figure highlight the SGs. Quantification of number of G3BP1, NUPR1, p-EIF2α or PABP by nucleus or number of colocalizing dots by nucleus is shown. Data represent mean ± SD, two-way ANOVA with Sidak correction (n = 5). Source data are available online for this figure.
Figure 7
Figure 7. NUPR1 inhibition induced cell death by apoptosis in KrasG12D expressing cells in vivo.
Immunohistofluorescence staining was performed on histologic sections of the pancreas of the different experimental groups. Rabbit anti-KrasG12D primary antibody and mouse anti-cleaved caspase 3 antibody was used. DNA was stained with DAPI. Pearson coefficient between both channels was calculated by JACoP, ImageJ. Data represent mean ± SD, ANOVA with Sidak correction (n = 5 mice). Source data are available online for this figure.
Figure 8
Figure 8. NUPR1 inhibition prevents SG formation in the PanINs of KrasG12D mice.
Immunohistofluorescence staining was performed on histologic sections of the pancreas of control mice or Pdx1-cre;LSL-KrasG12D mice (both from vehicle or 5 mg/kg ZZW-115-treated mice for 1 week starting from the week 14. Mouse anti-G3BP1 and rabbit anti-NUPR1 and then, Alexa 568-labeled goat anti-mouse and Alexa 488-labeled goat anti-rabbit secondary antibodies were used. Representative pictures are shown. Quantification of number of G3BP1 or NUPR1 by nucleus or number of colocalizing NUPR1/G3BP1 dots by nucleus is shown (n = 5). Data represent mean ± SD, two-way ANOVA with Sidak correction. Source data are available online for this figure.
Figure 9
Figure 9. NUPR1 inhibition prevents PanINs expansion in the pancreas of KrasG12D mice.
(A) Representative pictures of histologic sections of the pancreas of control mice or Pdx1-cre;LSL-KrasG12D mice (both from vehicle or 5 mg/kg ZZW-115-treated mice for four weeks starting from the week 14) stained with H&E (n = 5). (B) Quantification of surface with lesion tumors was calculated by ImageJ analysis, data represent mean ± SD (n = 5), two-way ANOVA with Sidak correction. (C) Immunohistofluorescence staining was performed on histologic sections of the pancreas of the different experimental groups. Mouse anti-cleaved caspase 3 antibody was used, and then, after that, Alexa 488-labeled goat anti-mouse (n = 3). Source data are available online for this figure.
Figure EV1
Figure EV1. NUPR1 is a key protein for the formation of SGs.
(A) NUPR1 and G3BP1 mRNA levels were measured in 4292 i-Kras, 4668 i-Kras and 9805 i-Kras cells 48 h after transfection, expressed as fold changes (n = 3 independent experiments, triplicates were made on each one). Data represent mean ± SD. One-way ANOVA, Sidak correction. (B) Western-blot analysis was performed in MiaPaCa-2 cells to evaluate G3BP1, NUPR1 and vinculin levels (n = 3). (C) Immunofluorescence was performed in MiaPaCa-2 cells transfected with siControl or siNUPR1 and after 24 h, with G3BP1 or GFP plasmid, cells were fix 24 h later. Mouse anti-G3BP1 and Alexa 568-labeled goat anti-mouse secondary antibodies were used. A representative experiment is shown (n = 2). (D) Cell count of MiaPaCa-2 cells in the previous conditions was evaluated (n = 3 independent experiments, triplicates were made on each one), data represent mean ± SD, two-way ANOVA, Sidak correction. (E) Immunofluorescence was performed in PDAC primary cell lines, mouse anti-G3BP1 and Alexa 568-labeled goat anti-mouse secondary antibodies were used (n = 3). (F) Chemogram assays were done on pancreatic cancer cell lines with increasing concentrations of ZZW-115 for 72 h (n = 3). Source data are available online for this figure.
Figure EV2
Figure EV2. Inhibition of NUPR1 by siRNA or Kras inhibitor MRTX1133 prevents SGs formation in i-Kras cells.
(A) OXPHOS metabolism, reflected by oxygen consumption rate (OCR) levels, were measured in 9805 i-Kras cells in the absence of presence of doxycycline and/or 30 nM of MRTX1133 for 24 h, a representative experiment is shown (data represent mean ± SEM, n = 3 independent experiments, triplicates were made on each one). (B) Immunofluorescence staining was performed in 4292 i-Kras, 4668 i-Kras and 9805 i-Kras cells 48 h after transfection with siControl of siNUPR1. Mouse anti-G3BP1 and then, Alexa 568-labeled goat anti-mouse secondary antibody were used (n = 3). (C) Immunofluorescence staining was performed in 9805 i-Kras cells in the absence of presence of arsenate and/or 30 nM of MRTX1133 for 24 h. Mouse anti-G3BP1 and Alexa 568-labeled goat anti-mouse secondary antibodies were used (n = 3). Source data are available online for this figure.
Figure EV3
Figure EV3. ZZW-115 prevents SGs formation in cells overexpressing NUPR1 independent of Kras signaling.
(A) Quantification of number of G3BP1 or NUPR1 by nucleus or number of colocalizing NUPR1/G3BP1 dots by nucleus in 9805 i-Kras cells is shown (n = 5). Data represent mean ± SD, two-way ANOVA with Sidak correction. (B) Immunofluorescence staining was performed in 9805 i-Kras cells 24 h post-transfection of NUPR1-Flag wild-type, its double mutant NUPR1 A33Q /T68Q-Flag, or a GFP plasmids upon treatment with ZZW-115 at 6 µM for 6 h. Mouse anti-G3BP1 and rabbit anti-Flag and then, Alexa 568-labeled goat anti-mouse and Alexa 647-labeled goat anti-rabbit secondary antibodies were used (n = 5 independent experiments, 5 pictures were used to calculate the mean of each experiment). Data represent mean ± SD, two-way ANOVA with Sidak correction. (C) Western blot analysis was performed in 9805 i-Kras cells to evaluate p-ERK, total-ERK, G3BP1 and vinculin levels (n = 3). Source data are available online for this figure.
Figure EV4
Figure EV4. Inhibition of NUPR1 induced cell death in KrasG12D-activated cells.
(A) Flow cytometry analysis of annexin V/PI staining of 4292 i-Kras (up), 4668 i-Kras (down) cells, following 24 h of treatment with increasing concentrations of ZZW-115 in presence or in the absence of doxycycline was done. A representative experiment of the dot plot profile of cells is shown (n = 3). (B) Cell count of 4292 i-Kras (up), 4668 i-Kras (down) cells measured by IncuCyte live-cell imaging after 30 h of treatment of increasing concentrations of ZZW-115 in the presence or in the absence of doxycycline was evaluated (n = 3 independent experiments, triplicates were made on each one). Data represent mean ± SD, Two-way ANOVA with Sidak correction. 4292 i-Kras (up), 4668 i-Kras (down) cells were incubated at increasing concentrations ZZW-115 in presence or in the absence of doxycycline for 24 h and (C) caspase 3/7 activity (n = 3) and (D) LDH release were measured (n = 3). For both, data represent mean ± SD, Two-way ANOVA with Sidak correction. (E) Caspase 3/7 activity was measured in 9805 i-Kras cells after 24 h of treatment of increasing concentrations of ZZW-115 in the presence or in the absence of Z-VAD-FMK. Data represent mean ± SD, (n = 3) two-way ANOVA with Sidak correction. (F) Cell count was measured in 9805 i-Kras cells after 24 h of treatment of increasing concentrations of ZZW-115 in the presence or in the absence of Z-VAD-FMK (n = 3). Data represent mean ± SD, two-way ANOVA with Sidak correction. (G) Caspase 3/7 activity was measured in 9805 i-Kras cells after 24 h of treatment at increasing concentrations of ZZW-115 in the presence or in the absence of 30 nM of MRTX1133 (n = 3). Data represent mean ± SD, two-way ANOVA with Sidak correction. (H) Western blot analysis was performed in 9805 i-Kras cells to evaluate p-ERK, total-ERK and vinculin levels upon ZZW-115-treatment (n = 3). (I) Cell viability (J) caspase 3/7 activity and (K) LDH release were measured in 4292 i-Kras (left), 4668 i-Kras (right) cells transfected with siControl, siG3BP1 or siNupr1 for 48 h in the presence or absence of doxycycline (n = 3 independent experiments, triplicates were made on each one). Data represent mean ± SD, Two-way ANOVA with Sidak correction. Source data are available online for this figure.
Figure EV5
Figure EV5. NUPR1 inhibition induced cell death in vivo.
(A) Immunohistofluorescence staining was performed on histologic sections of the pancreas of the different experimental groups at 5 weeks of age. Rabbit anti-NUPR1 antibody was used, then, Alexa 488-labeled goat anti-rabbit (n = 3). (B) Percentage of tissue affected by ADM and PanIN lesions per tissue field in Control and Pdx1-Cre;KrasG12D mice treated with vehicle solution or ZZW-115 for ten weeks (from 5 to 15 weeks) (n = 6). Data represent mean ± SD, Two-way ANOVA with Sidak correction. (C) Western-blot analysis was performed in Pdx1-cre;LSL-KrasG12D/INK4a/Arffl/fl/NUPR1+/+ and Pdx1-cre;LSL-KrasG12D/INK4a/Arffl/fl/NUPR1-/- mice cells to evaluate AKT, p-AKT, ERK, p-ERK, KrasG12D or β-actin levels. (D) Percentage of tissue affected by ADM and PanIN lesions per tissue field in Control and Pdx1-Cre;KrasG12D mice treated with vehicle solution or ZZW-115 for four weeks (from 15 to 19 weeks) (n = 5). Data represent mean ± SD, Two-way ANOVA with Sidak correction. Source data are available online for this figure.

References

    1. Aguirre AJ, Hahn WC. Synthetic lethal vulnerabilities in KRAS-mutant cancers. Cold Spring Harb Perspect Med. 2018;8:a031518. - PMC - PubMed
    1. Arimoto K, Fukuda H, Imajoh-Ohmi S, Saito H, Takekawa M. Formation of stress granules inhibits apoptosis by suppressing stress-responsive MAPK pathways. Nat Cell Biol. 2008;10:1324–1332. - PubMed
    1. Bonucci A, Palomino-Schätzlein M, Malo de Molina P, Arbe A, Pierattelli R, Rizzuti B, Iovanna JL, Neira JL. Crowding effects on the structure and dynamics of the intrinsically disordered nuclear chromatin protein NUPR1. Front Mol Biosci. 2021;8:684622. - PMC - PubMed
    1. Cano CE, Hamidi T, Garcia MN, Grasso D, Loncle C, Garcia S, Calvo E, Lomberk G, Dusetti N, Bartholin L, et al. Genetic inactivation of Nupr1 acts as a dominant suppressor event in a two-hit model of pancreatic carcinogenesis. Gut. 2014;63:984–995. - PubMed
    1. Collins MA, Brisset J-C, Zhang Y, Bednar F, Pierre J, Heist KA, Galbán CJ, Galbán S, di Magliano MP. Metastatic pancreatic cancer is dependent on oncogenic Kras in mice. PLoS ONE. 2012;7:e49707. - PMC - PubMed