

Generative adversarial reduced order modelling
- PMID: 38361023
- PMCID: PMC10869836
- DOI: 10.1038/s41598-024-54067-z
Generative adversarial reduced order modelling
Abstract
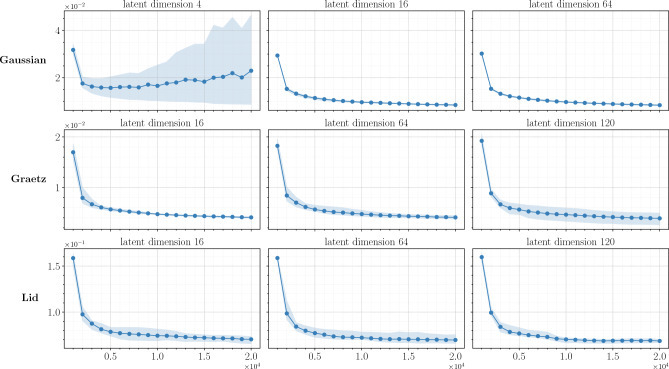
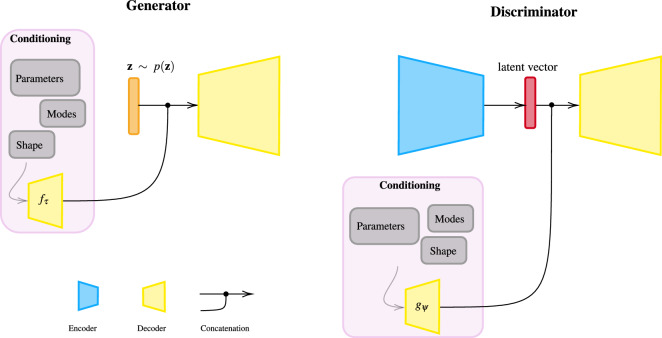
In this work, we present GAROM, a new approach for reduced order modeling (ROM) based on generative adversarial networks (GANs). GANs attempt to learn to generate data with the same statistics of the underlying distribution of a dataset, using two neural networks, namely discriminator and generator. While widely applied in many areas of deep learning, little research is done on their application for ROM, i.e. approximating a high-fidelity model with a simpler one. In this work, we combine the GAN and ROM framework, introducing a data-driven generative adversarial model able to learn solutions to parametric differential equations. In the presented methodology, the discriminator is modeled as an autoencoder, extracting relevant features of the input, and a conditioning mechanism is applied to the generator and discriminator networks specifying the differential equation parameters. We show how to apply our methodology for inference, provide experimental evidence of the model generalization, and perform a convergence study of the method.
© 2024. The Author(s).
Conflict of interest statement
The authors declare no competing interests.
Figures


References
-
- Strauss WA. Partial Differential Equations: An Introduction. Wiley; 2007.
-
- Lomax H, Pulliam TH, Zingg DW, Pulliam TH, Zingg DW. Fundamentals of Computational Fluid Dynamics. Springer; 2001.
-
- Morton KW, Mayers DF. Numerical Solution of Partial Differential Equations: An Introduction. Cambridge University Press; 2005.
-
- Butcher JC. Numerical Methods for Ordinary Differential Equations. Wiley; 2016.
Grants and funding
LinkOut - more resources
Full Text Sources
