. 2024 Feb 14;15(1):20416695241226545.
doi: 10.1177/20416695241226545. eCollection 2024 Jan-Feb.

The quest for psychological symmetry through figural goodness, randomness, and complexity: A selective review

Affiliations

The quest for psychological symmetry through figural goodness, randomness, and complexity: A selective review

Daniel Fitousi et al. Iperception. .

Abstract

Of the four interrelated concepts in the title, only symmetry has an exact mathematical definition. In mathematical development, symmetry is a graded variable-in marked contrast with the popular binary conception of symmetry in and out of the laboratory (i.e. an object is either symmetrical or nonsymmetrical). Because the notion does not have a direct graded perceptual counterpart (experimental participants are not asked about the amount of symmetry of an object), students of symmetry have taken various detours to characterize the perceptual effects of symmetry. Current approaches have been informed by information theory, mathematical group theory, randomness research, and complexity. Apart from reviewing the development of the main approaches, for the first time we calculated associations between figural goodness as measured in the Garner tradition and measures of algorithmic complexity and randomness developed in recent research. We offer novel ideas and analyses by way of integrating the various approaches.

Keywords: complexity; figural goodness; randomness; symmetry.


Conflict of interest statement

The authors declared no potential conflicts of interest with respect to the research, authorship, and/or publication of this article.

Figures

Figure 1.
Figure 1.
Two dot patterns defined by their R & R subsets and by their similarity groups. Left panel: Size of the R & R subset = 1; Similarity group = 8 [I, V, H, L, R, 90°, 180°, and 270° rotations]. Right panel: Size of the R & R subset = 8; Similarity group = 1 [I]. I: identity; V: vertical reflection; H: horizontal reflection; L: left-diagonal reflection; R: right-diagonal reflection. Based on Palmer (1991).
Figure 2.
Figure 2.
Two dot patterns with the same size (4) of R & R subsets but produced by different transformations. Left panel: The relevant subset is produced by identity and the vertical reflection. Right panel: The relevant subset is produced by identity and the left-diagonal reflection. Based on Palmer (1991).
Figure 3.
Figure 3.
(a) The good pattern from the left of Figure 1 with the numerals 1 and 0 replacing the dots and empty cells, respectively. (b) The resulting one-dimensional string for this pattern; this same string results through all eight ways of mapping. (c) Three of the eight different strings produced by the poor pattern at the right of Figure 1. For example, the string on top is produced with coding by columns from left to right then proceeding within a column from the top.
Figure 4.
Figure 4.
The pair of Garner's best dot patterns marked both by the minimal R & R set of 1. Each pattern remains the same under all transformations, so that they have no alternatives. Nevertheless, the sequence below each figure reveals that the figure at the left is better than the figure at the right.
Figure 5.
Figure 5.
Panel a: Average LZ complexity as a function of the R & R subset. Panel b: Average ETC complexity as a function of the R & R subset. The variable at the abscissa is the size of the subset of the dot patterns that can be created from rotation and reflection (R&R) of each of 136 patterns issuing from 17 basic dot patterns. The dot pattern stimuli used by Garner can result in three values of the R&R subset size. Each individual pattern can be decoded into a string of 1 and 0 in eight different ways of reading the spatial pattern (Fitousi strings). The variables on the ordinate are the Lempel–Ziv complexity applied to each string (left) and the Effort-to-Compress complexity applied to each string (right).
Figure 6.
Figure 6.
Top: Two unidimensional binary patterns. Beneath: Calculation of subsymmetries in each of the top patterns. Note that the total number of subsymmetries is larger in the pattern at the top left. Digit at the left: size of the subsymmetry; digit on the right: number of subsymmetries of that size. Note: Based on Toussaint et al. (2015).
Figure 7.
Figure 7.
Panel a: Average unidimensional SubSym complexity as a function of the R & R subset. Panel b: Average two-dimensional SubSym complexity as a function of the R & R subset.
Figure 8.
Figure 8.
Two subjective variables from the Garner and Clement (1963) study plotted against the objective measure of the SubSym applied to the same stimuli. (a) Size of the subjective similarity group in which the stimulus exists as a function of the stimulus’ subsymmetry. (b) Judged figural goodness as a function of the figure's subsymmetry. Both contingencies are sizeable.
Figure 9.
Figure 9.
The subsymmetries of a square composed of small black and white squares (the two-dimensional pattern in the middle, (a); (b) horizontal subsymmetry of length 3; (c) horizontal subsymmetry of length 3; (d) horizontal subsymmetry of length 3; (e) vertical subsymmetry of length 3; (f) vertical subsymmetry of length 3; (g) vertical subsymmetry of length 3; (h) negative diagonal subsymmetry of length 3; (i) negative diagonal subsymmetry of length 2; (j) negative diagonal subsymmetry of length 2; (k) positive diagonal subsymmetry of length 3; (l) positive diagonal subsymmetry of length 2; and (m) positive diagonal subsymmetry of length 2.
Figure 10.
Figure 10.
Two subjective variables from the Garner and Clement (1963) study plotted against the objective measure of two-dimensional SubSym applied to the same stimuli. (a) Size of subjective similarity group in which the stimulus exists as a function of the two-dimensional stimulus subsymmetry. (b) Judged figural goodness as a function of the figure's two-dimensional subsymmetry. Both contingencies are sizeable.
Figure 11.
Figure 11.
The mathematics–psychology chasm. When asked which figure, the square or the rectangle, is more symmetrical, most participants do not understand the question and when they do provide an answer it is typically the wrong one. Most participants respond that the quality of symmetry does not apply to a circle.

Similar articles

Cited by

References

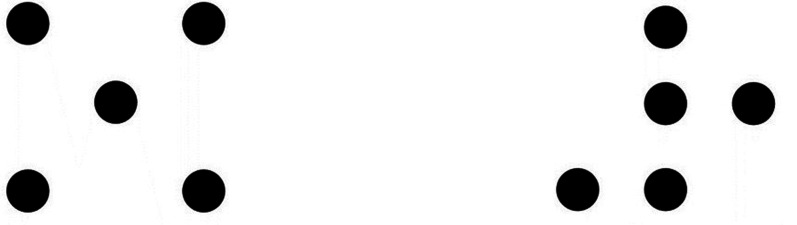
    1. Alexander C., Carey S. (1968). Subsymmetries. Perception & Psychophysics, 4, 73–77. 10.3758/BF03209511 - DOI
    1. Algom D., Fitousi D. (2016). Half a century of research on Garner interference and the separability-integrality distinction. Psychological Bulletin, 142, 1352–1383. 10.1037/bul0000072 - DOI - PubMed
    1. Anisiu M. C., Anisiu V., Kása Z. (2010). Total palindrome complexity of finite words. Discrete Mathematics, 310, 109–114. 10.1016/j.disc.2009.08.002 - DOI
    1. Attneave F. (1954). Some informational aspects of visual perception. Psychological Review, 61, 183–193. 10.1037/h0054663 - DOI - PubMed
    1. Attneave F. (1959). Applications of information theory to Psychology. Holt, Rinehart, and Winston.

LinkOut - more resources