Review
. 2024 Feb;29(2):020901.
doi: 10.1117/1.JBO.29.2.020901. Epub 2024 Feb 15.

Review of machine learning for optical imaging of burn wound severity assessment

Affiliations
Review

Review of machine learning for optical imaging of burn wound severity assessment

Robert H Wilson et al. J Biomed Opt. 2024 Feb.

Abstract

Significance: Over the past decade, machine learning (ML) algorithms have rapidly become much more widespread for numerous biomedical applications, including the diagnosis and categorization of disease and injury.

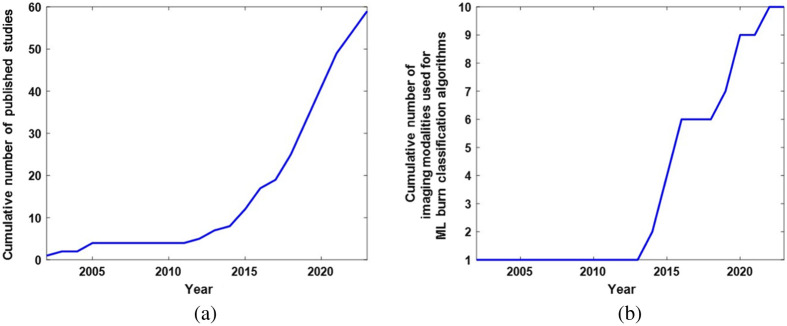
Aim: Here, we seek to characterize the recent growth of ML techniques that use imaging data to classify burn wound severity and report on the accuracies of different approaches.

Approach: To this end, we present a comprehensive literature review of preclinical and clinical studies using ML techniques to classify the severity of burn wounds.

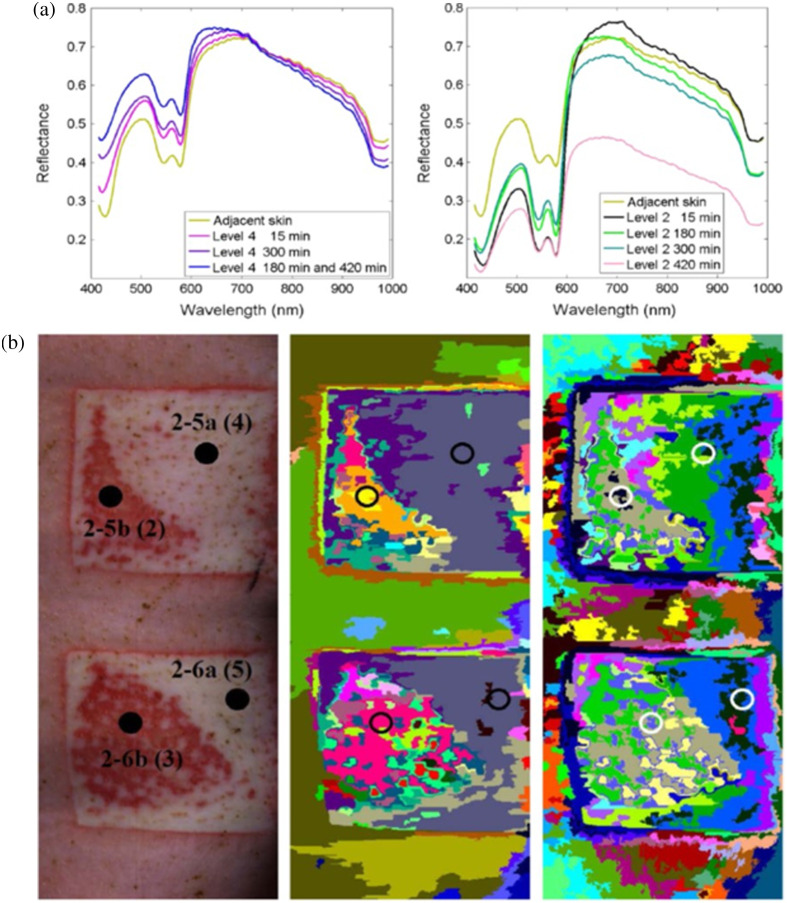
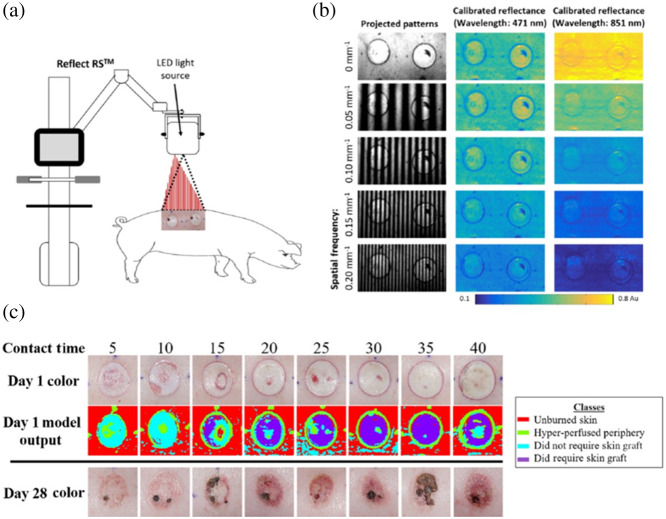
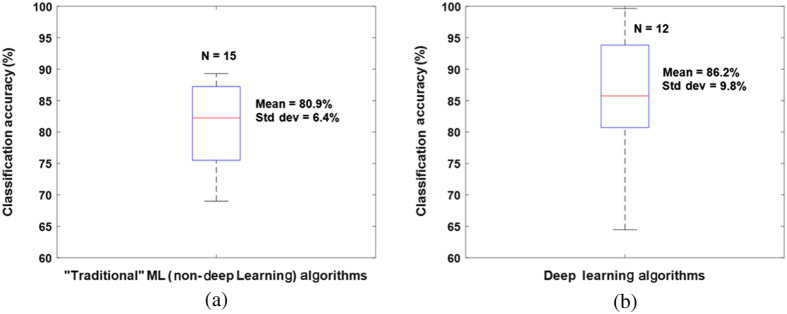
Results: The majority of these reports used digital color photographs as input data to the classification algorithms, but recently there has been an increasing prevalence of the use of ML approaches using input data from more advanced optical imaging modalities (e.g., multispectral and hyperspectral imaging, optical coherence tomography), in addition to multimodal techniques. The classification accuracy of the different methods is reported; it typically ranges from 70% to 90% relative to the current gold standard of clinical judgment.

Conclusions: The field would benefit from systematic analysis of the effects of different input data modalities, training/testing sets, and ML classifiers on the reported accuracy. Despite this current limitation, ML-based algorithms show significant promise for assisting in objectively classifying burn wound severity.

Keywords: artificial intelligence; burn assessment; burn severity; burn wound; debridement; machine learning; optical imaging; tissue classification.


Figures

Fig. 1
Fig. 1
Over the past decade, there has been a rapid increase in the number of studies developing machine learning approaches for burn wound classification using imaging data. (a) Cumulative number of published studies on ML burn classification methods using imaging data as a function of time over the past two decades. A progressively steeper increase in the cumulative number of publications is observed, especially over the past decade. (b) Cumulative number of different imaging modalities employed to train ML-based burn wound classification algorithms in published studies, plotted as a function of time over the past two decades. As with the cumulative number of published studies, the cumulative number of imaging modalities used in these applications has increased sharply over the past decade.
Fig. 2
Fig. 2
Results of a deep learning algorithm for classifying burn severity using color photography data, mapped across the tissue surfaces of patients. Data from color images (a) were input into a multi-layer deep learning procedure including segmentation and feature fusion. The algorithm classified burn regions (c) as superficial partial-thickness (blue), deep partial-thickness (green), and full-thickness (red). Ground-truth categorization (b) is shown for comparison (adapted from Ref. , with permission).
Fig. 3
Fig. 3
Workflow of human burn severity classification method using parameters obtained from color images. Four different parameters (hue, chroma, kurtosis, and skewness) are extracted from the color images in the CIELAB space. Additionally, the histogram of oriented gradients (Hog) feature is calculated to provide local information about the shape of the region of the tissue that was burned. These parameters are employed to train an SVM to classify the severity of the burn. The combination of L*, a*, and b* parameters shows different types of contrast for different categories of burns (super dermal, deep dermal, and full thickness). For distinguishing super dermal burns (which do not require grafting) from the other two categories (which require grafting), 61 out of 74 burns (82%) were classified correctly (adapted from Ref. , with permission).
Fig. 4
Fig. 4
Tissue classification results using multispectral imaging data to train CNN. (a) Digital color images from three burn patients. The patients in Rows 1 and 3 had severe burns; the patient in Row 2 had a superficial burn. (b) A probability map of burn severity, where purple/blue colors represent a low probability of a severe burn and orange/red colors denote a high probability of a severe burn. The clear-appearing region in the middle of burn (2b) represents a set of pixels with probability < 0.05 of severe burn. (c) A segmented probability map in which purple pixels denote a probability of severe burn that exceeds a user-defined threshold. The algorithm performed well at correctly identifying the two severe burns and distinguishing them from the superficial burn (reproduced from Ref. , with permission).
Fig. 5
Fig. 5
Classification of burn severity using hyperspectral imaging data. (a) Notable differences are seen in the 400 to 600 nm range of the reflectance spectra of more severe burns (Level 4) and less severe burns (Level 2) in a porcine model. These differences are likely attributable to changes in the concentration of hemoglobin (which strongly absorbs light in this wavelength regime) due to different levels of damage to the tissue vasculature. (b) Different burn severities (left column) are classified using two different segmentation algorithms: a spectral-spatial algorithm (center column) and a K-means algorithm (right column) (adapted from Ref. , with permission).
Fig. 6
Fig. 6
ML-based classification of burn severity in a preclinical model using multispectral spatial frequency domain imaging (SFDI) data. (a) A commercial device (Modulim Reflect RS™) projected patterns of light with different wavelengths and spatially modulated (sinusoidal) patterns onto a porcine burn model and detected the backscattered light using a camera. (b) The backscattered images at the different spatial frequencies were demodulated and calibrated to obtain reflectance maps at each wavelength. The relationship between reflectance and spatial frequency was different at the different wavelengths (e.g., 471 nm versus 851 nm, as shown here). (c) The reflectance data at each wavelength were used to train an SVM to distinguish between four different types of tissue (unburned skin, hyper-perfused periphery, burns that did not require grafting, and burns that required grafting). The ML algorithm reliably distinguished more severe burns (originating from longer thermal contact times) from less severe burns. When using a tenfold cross-validation procedure, the overall diagnostic accuracy of the method was 92.5% (adapted from Ref. , with permission).
Fig. 7
Fig. 7
Box plots showing the means, standard deviations, and distributions of reported accuracy values from burn wound classification studies using (a) “traditional” (non-deep learning) ML algorithms and (b) deep learning ML algorithms with digital color images as inputs. Classification results from 15 different “traditional” ML algorithms and 12 different deep learning algorithms were used; the data are from Refs. –, , , , , , , –, and –. Several studies comparing multiple ML algorithms,,,,,, provided multiple data points that were included in these box plots. Overall, the deep learning algorithms trended toward higher mean accuracy, and the five highest accuracy values were all from deep learning algorithms. However, the deep learning algorithms still had a wide range of reported accuracy values, likely due to the substantial presence of other factors that differed between the studies (e.g., size and composition of dataset; training, validation, and testing procedures; type of ML algorithm employed; types of data pre-processing; and categories used for classification).

References

    1. Kaiser M., et al. , “Noninvasive assessment of burn wound severity using optical technology: a review of current and future modalities,” Burns 37, 377–386 (2011).BURND810.1016/j.burns.2010.11.012 - DOI - PMC - PubMed
    1. Rowan M. P., et al. , “Burn wound healing and treatment: review and advancements,” Crit. Care 19, 243 (2015).10.1186/s13054-015-0961-2 - DOI - PMC - PubMed
    1. Dilsizian S. E., Siegel E. L., “Artificial intelligence in medicine and cardiac imaging: harnessing big data and advanced computing to provide personalized medical diagnosis and treatment,” Curr. Cardiol. Rep. 16, 441 (2014).10.1007/s11886-013-0441-8 - DOI - PubMed
    1. Handelman G. S., et al. , “eDoctor: machine learning and the future of medicine,” J. Intern.l Med. 284, 603–619 (2018).JINMEO10.1111/joim.12822 - DOI - PubMed
    1. Topol E. J., “High-performance medicine: the convergence of human and artificial intelligence,” Nat. Med. 25, 44–56 (2019).10.1038/s41591-018-0300-7 - DOI - PubMed

Publication types