. 2024 Jan 26;27(3):109030.
doi: 10.1016/j.isci.2024.109030. eCollection 2024 Mar 15.

Recognition of yeast β-glucan particles triggers immunometabolic signaling required for trained immunity

Affiliations

Recognition of yeast β-glucan particles triggers immunometabolic signaling required for trained immunity

Cian J H Horneck Johnston et al. iScience. .

Abstract

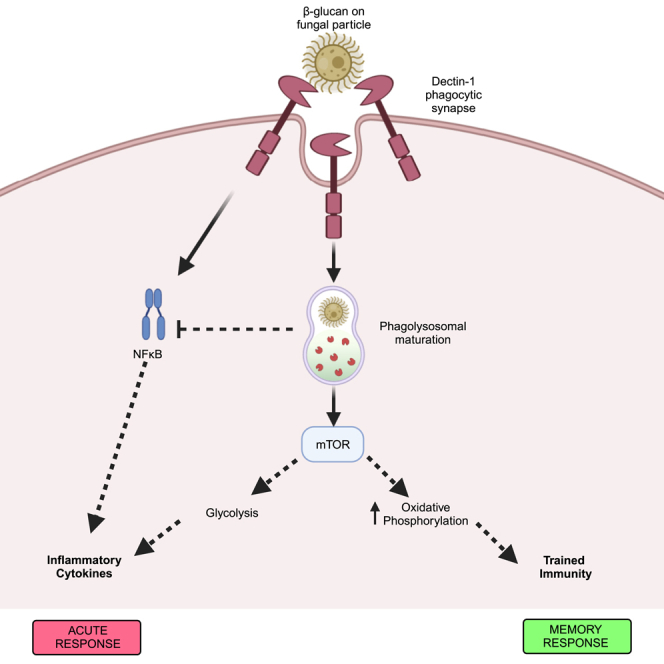
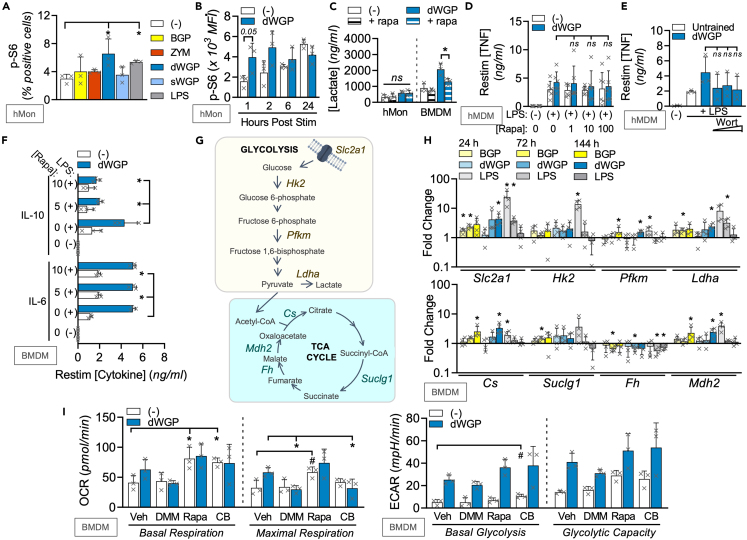
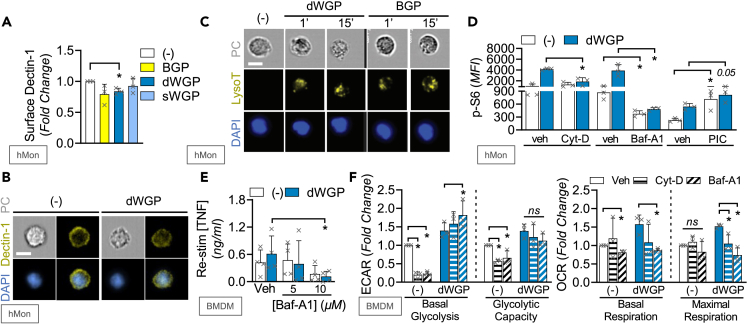
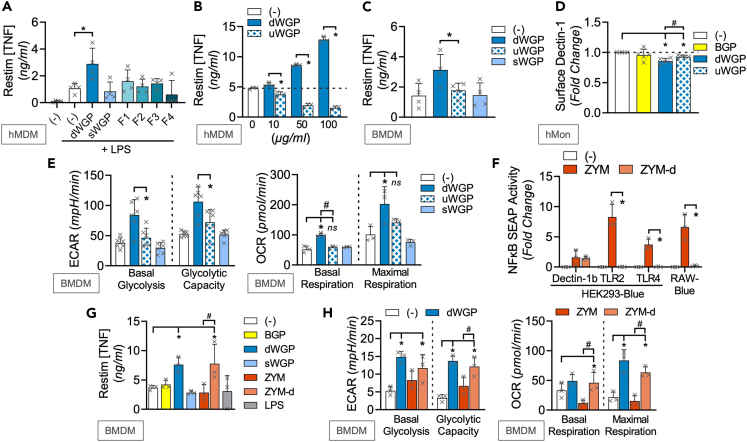
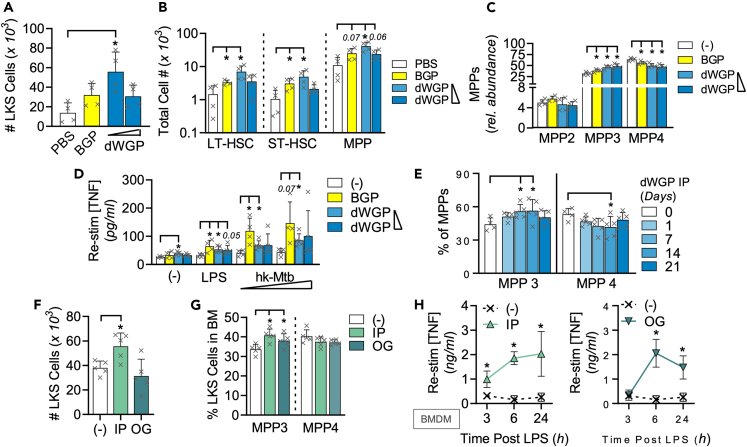
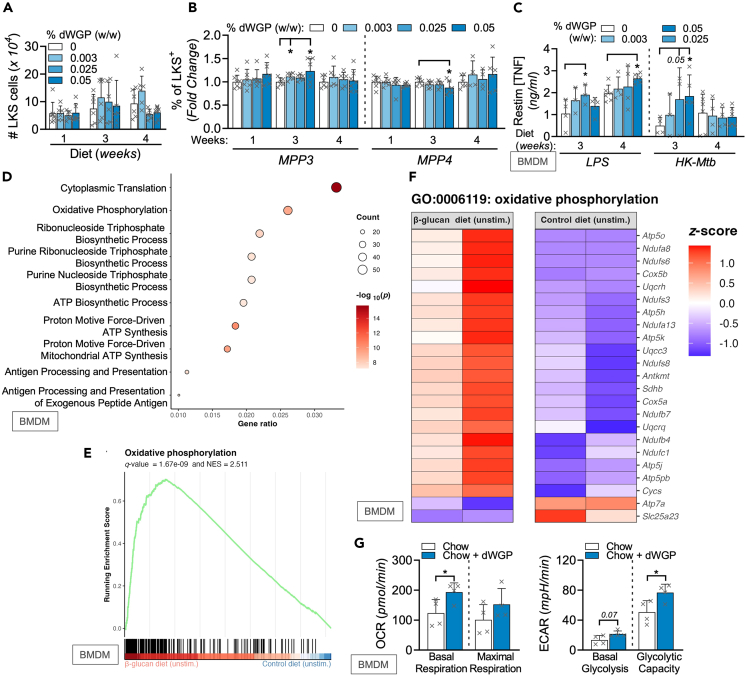
Fungal β-glucans are major drivers of trained immunity which increases long-term protection against secondary infections. Heterogeneity in β-glucan source, structure, and solubility alters interaction with the phagocytic receptor Dectin-1 and could impact strategies to improve trained immunity in humans. Using a panel of diverse β-glucans, we describe the ability of a specific yeast-derived whole-glucan particle (WGP) to reprogram metabolism and thereby drive trained immunity in human monocyte-derived macrophages in vitro and mice bone marrow in vivo. Presentation of pure, non-soluble, non-aggregated WGPs led to the formation of the Dectin-1 phagocytic synapse with subsequent lysosomal mTOR activation, metabolic reprogramming, and epigenetic rewiring. Intraperitoneal or oral administration of WGP drove bone marrow myelopoiesis and improved mature macrophage responses, pointing to therapeutic and food-based strategies to drive trained immunity. Thus, the investment of a cell in a trained response relies on specific recognition of β-glucans presented on intact microbial particles through stimulation of the Dectin-1 phagocytic response.

Keywords: Immunology; Molecular biology; Physiology.


Conflict of interest statement

M.L.E.L. is an employee of Kerry Group. F.J.S. is an applicant on an EU Priority Patent Application Patent Corporation Treaty application PI3885EPOO.

Figures

None
Graphical abstract
Figure 1
Figure 1
Different β-glucans lead to distinct macrophage memory responses (A–D) Training assay in hMDMs (A) or BMDMs (B) of cells trained with varying concentrations of the following β-glucans (BGP, Zymosan (ZYM), dispersible WGP (dWGP), soluble β-glucan derived from heat-treated dWGP (sWGP), Laminarin (LAM), Schizophyllan (SPG), Curdlan (CURD), and Pustulan (PUST) all at 1,10, and 100 μg/mL β-glucan, heat-killed Candida albicans (HKCA) at 104, 105, and 106 cells/mL, or LPS (1, 10, and 100 ng/mL). TNF production following LPS restimulation (10 ng/mL, 6 h (A) or 3 h (B)) was measured and expressed relative to untrained (−/+) control cells. (C, D) Training assay in hMDMs (C) or BMDMs (D) exposed to 5′methylthioadenosine (MTA, 1 mM) 1 h prior to training with BGP or dWGP for 24 h, washed, matured, and restimulated with LPS (10 ng/mL, 6 h). Data are mean TNF concentration or fold-change over untrained cells ± SD for n = 4 (A, C), n = 5 (B, D) independent experiments. ∗/#p < 0.05, ns or indicated p ≥ 0.05 determined using multiple comparisons testing following two-way ANOVA. See also Figure S1.
Figure 2
Figure 2
Canonical Dectin-1 signaling does not distinguish β-glucan-induced trained immunity (A) NFκB-linked SEAP activity in hDectin1b-HEK293 reporter cells incubated with the indicated β-glucans as before or LPS (10 ng/mL) or left unstimulated (−) for 6 h. (B and C) Training assay in hMDMs incubated with piceatannol (PIC; 1, 10, and 100 μM, B) or BAY-11087 (BAY, 5 μM, C) or vehicle controls (Veh) prior to training with BGP or dWGP or tolerized with LPS. Mature macrophages were restimulated with LPS (10 ng/mL, 6 h) and TNF production measured. (D) TNF production in BMDMs treated with the indicated β-glucans or LPS as before for 24 h. (E and F) NFκB-linked SEAP activity in RAW-Blue cells treated with β-glucans or left unstimulated (−) for 6 h (E) or pre-treated with cytochalasin-D (Cyt-D, 10 μM) 1 h prior to treatment with the indicated β-glucans or LPS (F). (G and H) Training assay in hMDMs (G) or BMDMs (H) pre-treated with 10 μM Cyt-D 1 h prior to β-glucans treatment. Mature macrophages were restimulated with LPS (10 ng/mL, 6 h) and TNF (G) or IL6 (H) production measured. Data are mean ± SD for n = 4 (A, B), n = 3 (C–F, H) and n = 6 (G) independent experiments. p < 0.05, ns or indicated p ≥ 0.05 determined using multiple comparisons testing following two-way ANOVA or Student’s t test (F). See also Figure S2.
Figure 3
Figure 3
β-Glucans drive long-term metabolic reprogramming for training (A and B) Extracellular lactate in BMDMs treated with indicated β-glucans (100 μg/mL) or LPS (10 ng/mL) for 24 h and measured between 24 and 72 h (A) or human monocytes (hMon) trained with dWGP or BGP (10 μg/mL) or LPS (100 ng/mL) for 24 h and measured between 72 and 144 h (B). (C and D) dWGP training assay in hMDMs pre-treated with 2 deoxyglucose (2DG, 1, 5, and 10 μM, 1 h before dWGP, C) or BMDMs pre-treated with 25 μM 2DG (D). TNF production was measured 6–24 h after restimulation with LPS (10 ng/mL). (E) Energy plots for BMDMs treated with indicated β-glucans (100 μg/mL) or LPS (10 ng/mL) between 24 and 72 h based on measurements of basal glycolysis or respiration rates. (F and G) Extracellular flux analysis in BMDMs treated with BGP, dWGP or sWGP (100 μg/mL) or LPS (10 ng/mL) for 72 h. Glycolytic traces based on extracellular acidification rates (ECAR) after inhibitor addition (OM; oligomycin and 2DG) or respiration traces based on oxygen consumption rates (OCR) after inhibitor addition (OM, FCCP, and Rot & AA; rotenone + antimycin A) shown in F. Basal and maximal rates shown in G. (H) BMDMs were treated with dWGP or sWGP (100 μg/mL) or LPS (10 ng/mL) between 24 and 144 h and mitochondrial function measured by flow cytometry using the ratio of mitotracker green (MTG, mitochondrial mass) to tetramethylrhodamine methyl ester (TMRM, mitochondrial activity). (I–K) Extracellular flux analysis in hMDMs after training with BGP, dWGP or sWGP (10 μg/mL) or LPS (10 ng/mL) for 120 h. Normalized glycolytic traces (I) and respiration traces (J) are shown after inhibitor addition. Basal and maximal rates shown in K. (L) dWGP training assay in BMDMs pre-treated with oligomycin (+OM, 20 μM). The indicated cytokines were measured after LPS restimulation (10 ng/mL, 6–24 h). All data are mean ± SD for n = 3 (A, H–L), n = 7 (C), n = 4 (D), n = 6 (E) or n = 9 (F, G) independent experiments. ∗/#p < 0.05, ns or indicated p ≥ 0.05 determined using multiple comparisons testing following one or two-way ANOVA. See also Figure S3.
Figure 4
Figure 4
mTOR-independent remodeling of TCA during dWGP training (A) Phospho-S6 (p-S6) activation was measured by flow cytometry of human monocytes (hMon) after stimulation with the indicated β-glucans (10 μg/mL) or LPS (10 ng/mL) or left unstimulated (−) for 1 h. (B) p-S6 activity in hMons treated with dWGP (10 μg/mL) or left untreated (−) between 1 and 24 h. (C) Lactate production in hMons or BMDMs pre-treated with rapamycin (Rapa, 10 nM) after training with dWGP (72 h). (D and E) dWGP training assays in hMDMs pre-treated with Rapa (10 nM, D) or Wortmannin (Wort between 0.1, 1, and 10 μM, E) and TNF production measured after LPS restimulation (10 ng/mL, 6 h). (F) dWGP training assay in BMDMs pre-treated with Rapa (10 nM). IL10 and IL6 production were measured after LPS restimulation (10 ng/mL, 24 h). (G and H) mRNA expression of the indicated genes (shown in G), from BMDMs post-stimulation with BGP, dWGP or sWGP (100 μg/mL) or LPS (10 ng/mL) for 24, 72, and 144 h. Genes measured by qPCR are expressed relative to unstimulated controls. (I) Extracellular flux analysis in BMDMs pre-treated with Rapa (10 nM, 1 h), CB-839 (CB; 1 μM, 6 h), and di-methyl-malonate (DMM, 10 mM, 3 h) or vehicle controls and subsequently treated with dWGP (100 μg/mL) for 24 h. Basal and maximal glycolytic and respiration rates were calculated as before. All data are mean ± SD for n = 3 (A–C, E, F, I), n = 4 (H) and n = 6 (D) independent experiments. ∗/#p < 0.05, ns or indicated p ≥ 0.05 determined using multiple comparisons testing following one or two-way ANOVA. See also Figure S4.
Figure 5
Figure 5
Phagocytosis of β-glucans leads to intracellular metabolic reprogramming (A and B) Surface Dectin-1 staining in human monocytes (hMon) treated with the indicated β-glucan (10 μg/mL) for 15 min measured by flow cytometry (A) or combined image-stream cytometry (B). (C) Lysotracker (LysoT) staining of permeabilized hMons after treatment with dWGP or BGP (10 μg/mL, 1–15 min) measured by combined image-stream cytometry. (D) p-S6 activity in hMons pre-treated with cytochalasin D (CytD, 100 μM), bafilomycin A1 (bafA1, 10 μM), piceatannol (PIC, 30 μM), or vehicle controls (veh) for 15 min prior to stimulation with dWGP (10 μg/mL) for 2 h. (E) dWGP Training Assay in BMDMs pre-treated with 10 μM Baf-A1 for 15 min. TNF production was measured 6 h after restimulation with LPS (10 ng/mL). (F) Extracellular flux analysis in BMDMs pre-treated with Baf-A1 (10 μM) or Cytochalasin-D (Cyt-D, 10 μM) and treated with dWGP (100 μg/mL) for 24 h. Basal and maximal glycolytic and respiration rates were calculated as before. All data are mean ± SD for n = 3 (A, D, F) or n = 4 (E) independent experiments or representative images. p < 0.05, ns or indicated p ≥ 0.05 determined using multiple comparisons testing following one or two-way ANOVA. Scale bar: 7 μm. See also Figure S5.
Figure 6
Figure 6
Phagocytosis of intact and pure yeast β-glucan particles drives trained immunity (A) Training assay in hMDMs trained with dWGP, sWGP, or the indicated soluble fractions F1-F4 (10 μg/mL) or left untrained (−). TNF production was measured 24 h after restimulation with LPS (10 ng/mL). (B and C) Training assay in hMDMs (B) or BMDMs (C) trained with dWGP or unsonicated WGP (uWGP) between 10 and 100 μg/mL. TNF production was measured 6 h after restimulation with LPS (10 ng/mL). (D) Surface Dectin-1 staining in human monocytes (hMon) incubated with the indicated β-glucan (10 μg/mL) for 15 min and measured by flow cytometry. (E) Extracellular flux analysis in BMDMs treated with the indicated WGPs (100 μg/mL) for 72 h. Basal and maximal glycolytic and respiration rates were calculated as before. (F) NFκB-linked SEAP activity in the indicated reporter cells after treatment with crude Zymosan (ZYM) or depleted Zymosan (ZYM-d) at 100 μg/mL for 6 h. (G) Training assay in BMDMs trained with the indicated β-glucans (100 μg/mL). TNF production was measured 6 h after restimulation with LPS (10 ng/mL). (H) Extracellular flux analysis in BMDMs treated with the indicated β-glucans (100 μg/mL) for 72 h. All data are mean ± SD for n = 4 (A, C), n = 3 (B, D–H) independent experiments. ∗/#p < 0.05, ns p ≥ 0.05 determined using multiple comparisons testing following one-way ANOVA or Students t tests (B). See also Figure S6.
Figure 7
Figure 7
dWGP delivery drives myeloid bone marrow reprogramming (A–C) Bone marrow cLin, c-kit+, Sca-1+ (LKS) populations in C57/BL6J mice 7-day post intraperitoneal (IP) injection of dWGP (0.2 & 0.4 mg/mouse), BGP (1 mg/mouse) or vehicle PBS. Plots show total LKS numbers per femur (A), long-term hematopoietic stem cells (LT-HSC), short-term HSCs (ST-HSC) and multipotent progenitors 1–3 (MPP) (B), or specific subsets within the MPP compartment (C). (D) TNF production 6 h after LPS stimulation (10 ng/mL, 6 h) or heat-killed Mycobacterium tuberculosis H37Ra treatment (hk-Mtb, 500–1000 μg/mL) in splenic macrophages from mice in A. (E) MPP3/MPP4 subset frequency in bone-marrow from C57/BL6J mice after IP injection with 0.2 mg dWGP for 1–21 days or PBS vehicle. (F–H) LKS populations (Total LKS; F or MPP3/4 subset frequency; (G) or TNF production in LPS (1 ng/mL) stimulated BMDM (H) from bone marrow taken from C57/BL6J 7-day post-delivery of 0.2 mg dWGP by oral gavage (OG) or IP injection or given PBS via OG. All data are mean ± SEM for n = 4–5 mice per group. ∗/#p < 0.05, or indicated p ≥ 0.05 determined using multiple comparisons testing following following one or two-way ANOVA. See also Figure S7.
Figure 8
Figure 8
dWGP-containing diets reprogram bone marrow macrophage responses (A and B) Bone marrow cLin, c-Kit+, Sca-1+ (LKS) populations in C57/BL6J mice fed a control (0% dWGP diet) for 2 weeks prior to initiation of diets supplemented with increasing concentrations of dWGP (0, 0.003%, 0.025%, 0.050% per kg chow) for the indicated weeks. Plots show total LKS cells per femur (A) or MPP3/4 subset frequency (B). (C) TNF production in BMDMs from mice fed WGP-containing diets for 3–4 weeks after stimulation with LPS (1 ng/mL) or hk-Mtb, (500 μg/mL) for 24 h. (D and E) RNA-sequencing analysis of BMDMs generated from mice fed 0.025% WGP diet for 1 week. Plots show GO enrichment (D), gene set enrichment for oxidative phosphorylation (E), and expression of associated genes (F) between unstimulated BMDMs from control or β-glucans WGP-fed mice. (G) Extracellular flux analysis in BMDMs derived from mice fed a dWGP-enriched diet (0.05%, Chow + dWGP) or control chow for 4 weeks. Basal and maximal glycolytic and respiration rates were calculated as before. Data are mean ± SD for n = 6–8 (A–C) or n = 2 (D, E) or n = 3 (G) mice per group. ∗p < 0.05 or indicated p ≥ 0.05 determined using multiple comparisons testing following mixed effect model (A–C) or Student’s t tests (D–G). Log10 p values, Z scores and enrichment scores for RNA-sequencing are indicated on plots. See also Figure S8.

References

    1. Iwasaki A., Omer S.B. Why and How Vaccines Work. Cell. 2020;183:290–295. doi: 10.1016/j.cell.2020.09.040. - DOI - PMC - PubMed
    1. Natoli G., Ostuni R. Adaptation and memory in immune responses. Nat. Immunol. 2019;20:783–792. doi: 10.1038/s41590-019-0399-9. - DOI - PubMed
    1. Netea M.G., Domínguez-Andrés J., Barreiro L.B., Chavakis T., Divangahi M., Fuchs E., Joosten L.A.B., van der Meer J.W.M., Mhlanga M.M., Mulder W.J.M., et al. Defining trained immunity and its role in health and disease. Nat. Rev. Immunol. 2020;20:375–388. doi: 10.1038/s41577-020-0285-6. - DOI - PMC - PubMed
    1. Quintin J., Saeed S., Martens J.H.A., Giamarellos-Bourboulis E.J., Ifrim D.C., Logie C., Jacobs L., Jansen T., Kullberg B.J., Wijmenga C., et al. Candida albicans infection affords protection against reinfection via functional reprogramming of monocytes. Cell Host Microbe. 2012;12:223–232. doi: 10.1016/j.chom.2012.06.006. - DOI - PMC - PubMed
    1. Camilli G., Tabouret G., Quintin J. The Complexity of Fungal beta-Glucan in Health and Disease: Effects on the Mononuclear Phagocyte System. Front. Immunol. 2018;9:673. doi: 10.3389/fimmu.2018.00673. - DOI - PMC - PubMed