. 2023 Oct 25;9(1):100-116.
doi: 10.1016/j.jacbts.2023.08.005. eCollection 2024 Jan.

Endothelial Overexpression of TGF-β-Induced Protein Impairs Venous Thrombus Resolution: Possible Role in CTEPH

Affiliations

Endothelial Overexpression of TGF-β-Induced Protein Impairs Venous Thrombus Resolution: Possible Role in CTEPH

Magdalena L Bochenek et al. JACC Basic Transl Sci. .

Abstract

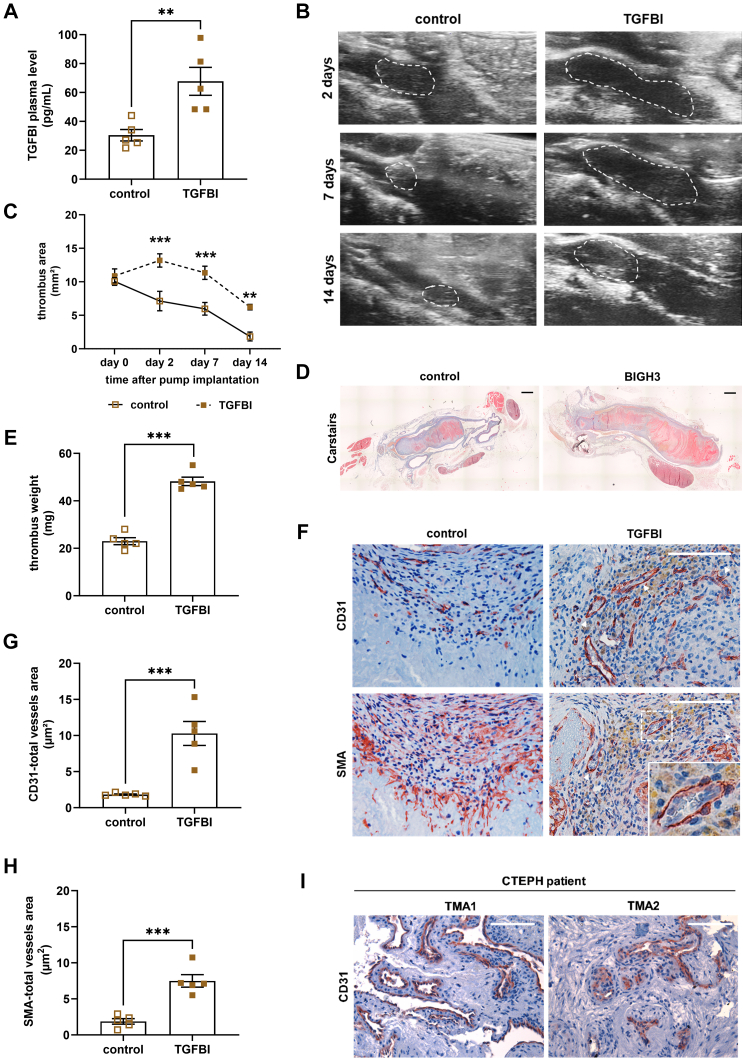
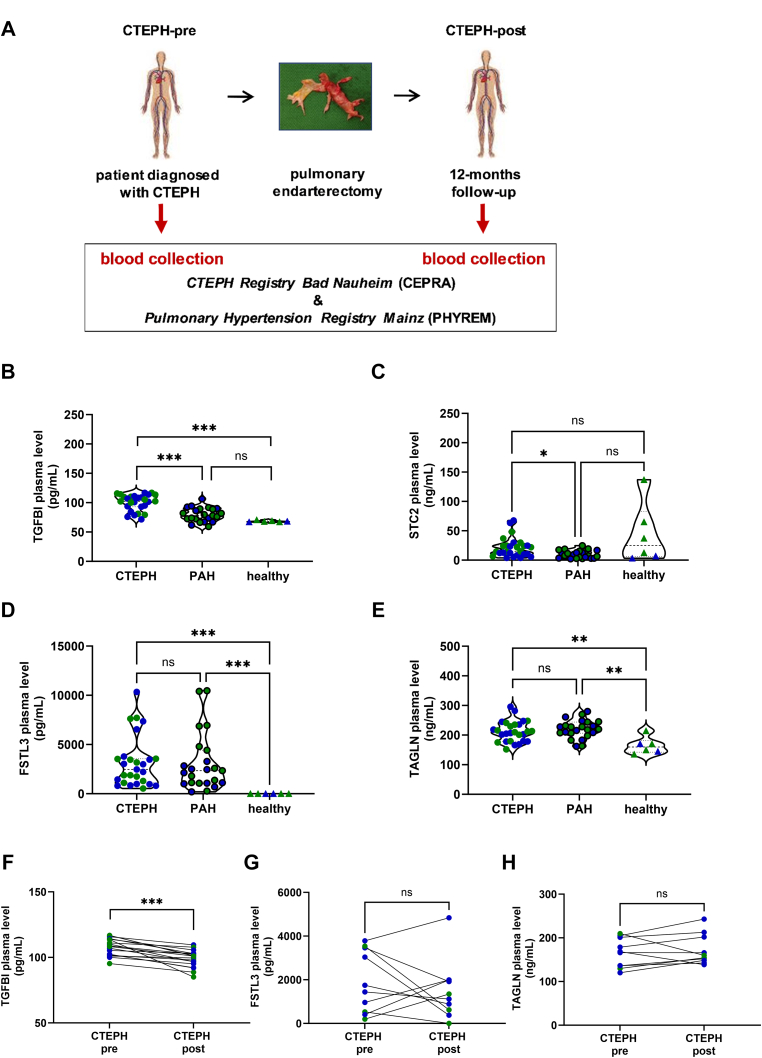
Endothelial cells play a critical role during venous thrombus remodeling, and unresolved, fibrotic thrombi with irregular vessels obstruct the pulmonary artery in patients with chronic thromboembolic pulmonary hypertension (CTEPH). This study sought to identify endothelial mediators of impaired venous thrombus resolution and to determine their role in the pathogenesis of the vascular obstructions in patients with CTEPH. Endothelial cells outgrown from pulmonary endarterectomy specimens (PEA) were processed for mRNA profiling, and nCounter gene expression and immunohistochemistry analysis of PEA tissue microarrays and immunoassays of plasma were used to validate the expression in CTEPH. Lentiviral overexpression in human pulmonary artery endothelial cells (HPAECs) and exogenous administration of the recombinant protein into C57BL/6J mice after inferior Vena cava ligation were employed to assess their role for venous thrombus resolution. RT2 PCR profiler analysis demonstrated the significant overexpression of factors downstream of transforming growth factor beta (TGFβ), that is TGFβ-Induced Protein (TGFBI or BIGH3) and transgelin (TAGLN), or involved in TGFβ signaling, that is follistatin-like 3 (FSTL3) and stanniocalcin-2 (STC2). Gene expression and immunohistochemistry analysis of tissue microarrays localized potential disease candidates to vessel-rich regions. Lentiviral overexpression of TGFBI in HPAECs increased fibrotic remodeling of human blood clots in vitro, and exogenous administration of recombinant TGFBI in mice delayed venous thrombus resolution. Significantly elevated plasma TGFBI levels were observed in patients with CTEPH and decreased after PEA. Our findings suggest that overexpression of TGFBI in endothelial promotes venous thrombus non-resolution and fibrosis and is causally involved in the pathophysiology of CTEPH.

Keywords: chronic thromboembolic pulmonary hypertension; endothelium; fibrosis; thrombosis; transforming growth factor beta-induced.


Conflict of interest statement

This study was supported by the Bundesministerium für Bildung und Forschung (BMBF 01E01003; Virchow fellowship and TRP-X15 to Dr Bochenek), the Deutsches Zentrum für Herz-Kreislauf-Forschung (cooperation with DZHK Shared-Expertise [SE]-105 and SE-006 to Drs Saar and Bochenek) and the Deutsche Forschungsgemeinschaft (Sonderforschungsbereich 1531, A9 to Dr Saar; project number 456687919). Drs Münzel, Schober, Hübner, and Schäfer are principal investigators of the Deutsches Zentrum für Herz-Kreislauf-Forschung. All other authors have reported that they have no relationships relevant to the contents of this paper to disclose.

Figures

None
Graphical abstract
Figure 1
Figure 1
Validation of Selected Genes With the Use of RT2 Profiler PCR Array and qPCR Analysis (A) Schematic representation of the experimental flow, including the cultivation of chronic thromboembolic pulmonary hypertension (CTEPH) endothelial cells (ECs) from pulmonary endarterectomy (PEA) specimens and preparation for further analysis. (B to I) Real-time qPCR analysis (using custom-designed RT2 Profiler PCR assay or qPCR with custom oligonucleotides) of CTEPH-ECs (7 biological repeats) compared with human pulmonary arterial endothelial cells (HPAECs) (3 biological repeats) for genes (B) involved in extracellular matrix organization (ie, CD44 molecule [CD44], collagen type 1 alpha 1 chain-(COL1A1), collagen type 1 alpha 2 chain [COL1A2], collagen type 3 alpha 1 chain [COL3A1], collagen type 6 alpha 3 chain [COL6A3], fibrillin 2 [FBN2], matrix metalloproteinase 1 [MMP1], and nidogen 1 [NID1]) or belonging to the biological pathways (C) hemostasis (ie, ADAM metallopeptidase with thrombospondin type 1 motif 13 [ADAMTS13], C-X-C motif chemokine ligand 8 [CXCL8 or IL8], selectin E [CD62E], selectin P [CD62P], endothelial protein C receptor [PROCR], coagulation factor III [F3], plasminogen activator inhibitor-1 [PAI-1], serpin family G member 1 [SERPING1], von Willebrand factor [VWF], transgelin [TAGLN], tissue factor pathway inhibitor [TFPI], tissue-type plasminogen activator [TPA], and thrombomodulin [THBD]), (D) signal transduction (ie, smooth muscle α-actin [ACTA2], chemokine C-X-C motif ligand 6 [CXCL6], Dickkopf-related protein 1 [DKK1], Gata-binding protein 3 [GATA3], neurogenic locus Notch homolog protein 3 [NOTCH3], and thrombospondin [THBS2]), (E) immune system (ie, C-C motif chemokine ligand 2 [CCL2], cathepsin K [CTSK], cathepsin S [CTSS], intercellular adhesion molecule-1 [ICAM1], interleukin-1β [IL1B], IL6, tumor necrosis factor-α-induced protein 3 [TNFAIP3], TNF receptor superfamily member 1B [TNFRSF1B], vascular cell adhesion molecule-1 [VCAM1]), (F) metabolism (ie, lipase H [LIPH], lymphatic vessel endothelial hyaluronan receptor 1 [LYVE1], prostaglandin 2 [PTGIS], prostaglandin endoperoxide synthase 1 [PTGS1], and Shisa family member 3 [SHISA3]), (G) metabolism of proteins (ie, ADAM metallopeptidase with thrombospondin type 1 motif 18 [ADAMTS18], pappalysin 1 [PAPPA], syndecan 2 [SDC2], stanniocalcin 2 [STC2], and transforming growth factor-β-induced [TGFBI]), and (H) cell cycle control (ie, cyclin A1 [CCNA1], cyclin D2 [CCND2], and cyclin-dependent kinase 6 [CDK6]), as well as (I) playing a role in TGFβ signaling (ie, bone morphogenetic protein and activin membrane bound inhibitor [BAMBI], follistatin like protein 3 [FSTL3], periostin [POSTN], transforming growth factor-β1 [TGFB1], and TGFB2). Quantitative data are presented as mean ± SEM. P values were determined with the use of Student’s t-test for normally distributed values (ACTA2, ADAMTS13, DKK1, F3, FBN2, LIPH, NID1, PAI-1, PTGIS, PTGS1, POSTN, SDC2, THBS2, TFPI, TNFRSF1B, and VWF) and Mann-Whitney U-test for values that did not pass the normality test (ADAMTS18, BAMBI, BIGH3, CCL2, CCNA1, CCND2, CD44, CD62E, CD62P, CDK6, COL1A1, COL1A2, COL3A1, COL6A3, CTSK, CTSS, CXCL6, CXCL8, FSTL3, GATA3, ICAM1, IL1B, IL6, LYVE1, MMP1, NOTCH3, PAPPA, PROCR, SERPING1, SHISA3, STC2, TAGLN, TGFB1, TGFB2, THBD, TNFAIP3, TPA, and VCAM1) and are shown within the graph: ∗P < 0.05; ns = nonsignificant. Data points in blue are from male patients, green from female patients.
Figure 2
Figure 2
Histologic Localization of Selected Genes in PEA Tissue Microarrays (A) Flowchart showing consecutive steps to histologically localize selected genes to specific areas in CTEPH PEA specimens. Laser microdissection and nCounter analysis of mRNA expression levels of (B) TGFBI, (C) FSTL3, (D) STC2, and (E) TAGLN in PEA specimens isolated from 4 CTEPH patients. Quantitative data are presented as mean ± SEM, and P values were determined by comparing findings in vessels area with all other areas (3 comparisons) by means of 1-way ANOVA followed by Bonferroni’s multiple comparisons test for normally distributed values (B, D, E). Values that did not pass the normality test are presented as median with IQR, and P values were determined by means of Kruskal-Wallis test (C). ∗P < 0.05; ∗∗∗P < 0.001; ns = nonsignificant. (F) Representative images after immunohistochemical staining of TGFBI, FSTL3, STC2, and TAGLN on tissue microarrays from patients with CTEPH (PEA material: TMA1 and TMA2), pulmonary arterial hypertension (PAH; lung biopsies) or idiopathic pulmonary fibrosis (IPF; lung biopsies). Insets show higher magnification of selected areas of interest. Scale bars represent 100 μm; scale bars in insets represent 10 μm. Semiquantitative analysis of (G) TGFBI and (H) STC2 expression in tissue. Quantitative data are presented as mean ± SEM, and P values were determined by comparing the mean of each group with the mean of every other group (3 comparisons) by means of 1-way ANOVA followed by Bonferroni’s multiple comparisons test. ∗∗∗P < 0.001; ns = nonsignificant. (I) Representative confocal images of (left) CD31-positive cells (green) expressing TGFBI (red) and (right) STC2 (red) on cryopreserved CTEPH PEA tissue. Scale bars represent 50 μm. Abbreviations as in Figure 1.
Figure 3
Figure 3
Overexpression of TGFBI in HPAECs Promotes the Expression of Genes Similar to CTEPH-ECs and Results in Larger Human Blood Clots (A) Representative immunofluorescence images and (B) quantitative analysis of the mean fluorescent intensity of HPAECs in culture after treatment with control lentiviral particles (lentiviral control) or lentiviral particles containing human TGFBI (TGFBI lentiviral particles) and immunostaining for TGFBI (red) and DAPI (blue). Quantitative data are presented as mean ± SEM. ∗∗∗P < 0.001 (Student’s t-test). Scale bars represent 10 μm. (C) Quantitative RT2 Profiler PCR array analysis confirmed significantly increased expression of TGFBI and also revealed significant changes of genes belonging to the biological pathways signal transduction (ACTA2), metabolism of proteins (STC2), cell cycle control (CCND2), hemostasi’ (TAGLN), and metabolism (PTGIS) and genes involved in TGFβ signaling (FSTL3) and extracellular matrix organization (COL1A1) in HPAECs overexpressing TGFBI (n = 3 experimental repeats; female donor). Data are expressed as fold change vs lentiviral control cells. Quantitative data are presented as mean ± SEM. ∗P < 0.05; ∗∗P < 0.01; ∗∗∗P < 0.001 (Student’s t-test). (D) Weight of blood clots generated in vitro followed by addition of HPAECs expressing lentiviral TGFBI or control and incubation for 14 days (n = 3 biological repeats and 2 experimental repeats). Quantitative data are presented as mean ± SEM. ∗P < 0.05 (Student’s t-test). (E and G) Representative immunohistochemical images of human blood clots after immunostaining of the endothelial marker VE-cadherin (CDH5) and the results of the quantitative analysis of the total vessel area after addition of HPAECs (F) overexpressing TGFBI or (H) stimulated with recombinant TGFBI. Scale bars represent 10 μm. Quantitative data are presented as mean ± SEM. ∗P < 0.05; ∗∗∗P < 0.001 (Student’s t-test). (I) Representative immunohistochemical images and (J) results of the quantitative analysis of human blood clots mixed with human ECs overexpressing lentiviral TGFBI or control after immunostaining of the mesenchymal marker smooth muscle actin (SMA). Scale bars represent 10 μm. Quantitative data are presented as mean ± SEM. ∗∗P < 0.01 (Student’s t-test). Real-time qPCR analysis to detect the transcription factors (K) SNAI2, (L) TWIST, and (M) ZEB1 in HPAECs overexpressing TGFBI or in lentiviral control cells. Data were normalized to the housekeeping gene HPRT1. Quantitative data are presented as mean ± SEM and compared by means of Student’s t-test (K and M), or as median with IQR and compared by means of Mann-Whitney U-test (L). ∗P < 0.05; ∗∗∗P < 0.001; ns = nonsignificant. Abbreviations as in Figure 1.
Figure 4
Figure 4
Exogenous Administration of TGFBI to Male C57BL/6J Mice After Inferior Vena Cava Ligation Delays Venous Thrombus Resolution and Promotes Irregularly Vascularized, Fibrotic Thrombi (A) Results of the quantitative analysis using enzyme-linked immunosorbent assay (n = 5 biological repeats per group) of plasma levels of total (endogenous and recombinant) TGFBI in C57BL/6J mice implanted with osmotic pumps containing recombinant TGFBI or vehicle (NaCl; control). Quantitative data are presented as mean ± SEM. ∗∗P < 0.01 (Student’s t-test). (B) Representative ultrasound images of venous thrombi in mice subjected to inferior Vena cava ligation followed by implantation of osmotic pumps containing either recombinant TGFBI or vehicle alone (NaCl; control). (C) Quantitative analysis of the absolute thrombus size (in mm2; 5 biological repeats; at day 2 after implantation 2 mice from the control group and 1 mouse from the TGFBI-treated group were not examined. Quantitative data are presented as mean ± SEM, P values were determined by comparing findings in TGFBI-treated mice with those in control-treated mice at the same time point by means of 2-way ANOVA followed by Sidak’s multiple comparisons test (4 comparisons). ∗∗P < 0.01; ∗∗∗P < 0.001. (D) Representative images following Carstairs staining of longitudinal sections through isolated IVC segments. Scale bars represent 100 μm. (E) Summary of thrombus weights 2 weeks after pump implantation. Quantitative data are presented as mean ± SEM. ∗∗∗P < 0.001 (Student’s t-test). (F) Representative immunohistochemical images showing CD31-positive endothelial cells and smooth muscle actin (SMA)–positive mesenchymal cells on neighboring sections. Scale bars represent 100 μm. Quantitative analysis of the total vessel area, defined as a lumen (G) covered by CD31-positive ECs or (H) surrounded by SMA-positive mesenchymal cells. Quantitative data are presented as mean ± SEM. ∗∗∗P < 0.001 (Student’s t-test). (I) Representative immunohistochemical images of 2 examples of CTEPH tissue microarrays (TMA1 and TMA2) showing CD31-positive endothelial cells. Scale bars represent 10 μm. Abbreviations as in Figure 1.
Figure 5
Figure 5
Plasma Levels of TGFBI, STC2, FSTL3, and TAGLN in Patients With CTEPH, Patients With PAH, and Healthy Control Subjects (A) Flowchart showing steps of blood analyses in patients with CTEPH enrolled in the CTEPH Registry Bad Nauheim, before and at 12-month follow-up after PEA and in patients with PAH enrolled in the Pulmonary Hypertension Registry Mainz. Results of the quantitative analysis using specific enzyme-linked immunosorbent assay (ELISA) of plasma levels of (B) TGFBI, (C) STC2, (D) FSTL3, and (E) TAGLN in patients with CTEPH (n = 27) compared with patients with PAH (n = 23) or healthy control individuals (n = 6). Quantitative data are presented as violin plot (showing all points). P values were determined by comparing the mean of each group with the mean of every other group (3 comparisons) by means of 1-way ANOVA followed by Bonferroni’s multiple comparisons test for normally distributed values (E) or Kruskal-Wallis test followed by Dunn’s multiple comparisons test for values which did not pass the normality test (B, C, D). ∗P < 0.05; ∗∗P < 0.01; ∗∗∗P < 0.001; ns = nonsignificant. Results of the quantitative analysis using ELISA of plasma levels of (F) TGFBI (n = 18), (G) FSTL3 (n = 10), and (H) TAGLN (n = 10) in patients with CTEPH, before (CTEPH pre) and at 12-month follow-up after PEA surgery (CTEPH post). Quantitative data are presented as symbols and lines. P values were determined with the use of paired Student’s t-test (F) or Wilcoxon matched-pairs signed rank test (G, H). ∗∗∗P < 0.001; ns = nonsignificant. Data points in blue are for male patients, in green for female.

References

    1. Delcroix M., Torbicki A., Gopalan D., et al. ERS statement on chronic thromboembolic pulmonary hypertension. Eur Respir J. 2021;57 - PubMed
    1. Humbert M., Kovacs G., Hoeper M.M., et al. 2022 ESC/ERS guidelines for the diagnosis and treatment of pulmonary hypertension. Eur Heart J. 2022;43:3618–3731. - PubMed
    1. Bochenek M.L., Rosinus N.S., Lankeit M., et al. From thrombosis to fibrosis in chronic thromboembolic pulmonary hypertension. Thromb Haemost. 2017;117:769–783. - PubMed
    1. Hobohm L., Kolmel S., Niemann C., et al. Role of angiopoietin-2 in venous thrombus resolution and chronic thromboembolic disease. Eur Respir J. 2021;58 - PubMed
    1. Bochenek M.L., Schäfer K. Role of endothelial cells in acute and chronic thrombosis. Hamostaseologie. 2019;39:128–139. - PubMed