

Flower colour and size-signals vary with altitude and resulting climate on the tropical-subtropical islands of Taiwan
- PMID: 38362451
- PMCID: PMC10867191
- DOI: 10.3389/fpls.2024.1304849
Flower colour and size-signals vary with altitude and resulting climate on the tropical-subtropical islands of Taiwan
Abstract
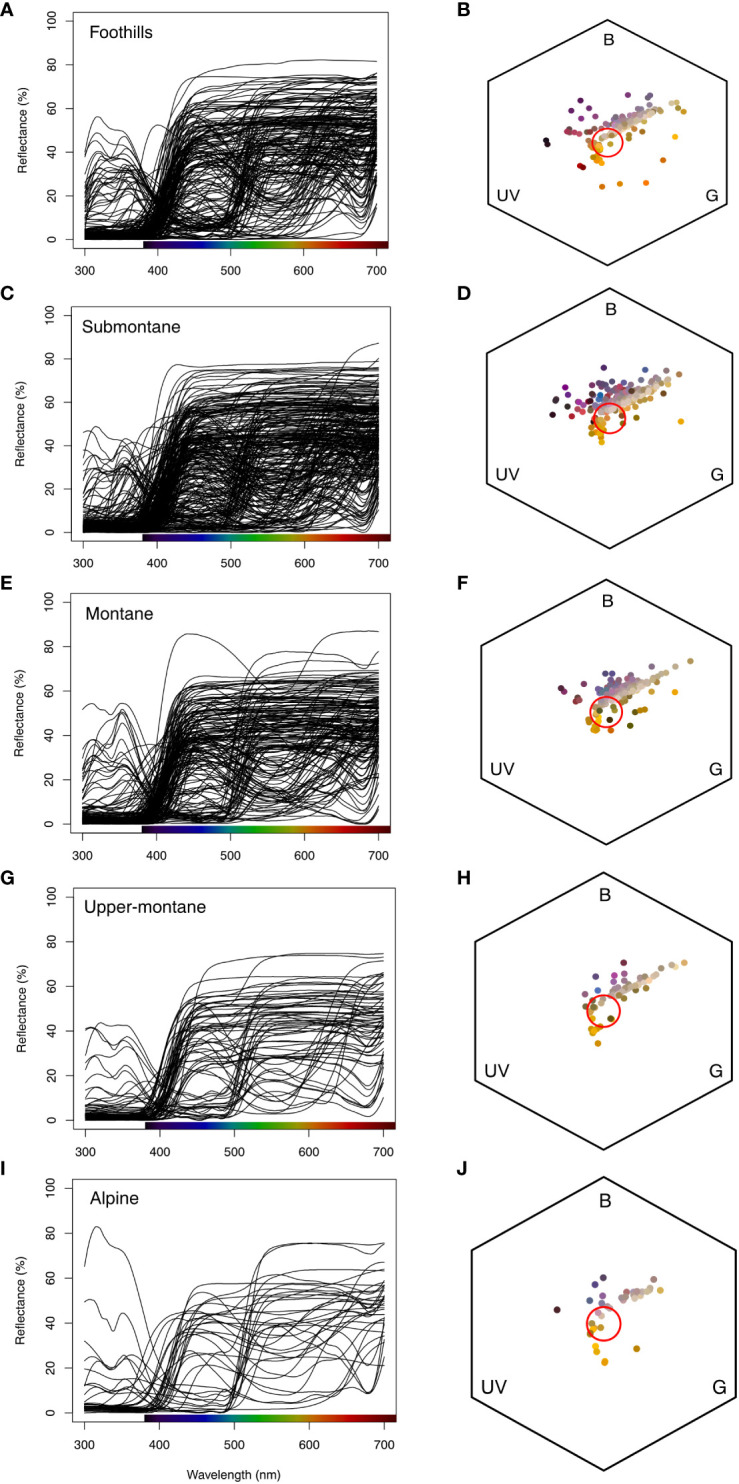
The diversity of flower colours in nature provides quantifiable evidence for how visitations by colour sensing insect pollinators can drive the evolution of angiosperm visual signalling. Recent research shows that both biotic and abiotic factors may influence flower signalling, and that harsher climate conditions may also promote salient signalling to entice scarcer pollinators to visit. In parallel, a more sophisticated appreciation of the visual task foragers face reveals that bees have a complex visual system that uses achromatic vision when moving fast, whilst colour vision requires slower, more careful inspection of targets. Spectra of 714 native flowering species across Taiwan from sea level to mountainous regions 3,300 m above sea level (a.s.l.) were measured. We modelled how the visual system of key bee pollinators process signals, including flower size. By using phylogenetically informed analyses, we observed that at lower altitudes including foothills and submontane landscapes, there is a significant relationship between colour contrast and achromatic signals. Overall, the frequency of flowers with high colour contrast increases with altitude, whilst flower size decreases. The evidence that flower colour signaling becomes increasingly salient in higher altitude conditions supports that abiotic factors influence pollinator foraging in a way that directly influences how flowering plants need to advertise.
Keywords: colour contrast; flora; flower colour; green contrast; insect; islands; vision.
Copyright © 2024 Shrestha, Tai, Dyer, Garcia, Yang, Jentsch and Wang.
Conflict of interest statement
The authors declare that the research was conducted in the absence of any commercial or financial relationships that could be construed as a potential conflict of interest. The author(s) declared that they were an editorial board member of Frontiers, at the time of submission. This had no impact on the peer review process and the final decision.
Figures


Similar articles
-
Flower colour and size signals differ depending on geographical location and altitude region.Plant Biol (Stuttg). 2021 Nov;23(6):905-914. doi: 10.1111/plb.13326. Epub 2021 Sep 21. Plant Biol (Stuttg). 2021. PMID: 34546624
-
Australian native flower colours: Does nectar reward drive bee pollinator flower preferences?PLoS One. 2020 Jun 11;15(6):e0226469. doi: 10.1371/journal.pone.0226469. eCollection 2020. PLoS One. 2020. PMID: 32525873 Free PMC article.
-
Floral Color Diversity: How Are Signals Shaped by Elevational Gradient on the Tropical-Subtropical Mountainous Island of Taiwan?Front Plant Sci. 2020 Dec 17;11:582784. doi: 10.3389/fpls.2020.582784. eCollection 2020. Front Plant Sci. 2020. PMID: 33391297 Free PMC article.
-
The modelling of flower colour: spectral purity or colour contrast as biologically relevant descriptors of flower colour signals for bees depending upon the perceptual task.Plant Biol (Stuttg). 2024 Oct;26(6):896-910. doi: 10.1111/plb.13682. Epub 2024 Jul 3. Plant Biol (Stuttg). 2024. PMID: 38958933 Review.
-
Flower colour contrast, 'spectral purity' and a red herring.Plant Biol (Stuttg). 2025 Mar;27(2):189-194. doi: 10.1111/plb.13767. Epub 2025 Jan 27. Plant Biol (Stuttg). 2025. PMID: 39871498 Free PMC article. Review.
Cited by
-
Green flowers need yellow to get noticed in a green world.Ann Bot. 2025 Aug 16;135(7):1281-1292. doi: 10.1093/aob/mcae213. Ann Bot. 2025. PMID: 39658083 Free PMC article.
-
Biomass Allocation in Gentianella turkestanorum is Driven by Environmental Factors and Functional Traits.Plants (Basel). 2024 Dec 11;13(24):3463. doi: 10.3390/plants13243463. Plants (Basel). 2024. PMID: 39771162 Free PMC article.
-
Color-advertising strategies of invasive plants through the bee eye.Front Plant Sci. 2024 May 22;15:1393204. doi: 10.3389/fpls.2024.1393204. eCollection 2024. Front Plant Sci. 2024. PMID: 38841283 Free PMC article.
References
-
- Arnold S. E. J., Savolainen V., Chittka L. (2009). Flower colours along an alpine altitude gradient, seen through the eyes of fly and bee pollinators. Arthropod-Plant Interact. 3, 27–43. doi: 10.1007/s11829-009-9056-9 - DOI
-
- (2021) Flora of China. Available at: http://www.efloras.org (Accessed November 10, 2021).
-
- (2021) Flora of Taiwan. Available at: https://tai2.ntu.edu.tw (Accessed November 10, 2021).
-
- (2021) kplant. Available at: http://kplant.biodiv.tw (Accessed November 10, 2021).
Associated data
LinkOut - more resources
Full Text Sources