

Genome-wide transcriptome profiling reveals molecular response pathways of Trichoderma harzianum in response to salt stress
- PMID: 38362502
- PMCID: PMC10867199
- DOI: 10.3389/fmicb.2024.1342584
Genome-wide transcriptome profiling reveals molecular response pathways of Trichoderma harzianum in response to salt stress
Abstract
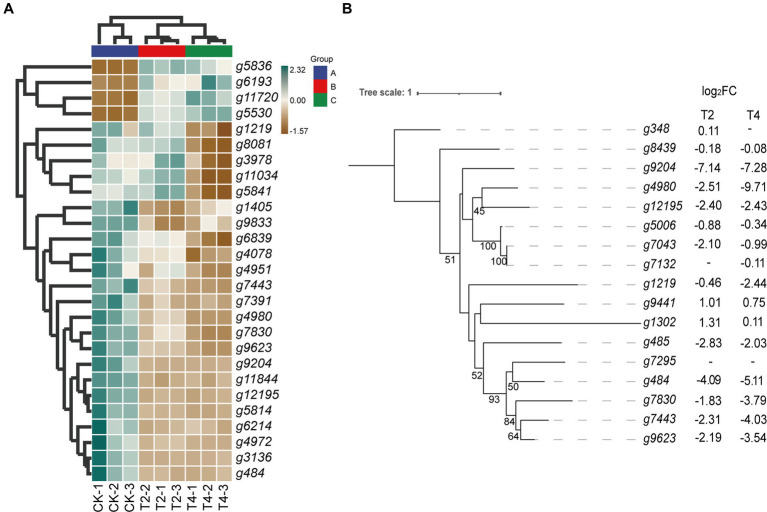
Trichoderma harzianum exhibits a strong biological control effect on many important plant pathogens, such as Fusarium oxysporum, Botrytis cinerea, and Meloidogyne. However, its biocontrol effectiveness is weakened or reduced under salt stress. The aim of this study was to investigate the molecular response of T. harzianum to salt stress at the whole-genome level. Here, we present a 44.47 Mb near-complete genome assembly of the T. harzianum qt40003 strain for the first time, which was assembled de novo with 7.59 Gb Nanopore sequencing long reads (~170-fold) and 5.2 Gb Illumina short reads (~116-fold). The assembled qt40003 genome contains 12 contigs, with a contig N50 of 4.81 Mb, in which four of the 12 contigs were entirely reconstructed in a single chromosome from telomere to telomere. The qt40003 genome contains 4.27 Mb of repeat sequences and 12,238 protein-coding genes with a BUSCO completeness of 97.5%, indicating the high accuracy and completeness of our gene annotations. Genome-wide transcriptomic analysis was used to investigate gene expression changes related to salt stress in qt40003 at 0, 2% (T2), and 4% (T4) sodium chloride concentrations. A total of 2,937 and 3,527 differentially expressed genes (DEGs) were obtained under T2 and T4 conditions, respectively. GO enrichment analysis showed that the T2-treatment DEGs were highly enriched in detoxification (p < 0.001), while the T4 DEGs were mainly enriched in cell components, mostly in cellular detoxification, cell surface, and cell wall. KEGG metabolic pathway analysis showed that 91 and 173 DEGs were significantly enriched in the T2 and T4 treatments, respectively (p < 0.01), mainly in the glutathione metabolism pathway. We further experimentally analyzed the differentially expressed glutathione transferase genes in the glutathione metabolic pathway, most of which were downregulated (13/15). In addition, we screened 13 genes related to active oxygen clearance, including six upregulated and seven downregulated genes, alongside five fungal hydrophobic proteins, of which two genes were highly expressed. Our study provides high-quality genome information for the use of T. harzianum for biological control and offers significant insights into the molecular responses of T. harzianum under salt-stress conditions.
Keywords: NaCl; genome; metabolic; salt tolerance mechanism; transcriptomic.
Copyright © 2024 Yang, Mao, Hao, Zheng, Zhao, Li, Yang, Xie, Ling and Li.
Conflict of interest statement
The authors declare that the research was conducted in the absence of any commercial or financial relationships that could be construed as a potential conflict of interest.
Figures


Similar articles
-
Identification of Mycoparasitism-Related Genes against the Phytopathogen Botrytis cinerea via Transcriptome Analysis of Trichoderma harzianum T4.J Fungi (Basel). 2023 Mar 6;9(3):324. doi: 10.3390/jof9030324. J Fungi (Basel). 2023. PMID: 36983492 Free PMC article.
-
Genome and transcriptome sequencing of Trichoderma harzianum T4, an important biocontrol fungus of Rhizoctonia solani, reveals genes related to mycoparasitism.Can J Microbiol. 2024 Mar 1;70(3):86-101. doi: 10.1139/cjm-2023-0148. Epub 2024 Feb 5. Can J Microbiol. 2024. PMID: 38314685
-
Whole RNA-sequencing and gene expression analysis of Trichoderma harzianum Tr-92 under chlamydospore-producing condition.Genes Genomics. 2019 Jun;41(6):689-699. doi: 10.1007/s13258-019-00812-y. Epub 2019 Apr 9. Genes Genomics. 2019. PMID: 30968334
-
Molecular Programming of Drought-Challenged Trichoderma harzianum-Bioprimed Rice (Oryza sativa L.).Front Microbiol. 2021 Apr 13;12:655165. doi: 10.3389/fmicb.2021.655165. eCollection 2021. Front Microbiol. 2021. PMID: 33927706 Free PMC article.
-
Identification of mycoparasitism-related genes in Trichoderma harzianum T4 that are active against Colletotrichum musae.Arch Microbiol. 2023 Dec 20;206(1):29. doi: 10.1007/s00203-023-03767-7. Arch Microbiol. 2023. PMID: 38117327
References
-
- Ahmad P., Hashem A., Abd-Allah E. F., Alqarawi A. A., John R., Egamberdieva D., et al. . (2015). Role of Trichoderma harzianum in mitigating NaCl stress in Indian mustard (Brassica juncea L) through antioxidative defense system. Front. Plant Sci. 6:868. doi: 10.3389/fpls.2015.00868, PMID: - DOI - PMC - PubMed
LinkOut - more resources
Full Text Sources
Miscellaneous