. 2024 Mar 12;24(6):1808-1820.
doi: 10.1039/d3lc00824j.

Immune cells and inflammatory mediators cause endothelial dysfunction in a vascular microphysiological system

Affiliations

Immune cells and inflammatory mediators cause endothelial dysfunction in a vascular microphysiological system

Aishwarya Rengarajan et al. Lab Chip. .

Abstract

Functional assessment of endothelium serves as an important indicator of vascular health and is compromised in vascular disorders including hypertension, atherosclerosis, and preeclampsia. Endothelial dysfunction in these cases is linked to dysregulation of the immune system involving both changes to immune cells and increased secretion of inflammatory cytokines. Herein, we utilize a well-established microfluidic device to generate a 3-dimensional vascular microphysiological system (MPS) consisting of a tubular blood vessel lined with human umbilical vein endothelial cells (HUVECs) to evaluate endothelial function measured via endothelial permeability and Ca2+ signaling. We evaluated the effect of a mixture of factors associated with inflammation and cardiovascular disease (TNFα, VEGF-A, IL-6 at 10 ng ml-1 each) on vascular MPS and inferred that inflammatory mediators contribute to endothelial dysfunction by disrupting the endothelial barrier over a 48 hour treatment and by diminishing coordinated Ca2+ activity over a 1 hour treatment. We also evaluated the effect of peripheral blood mononuclear cells (PBMCs) on endothelial permeability and Ca2+ signaling in the HUVEC MPS. HUVECs were co-cultured with PBMCs either directly wherein PBMCs passed through the lumen or indirectly with PBMCs embedded in the supporting collagen hydrogel. We revealed that phytohemagglutinin (PHA)-M activated PBMCs cause endothelial dysfunction in MPS both through increased permeability and decreased coordinated Ca2+ activity compared to non-activated PBMCs. Our MPS has potential applications in modeling cardiovascular disorders and screening for potential treatments using measures of endothelial function.


Conflict of interest statement

CONFLICTS OF INTEREST

D. J. B. holds equity in BellBrook Labs LLC, Tasso Inc. Stacks to the Future LLC, Lynx Biosciences LLC, Onexio Biosystems LLC, Flambeau Diagnostics LLC, and Salus Discovery LLC. The remaining authors declare no competing financial interests.

Figures

Fig 1.
Fig 1.. HUVEC MPS preparation and staining for endothelial markers.
a) Schematic demonstrating normal vessel and inflamed vessels exposed to inflammatory cytokines or immune cells. b,c) Staining of HUVEC MPS with endothelial marker CD31 and junctional protein VE-cadherin. Nucleus stained with Hoechst 33342. d) Schematic depicting the structure of the device used for the MPS and the steps involved in MPS preparation.
Fig 2.
Fig 2.. HUVEC MPS show increased permeability upon treatment with inflammatory cocktail (mix 48h).
a) Schematic shows steps involved in measuring permeability of HUVEC MPS using diffusion of a 70kDa fluorescent dye. MPS was loaded with 1 μM 70kDa dextran dye and images were taken every 5 minutes for 15 minutes to track diffusion of dye. Plots for fluorescent intensity in the cross-section and mean permeability are calculated. b) Representative mages of HUVEC MPS fluorescence (above) and intensity plots (below) upon addition of 70kDa dextran red for different conditions. The outer bounds of lumen are marked by vertical dashed lines. c) Box plots for permeability data are plotted for HUVEC MPS for unstimulated control (Control; n=43), inflammatory cytokine mix (48h Mix; n=11), cAMP (n=36), or devoid of HUVEC (Cell-free control; n=14). Statistics was performed using t-test, **p<0.01 vs Control, ***p<0.001 vs Control.
Fig 3.
Fig 3.. Inflammatory cytokine mix leads to increased secretion of VEGF-C, uPA and G-CSF in HUVEC MPS.
a) Schematic of conditioned media collection and multiplex assay. b) Graph shows average concentration of growth factors in conditioned media collected from HUVEC MPS (control and mix). Statistics was performed using t-test. c) Graph shows average concentration of non-growth factors in conditioned media collected from HUVEC MPS. Media from at least 2 experimental replicates were used for analysis, and at least 2 technical replicates were included for each condition. Statistics was performed using t-test. *p<0.05 vs Untreated 3D control.
Fig 4.
Fig 4.. Analysis pipeline for FluoroSNNAP on HUVEC MPS.
a) Cells loaded with Fluo-8 (Ca2+ indicator) are shown. Fluorescence analysis on a single cell using FluoroSNNAP is shown with time, followed by ΔF/F analysis with time. b) From the fluorescence and ΔF/F, Ca2+ events are identified (ΔF/F>0.01) on a raster plot, marked as blue dots. The y-axis rows are devoted to each cell identified in the experiment, while the x-axis columns are each measurement over time. Core ensemble (cells marked in green) is calculated based on the cells with the largest number of events in common. Cells marked in red are not included in the core ensemble and are not included in co-activity plots. c) A representative illustration shows how a high number of co-active cells (dark green cells) included in the core ensemble (all green cells, including light green cells not included in the core ensemble) makes for a dense network of high co-activity. In contrast, a low number of co-active cells in the core ensemble makes for a spare network of low co-activity. d) HUVEC in 3D MPS (n=7) have a higher level of co-activity than HUVEC in 2D culture (n=7). Statistics were performed using t-test using area under the curve. ***p<0.001 vs Control 3D.
Fig 5.
Fig 5.. Ca2+ co-activity in HUVEC MPS is decreased by the inflammatory cocktail.
a,b,c) Representative images of core ensemble and co-activity plots from a single MPS in different conditions. Control, Mix 1h and cAMP + mix 1h are included to demonstrate reduction and recovery in co-activity occur with mix 1h and cAMP + mix 1h respectively. d) Average co-activity of HUVEC MPS in different conditions is shown here. Control MPS shows the highest co-activity. Statistics was performed using t-test using area under the curve measurement. *p<0.05 vs Control; ***p<0.001 vs Control. e) Mean co-activity at 6 mins computed from HUVEC MPS in response to Control (n=7), TPA (n=6), Mix 1 h (n=5), Mix 48 h (n=5), cAMP (n=4), cAMP + Mix 1 h (n=6), CBX 20 uM (n=4), CBX 100 uM (n=8) is shown here. Statistics was performed using t-test on co-activity value at 6 min. *p<0.05; ***p<0.001, comparison depicted by black line.
Fig 6.
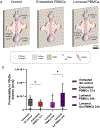
Fig 6.. Activated PBMCs directly interacting with HUVEC MPS show increased permeability compared to non-activated PBMCs interacting with HUVEC MPS.
a) Schematic depicting the HUVEC MPS interacting with PBMCs. Embedded PBMCs indirectly interact with HUVEC MPS while lumenal PBMCs directly interact with the HUVEC MPS. b) Box plots for permeability data are plotted for HUVEC MPS for Untreated control (n=43), Embedded PBMCs (n=16), Lumenal PBMCs 24 h (n=11), and Lumenal activated PBMCs 24 h (n=18). Statistics was performed using t-test. *p<0.05, comparison depicted by black line.
Fig 7.
Fig 7.. Coordinated Ca2+ activity is decreased in HUVEC MPS exposed to lumenal PBMCs with or without activation.
a)Representative image of core ensemble and co-activity plot from two different MPSs with embedded PBMCs. b) Representative image of core ensemble and co-activity plot from one MPS with lumenal PBMCs. c) Average co-activity of HUVEC MPS interacting with PBMCs is shown here. Control MPS shows the highest co-activity. Statistics was performed using t-test using area under the curve measurement. *p<0.05 vs Control, ***p<0.001 vs Control. d) Mean co-activity at 6 mins computed from HUVEC MPS interacting with PBMCs. Statistics was performed using t-test on co-activity value at 6 min. *p<0.05, ***p<0.001, comparison depicted by black line. For panel c and d, Untreated 3D Control (n=7), Embedded PBMCs (n=7), Lumenal PBMCs 24 h (n=7), Lumenal Activated PBMCs 24 h (n=6).
Fig 8.
Fig 8.. Multiplex analysis of cytokines, colony-stimulating factors, and chemokines from PBMC - HUVEC co-culture in MPS
a) Graph shows average concentration of cytokines in conditioned media collected from HUVEC MPS exposed to PBMCs. b) Graph shows average concentration of growth factors and colony stimulating factors in conditioned media collected from HUVEC MPS exposed to PBMCs. c) Graph shows average concentration of chemokines in conditioned media collected from HUVEC MPS exposed to PBMCs. Media from at least 2 experimental replicates were used for analysis, and at least 2 technical replicates were included for each condition. Statistics was performed using t-test. *p<0.05.

References

    1. Boeldt DS and Bird IM, J. Endocrinol, 2017, 232, R27–R44. - PMC - PubMed
    1. Gallo G, Volpe M and Savoia C, Front. Med, 2022, 8, 798958. - PMC - PubMed
    1. Xu S, Ilyas I, Little PJ, Li H, Kamato D, Zheng X, Luo S, Li Z, Liu P, Han J, Harding IC, Ebong EE, Cameron SJ, Stewart AG and Weng J, Pharmacol Rev, 2021, 73, 924–967. - PubMed
    1. Chistiakov DA, Orekhov AN and Bobryshev YV, Front. Physiol, DOI:10.3389/fphys.2015.00365. - DOI
    1. Phinikaridou A, Andia ME, Protti A, Indermuehle A, Shah A, Smith A, Warley A and Botnar RM, Circulation, 2012, 126, 707–719. - PubMed

Publication types

Substances

LinkOut - more resources