. 2024 Apr 1;212(7):1129-1141.
doi: 10.4049/jimmunol.2300748.

Cytotoxic Programming of CD4+ T Cells Is Regulated by Opposing Actions of the Related Transcription Factors Eos and Aiolos

Affiliations

Cytotoxic Programming of CD4+ T Cells Is Regulated by Opposing Actions of the Related Transcription Factors Eos and Aiolos

Devin M Jones et al. J Immunol. .

Abstract

In contrast to the "helper" activities of most CD4+ T effector subsets, CD4+ cytotoxic T lymphocytes (CD4-CTLs) perform functions normally associated with CD8+ T and NK cells. Specifically, CD4-CTLs secrete cytotoxic molecules and directly target and kill compromised cells in an MHC class II-restricted fashion. The functions of these cells have been described in diverse immunological contexts, including their ability to provide protection during antiviral and antitumor responses, as well as being implicated in autoimmunity. Despite their significance to human health, the complete mechanisms that govern their programming remain unclear. In this article, we identify the Ikaros zinc finger transcription factor Eos (Ikzf4) as a positive regulator of CD4-CTL differentiation during murine immune responses against influenza virus infection. We find that the frequency of Eos+ cells is elevated in lung CD4-CTL populations and that the cytotoxic gene program is compromised in Eos-deficient CD4+ T cells. Consequently, we observe a reduced frequency and number of lung-residing, influenza virus-responsive CD4-CTLs in the absence of Eos. Mechanistically, we determine that this is due, at least in part, to reduced expression of IL-2 and IL-15 cytokine receptor subunits on the surface of Eos-deficient CD4+ T cells, both of which support the CD4-CTL program. Finally, we find that Aiolos, a related Ikaros family member and known CD4-CTL antagonist, represses Eos expression by antagonizing STAT5-dependent activation of the Ikzf4 promoter. Collectively, our findings reveal a mechanism wherein Eos and Aiolos act in opposition to regulate cytotoxic programming of CD4+ T cells.


Conflict of interest statement

Declaration of Interests

The authors declare no competing interests.

Figures

Figure 1.
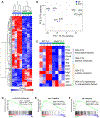
Figure 1.. Eos expression is elevated in the absence of Aiolos.
(A-D) Naïve WT and Aiolos-deficient (Ikzf3−/−) CD4+ T cells were cultured under TH1-polarizing conditions for 3 days. (A-B) RNA sequencing was performed to assess differentially expressed genes (DEGs). (A) Representative heatmap of DEGs positively and negatively associated with the CD4-CTL program in WT versus Aiolos-deficient cells. Differential expression is presented as row (gene) Z-score and are compiled from 3 independent experiments. (B) Genes were pre-ranked using (sign of fold change x −log10(p-value)) and analyzed using the Broad Institute’s Gene Set Enrichment Analysis (GSEA) software for comparison against “gene ontology”, “immunological signatures”, and “curated” gene sets. Enrichment plots for the indicated gene sets are shown. (C) qRT-PCR analysis of the indicated genes, normalized to Rps18 and presented as relative to the WT sample. Data are compiled from 4 independent experiments (n = 4 ± s.e.m.; **P<0.01; two-tailed, unpaired Student’s t-test). (D) Immunoblot analysis of the indicated proteins. β-actin serves as a loading control. Representative image from 3 independent experiments is shown. (E,F) Naïve CD4+ T cells were harvested from the spleens and lymph nodes of OT-II-WT and OT-II-Ikzf3−/− CD45.2+ mice. 500,000 cells/animal were adoptively transferred via retro-orbital injection into CD45.1 recipients. 24 hours after adoptive transfer, recipient mice were infected with 40 PFU OVA323–339-expressing A/Puerto Rico/8/34 (“PR8-OVA”). 8 days after infection, spleens were harvested and viable CD4+CD45.2+CD44+CD62LCxcr5Foxp3 effector cell populations were analyzed via flow cytometry. Counts data represent the number of cells collected per 800,000 total events for all samples. Data are representative of 2 independent experiments (n = 9-10 ± s.e.m.; *P<0.05; two-tailed, unpaired Student’s t-test).
Figure 2.
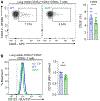
Figure 2.. Eos is differentially expressed in effector CD4+ T cell populations.
(A-D) Naïve CD4+ T cells were harvested from the spleens and lymph nodes of OT-II-WT or OT-II-Ikzf4−/− CD45.2 mice. 500,000 cells/animal were adoptively transferred into CD45.1 recipients. Recipient mice were infected with 40 PFU OVA323–339-expressing A/Puerto Rico/8/34 (“PR8-OVA”) 24 hours post-transfer. 8 days post-infection, lungs and spleens were harvested. WT CD4+CD45.2+CD44+CD62LCxcr5Foxp3 antigen-specific donor effector cell populations were analyzed via flow cytometry. (A) Percent of NKG2A/C/E+ cells in spleens and lungs. Data are representative of 3 independent experiments (n = 5 ± s.e.m; ***P<0.001; two-tailed, unpaired Student’s t-test). (B) Percent of Eos+ cells in spleens and lungs. Data are representative of 3 independent experiments (n = 5 ± s.e.m.; *P<0.05, **P<0.01; one-way ANOVA with Tukey’s multiple comparisons). (C,D) Analysis of whole lung homogenates via flow cytometry for the indicated proteins. Counts data represent the number of cells collected per 400,000 total events for all samples. Data are from 4 independent experiments (n = 12 ± s.e.m.; *P<0.05, ***P<0.001; two-tailed, unpaired Student’s t-test).
Figure 3.
Figure 3.. Cytotoxic features and Eomes expression are reduced in the absence of Eos.
(A-D) Naïve CD4+ T cells were harvested from the spleens and lymph nodes of OT-II-WT or OT-II-Ikzf4−/− CD45.2 mice. 500,000 cells/animal were adoptively transferred into CD45.1 recipients. Recipient mice were infected with 40 PFU OVA323–339-expressing A/Puerto Rico/8/34 (“PR8-OVA”) 24 hours post-transfer. 8 days post-infection, lungs were harvested. (A-C) Lung homogenates were stimulated ex vivo for 48 hours with OVA323–339 peptide. Homogenates were treated with protein transport inhibitors for the last 4 hours of ex vivo stimulation. (A-D) Antigen-specific CD4+CD45.2+CD44+ or CD4+CD45.2+CD44+CD62L cells were then analyzed via flow cytometry for the expression of the indicated proteins. Data are representative of 4 independent experiments (n = 10-11 ± s.e.m.; *P<0.05; two-tailed, unpaired Student’s t-test).
Figure 4.
Figure 4.. Eos deficiency results in broad dysregulation of the cytotoxic gene program.
(A-F) WT and Eos-deficient cells were cultured under TH1-polarizing conditions for 3 days. RNA sequencing analyses were performed to assess differentially expressed genes. Counts were normalized via DESeq2 analysis. Data are representative of 4 independent experiments and 2 independent sequencing runs. (A) Heatmap of top 200 DEGs between WT and Eos-deficient cells. Changes in gene expression are presented as row (gene) Z-score from normalized counts. Genes are clustered by Euclidian distance. (B) PCA analysis of normalized counts. (C) Representative heatmap of DEGs positively and negatively associated with the CD4-CTL program in WT versus Eos-deficient cells. Differential expression is presented as row (gene) Z-score. (D-F) Genes were pre-ranked using (sign of fold change x −log10(p-value)) and analyzed using the Broad Institute’s Gene Set Enrichment Analysis (GSEA) software for comparison against “hallmark” gene sets. Enrichment plots for the indicated gene sets are shown.
Figure 5.
Figure 5.. Eos deficiency results in reduced expression of CD25 and CD122.
(A,B) Naïve CD4+ T cells were harvested from the spleens and lymph nodes of OT-II-WT or OT-II-Ikzf4−/− CD45.2 mice. 500,000 cells/animal were adoptively transferred into CD45.1 recipients. Recipient mice were infected with 40 PFU OVA323–339-expressing A/Puerto Rico/8/34 (“PR8-OVA”) 24 hours post-transfer and lungs were harvested 8 days later for analysis. Viable, antigen-specific CD4+CD45.2+CD44+CD62L effector cells were analyzed via flow cytometry for expression of CD122 and CD25, as indicated. Data are representative of 4 independent experiments (n = 11-12 ± s.e.m.; **P<0.01; two-tailed, unpaired Student’s t-test).
Figure 6.
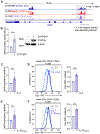
Figure 6.. Eos expression is induced by both IL-2 and IL-15 signaling.
(A) Naïve WT and Aiolos-deficient CD4+ T cells were cultured under TH1-polarizing conditions for 3 days. ATAC-seq was performed to assess changes in chromatin accessibility. Data are representative of 3 independent experiments. WT and Aiolos-deficient samples are displayed as CPM-normalized Integrative Genomics Viewer (IGV) tracks and are representative of 3 independent experiments. Data are overlaid with previously published CD8+ T cell STAT5 ChIP-seq data set (GSM1865310). The Ikzf4 promoter region with increased accessibility and STAT5 binding is indicated by a gray box. (B) EL4 T cells were transfected with an Ikzf4 promoter-reporter construct in conjunction with STAT5bCA or empty vector control. Cells were concurrently transfected with SV40 Renilla to serve as a control for transduction efficiency. Luciferase promoter-reporter values were normalized to SV40 Renilla control and presented relative to empty vector. Data are representative of 2 independent experiments (n = 3 ± s.e.m.; *P<0.05; two-tailed, unpaired Student’s t-test). Immunoblot of indicated proteins was performed to validate vector overexpression. β-actin serves as a loading control. Data are representative of 3 independent experiments. (C-F) Naïve CD4+ T cells were isolated from the spleens and lymph nodes of WT mice and cultured in vitro under TH1-polarizing conditions for 2 days. In addition to TH1-polarizing cytokines, cells were given either 1) nothing additional, 2) IL-2, or 3) IL-2-neutralizing antibodies with IL-15/IL-15Rα complex (IL-15TRANS). (C,E) Ikzf4 transcript was analyzed via qRT-PCR. Data are representative of 5 independent experiments (n = 8 ± s.e.m.; **P<0.01; two-tailed, paired Student’s t-test). (D,F) Cells were analyzed via flow cytometry for Eos protein expression. Representative flow plots are presented. The same isotype control is used for comparison in both primary flow cytometry plots. Data are representative of 2 independent experiments (n = 5 ± s.e.m.; **P<0.01; two-tailed, paired Student’s t-test).
Figure 7.
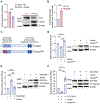
Figure 7.. Aiolos represses Eos expression by antagonizing STAT5-dependent induction of Ikzf4 promoter activity.
(A) Naïve CD4+ T cells were isolated from the spleens and lymph nodes of Aiolos-deficient mice and cultured under TH1-polarizing conditions for 3 days. Concurrently, cells were retrovirally transduced with either empty vector control or a vector with the gene encoding Aiolos. Ikzf4 gene transcript was assessed via qRT-PCR, normalized to Rps18 control, and presented relative to empty vector control. Data are representative of 3 independent experiments (n = 3 ± s.e.m.; *P<0.05; two-tailed, paired Student’s t-test). Immunoblot of Eos and Aiolos protein analysis is shown. β-actin serves as a loading control. Data are representative of 3 independent experiments. (B) Naïve WT or Aiolos-deficient cells were cultured under TH1-polarizing conditions for 3 days. ChIP analysis was performed using anti-STAT5 and IgG control antibodies for the Ikzf4 promoter region. Data are normalized to total input sample and IgG values and are displayed relative to the WT sample. Data are compiled from 3 independent experiments (n = 3 ± s.e.m; **P<0.01; two-tailed, unpaired Student’s t-test). (C) Schematic depicting the conserved IkZF domains of Aiolos versus the Aiolos DNA-binding domain mutant (AiolosDBM). (D-F) EL4 T cells were transfected with Ikzf4 promoter-reporter construct in conjunction with STAT5bCA, Aiolos, AiolosDBM and/or empty vector control. Cells were concurrently transfected with SV40 Renilla to serve as a control for transduction efficiency. Luciferase promoter-reporter values were normalized to Renilla control and presented relative to control sample. Data are representative of 3-5 independent experiments (n = 3-5 ± s.e.m.; *P<0.05, **P<0.01, ***P<0.001; one-way ANOVA with Tukey’s multiple comparisons). Immunoblot of indicated proteins was performed to validate vector overexpression. β-actin serves as a loading control. Data are representative of 3-5 independent experiments.

References

    1. Zhu J, and Paul WE. 2008. CD4 T cells: fates, functions, and faults. Blood 112: 1557–1569. - PMC - PubMed
    1. Cenerenti M, Saillard M, Romero P, and Jandus C. 2022. The Era of Cytotoxic CD4 T Cells. Front Immunol 13: 867189. - PMC - PubMed
    1. Takeuchi A, and Saito T. 2017. CD4 CTL, a Cytotoxic Subset of CD4(+) T Cells, Their Differentiation and Function. Front Immunol 8: 194. - PMC - PubMed
    1. Brown DM, Lampe AT, and Workman AM. 2016. The Differentiation and Protective Function of Cytolytic CD4 T Cells in Influenza Infection. Front Immunol 7: 93. - PMC - PubMed
    1. Juno JA, van Bockel D, Kent SJ, Kelleher AD, Zaunders JJ, and Munier CM. 2017. Cytotoxic CD4 T Cells-Friend or Foe during Viral Infection? Front Immunol 8: 19. - PMC - PubMed