. 2024 Feb 16:12:RP90888.
doi: 10.7554/eLife.90888.

Antigenic strain diversity predicts different biogeographic patterns of maintenance and decline of antimalarial drug resistance

Affiliations

Antigenic strain diversity predicts different biogeographic patterns of maintenance and decline of antimalarial drug resistance

Qixin He et al. Elife. .

Abstract

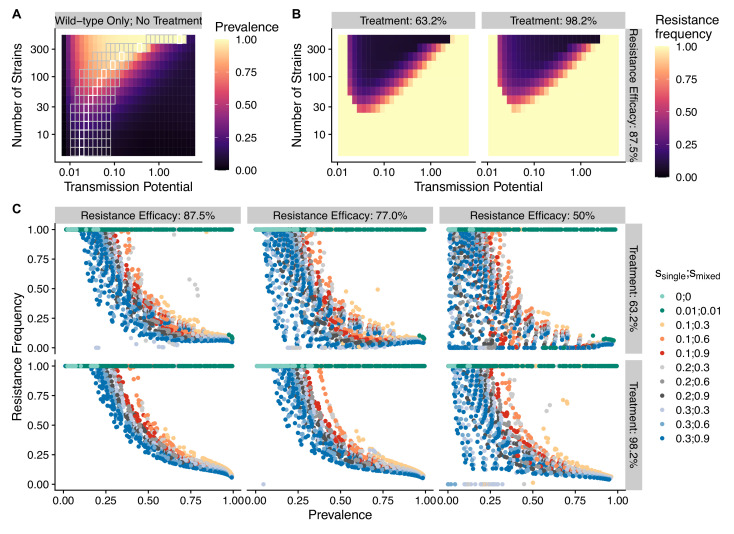
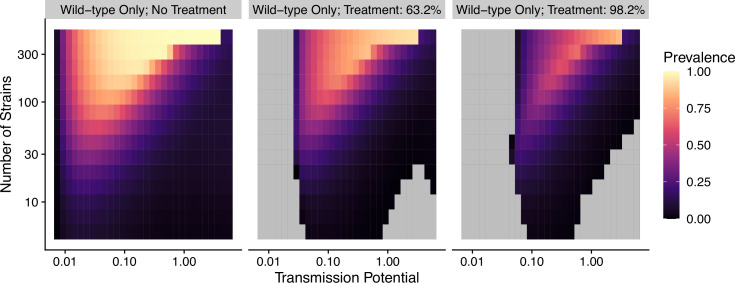
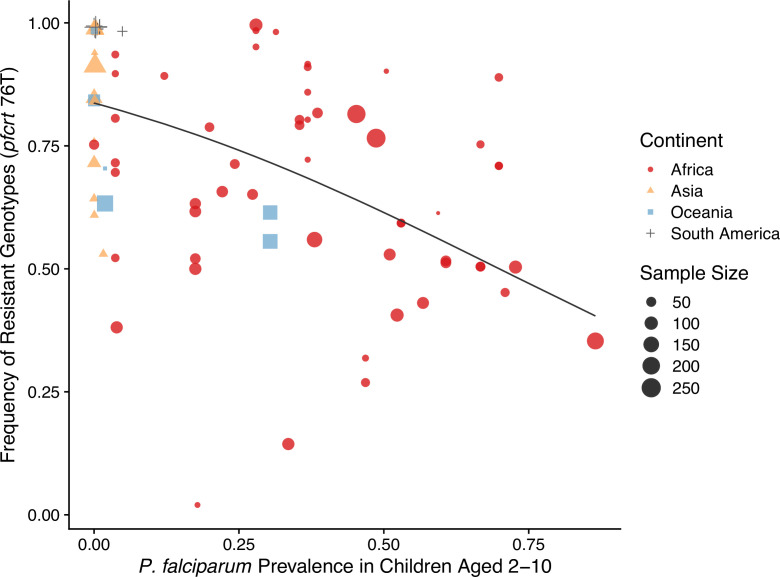
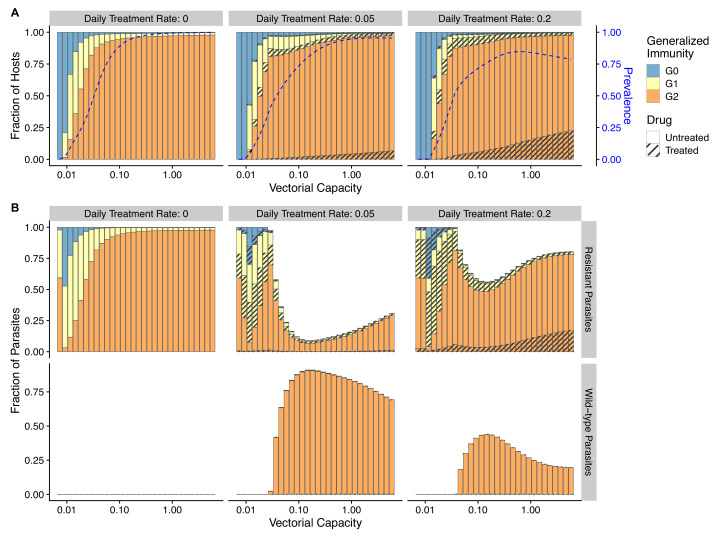
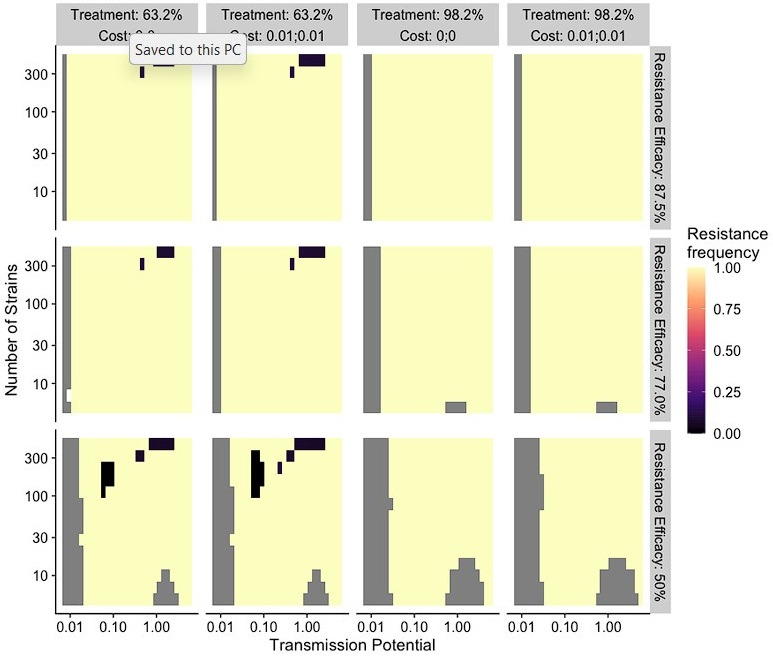
The establishment and spread of antimalarial drug resistance vary drastically across different biogeographic regions. Though most infections occur in sub-Saharan Africa, resistant strains often emerge in low-transmission regions. Existing models on resistance evolution lack consensus on the relationship between transmission intensity and drug resistance, possibly due to overlooking the feedback between antigenic diversity, host immunity, and selection for resistance. To address this, we developed a novel compartmental model that tracks sensitive and resistant parasite strains, as well as the host dynamics of generalized and antigen-specific immunity. Our results show a negative correlation between parasite prevalence and resistance frequency, regardless of resistance cost or efficacy. Validation using chloroquine-resistant marker data supports this trend. Post discontinuation of drugs, resistance remains high in low-diversity, low-transmission regions, while it steadily decreases in high-diversity, high-transmission regions. Our study underscores the critical role of malaria strain diversity in the biogeographic patterns of resistance evolution.

Keywords: Greater Mekong Subregion; P. falciparum; antigenic diversity; disease modeling; drug resistance; epidemiology; global health.

Plain language summary

Drug resistance among strains of the parasites that cause malaria is a growing problem for people relying on antimalarial drugs to protect them from the disease. This phenomenon is global yet exactly how resistance emerges, spreads and persists in a population often differs greatly between regions, which can complicate malaria control projects. For example, discontinuing the use of antimalarials can lead to the frequency of resistant strains declining in an area, such as Africa, but persisting at high levels in others, including Asia and South America. Gaining resistance often leads to parasites becoming less transmissible than other strains. When antimalarials are not used, sensitive strains usually outcompete their resistant counterparts. However, prolonged use of antimalarial drugs tends to eliminate susceptible strains, allowing the previously outcompeted resistant strains to dominate. The local dynamics of antimalarial resistance are also shaped by multiple other factors such as transmission levels (how common the disease is in the region), the type of antimalarial measures used (such as drugs and mosquito nets), or previous immunity the population may have developed to specific strains. While many computational models have been developed to capture these dynamics, they usually fail to include strain diversity – a parameter reflecting the number of malaria strains the immune system is exposed to. This parameter is important as parasites need to escape both host immunity and drugs in order to be successful. To address this gap, He, Chaillet, and Labbé created a computational model to investigate how strain diversity, transmission levels and other related factors influence antimalarial resistance. The model was used to explore how the frequency of resistant and susceptible strains changes over time once antimalarial drugs are rolled out and then halted. These analyses show that in areas with both low strain diversity and low transmission levels, susceptible parasites are more likely to be wiped out from the population, leading to a high frequency of resistant strains that persist after drugs are discontinued. However, in high diversity and high transmission regions, susceptible strains can remain in the population. Therefore, when drug treatments are stopped, resistance levels are more likely to drop due to these parasites outcompeting the drug-resistant ones. Overall, this work demonstrates how modelling approaches that include strain diversity can help inform public health decisions aimed at reducing antimalarial resistance. In particular, they can provide important insights into the control strategies that are best suited for a specific region, suggesting that in low transmission areas intensive drug treatment may contribute to resistance. Instead, preventative strategies such as eliminating mosquitos and preventing bites with bed nets may prove more beneficial at reducing transmission rates in such areas.


Conflict of interest statement

QH, JC, FL No competing interests declared

Figures

Figure 1.
Figure 1.. Schematic illustration of transmission rules and acquisition of host immunity within the compartmental ordinary differential equations (ODE) model (see Figure 1—figure supplement 1 for a detailed representation of the compartment model).
(A) Rules for new infections given the host’s past infection history and current multiplicity of infection (i.e., multiplicity of infection [MO]). Upon transmission of a specific parasite strain A, if the host has had an infection of strain A in the past (hands raised), a new infection will not be added to the current MOI; instead, the infection will be considered cleared and added to the total number of cleared infections; if the host is new to strain A and does not have specific immunity to it (inferred from Equation 1), a new infection will be added (i.e., MOI increase by 1) as long as MOI does not exceed the carrying capacity of coexisting strains. (B) Rules of symptomatic infections and treatment in the different generalized immunity (G) classes. With increasing generalized immunity (G), hosts are less likely to show clinical symptoms. Hosts in G0 have a risk of death in addition to symptomatic infections; Hosts in G1 do not die from infections but show symptoms upon new infections; Hosts in G2 carry asymptomatic infections most of the time with a slight chance of showing symptoms. Symptomatic infections result in a daily treatment rate that removes the infections caused by wild-type strains. Hosts that have cleared enough number of infections will move to the next G class. Hosts will move back to a lower G class when the generalized immunity memory is slowly lost if not boosted by constant infections.
Figure 1—figure supplement 1.
Figure 1—figure supplement 1.. Compartment model of drug resistance evolution.
(A) The number of hosts and movements are tracked in different generalized immunity classes (G), together with their drug treatment states (treated, D; untreated, U); (B) wild-type (PW) and resistant parasite (PR) population sizes are tracked in different host immunity classes; (C) Changes in total immunity (TI, total number of cleared infections) per G class are followed. See Appendix 1 for a detailed explanation of the ODE system.
Figure 2.
Figure 2.. The frequency of resistance under varying strain diversity and transmission potential.
(A) The heatmap shows a nonlinear parasite prevalence response given increasing transmission potential and the number of strains under no drug treatment, with warmer colors representing high prevalence and cooler colors representing low prevalence. X and Y axes correspond to increasing transmission potential and the number of strains in logarithmic scales. White tiles indicate the highest prevalence given a fixed number of strains. (B) The heatmaps show resistance frequencies under varying strain diversity and transmission potential at two levels of drug treatment rate, with warmer colors representing higher resistance frequency (in this example, ssingle = 0.1, smixed = 0.9). A comparison between the prevalence pattern in (A) and resistance frequency in (B) reveals that high-prevalence regions usually correspond to low resistance frequency at the end of resistance invasion dynamics. (C) A negative relationship between parasite prevalence and resistance frequency. The color of the points indicates combinations of resistance fitness costs in hosts with resistant strains alone (ssingle) or mixed infections of resistant and wild-type strains (smixed).
Figure 2—figure supplement 1.
Figure 2—figure supplement 1.. Prevalence given the combination of transmission potential and the number of strains from no treatment to high treatment rate for wild-type-only infections.
Gray areas indicate that transmission is eliminated.
Figure 2—figure supplement 2.
Figure 2—figure supplement 2.. Infectivity of a new infection as a function of the number of strains and mean immunity.
Total immunity divided by the number of hosts per G class (see Equation 1). ssingle: 0.1; smixed: 0.9.
Figure 2—figure supplement 3.
Figure 2—figure supplement 3.. Relationship between parasite prevalence and resistance frequency under full treatment (daily treatment rate d1=0.2).
Each subgraph represents the combination of resistance fitness costs in hosts with resistant strains alone (ssingle) and mixed-genotype infections of resistant and wild-type strains (smixed), as well as the efficacy of resistance (μPRD). Color indicates transmission potential.
Figure 2—figure supplement 4.
Figure 2—figure supplement 4.. Relationship between parasite prevalence and resistance frequency under partial treatment (daily treatment rate d1=0.05).
Each subgraph represents the combination of resistance fitness costs in hosts with resistant strains alone (ssingle) or mixed-genotype infections of resistant and wild-type strains (smixed). Color indicates transmission potential, as well as the efficacy of resistance (μPRD).
Figure 3.
Figure 3.. Empirical range of transmission potential and strain diversity.
Squares denote the known minimum and maximum values of transmission potential and the number of strains from literature see Tables 1 and 2 for parameter sources. We overlaid the empirical parameter ranges on the simulated equilibrium resistance frequency as a visual reference using the same parameters of Figure 2B. The empirical resistance frequency of these regions will depend on specific treatment rates and resistance costs, which is shown in Figure 4.
Figure 4.
Figure 4.. Global patterns of chloroquine-resistant genotype frequencies (pfcrt 76T) against P. falciparum prevalence in children between 2 and 10 years old.
Sampling between 1990 and 2000 was included to ensure genotyping was performed largely before the policy switch of the first-line antimalarial drugs to ACT. Different shapes indicate samples from different continents, while shape sizes correspond to sample sizes for genotyping (see ‘Methods’ for details).
Figure 5.
Figure 5.. Relationship between host immunity, drug treatment, and resistance evolution.
Fraction of hosts in different G classes with increasing strain diversity and the corresponding transmission potential indicated by white circles in Figure 1A at equilibrium before drug treatment (left panel) or year 50 after the invasion of resistant genotypes (middle and right panels). Hosts under drug treatment are indicated by stripes. Red dotted lines show the corresponding frequency of resistance. The upper panel is generated under wild-type-only infections with increasing treatment rates. The lower panel represents resistance-only infections without treatment or resistant invasion under treatments.
Figure 6.
Figure 6.. Temporal trajectories of resistance invasion.
Host (A) and parasite dynamics (B) under resistance invasion are shown for lower (nstrains = 20) and higher (nstrains = 113) diversity under the same daily treatment rate of 0.05. Wild-type parasite population size is also presented in inset C with a smaller scale for clarity. Because drug treatment does not affect resistant parasites, they surge quickly after introduction, thus leading to more infections (upper panel of B). Hosts recovered from a large number of new infections move into higher G classes (from year 1–8) (B). The higher specific immunity reduces the infectivity of new strains, leading to a reduction of the resistant parasite population regardless of the diversity level (year 4–10; upper panel of B). Under low diversity, wild-type parasites quickly go to extinction C. Under high diversity, the less symptomatic G2 class provides a niche for wild-type parasites to multiply (year 4–10), where the two genotypes coexist, with the wild-type parasite population size surpassing that of resistant ones. Meanwhile, resistant parasites dominate in hosts that are in G0 and G1 B.
Figure 7.
Figure 7.. Changes in frequency of resistance after the first-line drug is changed.
Each trajectory represents the mean resistance change from the combination of variables indicated by the gray area in Figure 1A. Color from cool to warm represents increasing diversity in strains. Here the usage of the drug, to which parasites have developed resistance, is reduced to 0.52, 0.52, 0.52, 0.52, 0.21, 0.21, 0.21, 0.21, 0, 0, 0, 0, 0, 0, 0, 0 each year following the change in the treatment regime. The trajectory of reduction in resistant drug usage follows the usage survey in western Kenya from 2003 to 2018 (Hemming-Schroeder et al., 2018).
Figure 7—figure supplement 1.
Figure 7—figure supplement 1.. Percentage of reduction in resistance after 1 y of policy change in drug treatment as a function of transmission potential and the number of strains under different combinations of resistance costs (ssingle; smixed).
Figure 8.
Figure 8.. Changes in frequency of resistant genotypes across different biogeographic regions.
Each circle represents one studied sample (at least 20 infected hosts) from one geographic location. Circles connected by dotted lines represent longitudinal samples from the same study. After the policy switch in first-line antimalarial drugs, frequencies of resistance decreased gradually in Africa, but maintained high in Asia, Oceania, and South America despite the policy change for more than 20 y. CQ: chloroquine; SP: sulfadoxine-pyrimethamine; MQ: mefloquine; AQ: amodiaquine; PQ: primaquine; QN-TET: quinine + tetracycline; ACT: artemisinin-based combination therapy.
Figure 9.
Figure 9.. Relationship between parasite prevalence and resistance frequency for the generalized-immunity-only model.
Paths are connected from low transmission potential to high-transmission potential. Colors represent different combinations of single-genotype infection cost and mixed-genotype infection cost of resistant parasites.
Figure 9—figure supplement 1.
Figure 9—figure supplement 1.. Changes in frequency of resistance after the first-line drug is changed in the generalized-immunity-only model.
Note that in the generalized-immunity-only model, there is no strain diversity. The only parameter that determines transmission intensity is transmission potential. Trajectories that end earlier than year 16 indicate the disease is eradicated.
Figure 9—figure supplement 2.
Figure 9—figure supplement 2.. Relationship between host immunity, drug treatment, and resistance evolution for the generalized-immunity-only model.
Note that in the generalized-immunity-only model, there is no strain diversity. The only parameter that determines transmission intensity is transmission potential. In general, prevalence (blue dotted line) increases as transmission potential increases despite hosts increasingly concentrating in G2 class (A). The fraction of resistant parasites decreases initially with increasing transmission potential, but rises again as high transmission results in a higher proportion of G2 hosts in the drug-treated class (B).
Author response image 1.

Update of

Similar articles

Cited by

References

    1. Afrane YA, Little TJ, Lawson BW, Githeko AK, Yan G. Deforestation and vectorial capacity of anopheles gambiae giles mosquitoes in malaria transmission, kenya. Emerging Infectious Diseases. 2008;14:1533–1538. doi: 10.3201/eid1410.070781. - DOI - PMC - PubMed
    1. Albrecht L, Castiñeiras C, Carvalho BO, Ladeia-Andrade S, Santos da Silva N, Hoffmann EHE, dalla Martha RC, Costa FTM, Wunderlich G. The South American Plasmodium falciparum var gene repertoire is limited, highly shared and possibly lacks several antigenic types. Gene. 2010;453:37–44. doi: 10.1016/j.gene.2010.01.001. - DOI - PubMed
    1. Alifrangis M, Lemnge MM, Rønn AM, Segeja MD, Magesa SM, Khalil IF, Bygbjerg IC. Increasing prevalence of wildtypes in the dihydrofolate reductase gene of Plasmodium falciparum in an area with high levels of sulfadoxine/pyrimethamine resistance after introduction of treated bed nets. The American Journal of Tropical Medicine and Hygiene. 2003;69:238–243. - PubMed
    1. Anderson RM, May RM. REgulation and stability of host-parasite population interactions: I. Regulatory processes. The Journal of Animal Ecology. 1978;47:219. doi: 10.2307/3933. - DOI
    1. Anderson RM, Gordon DM. Processes influencing the distribution of parasite numbers within host populations with special emphasis on parasite-induced host mortalities. Parasitology. 1982;85 (Pt 2):373–398. doi: 10.1017/s0031182000055347. - DOI - PubMed

MeSH terms