. 2024 Feb 16;44(3):66.
doi: 10.1007/s10875-024-01665-1.

A Novel Heterozygous Variant in AICDA Impairs Ig Class Switching and Somatic Hypermutation in Human B Cells and is Associated with Autosomal Dominant HIGM2 Syndrome

Affiliations

A Novel Heterozygous Variant in AICDA Impairs Ig Class Switching and Somatic Hypermutation in Human B Cells and is Associated with Autosomal Dominant HIGM2 Syndrome

Erika Della Mina et al. J Clin Immunol. .

Abstract

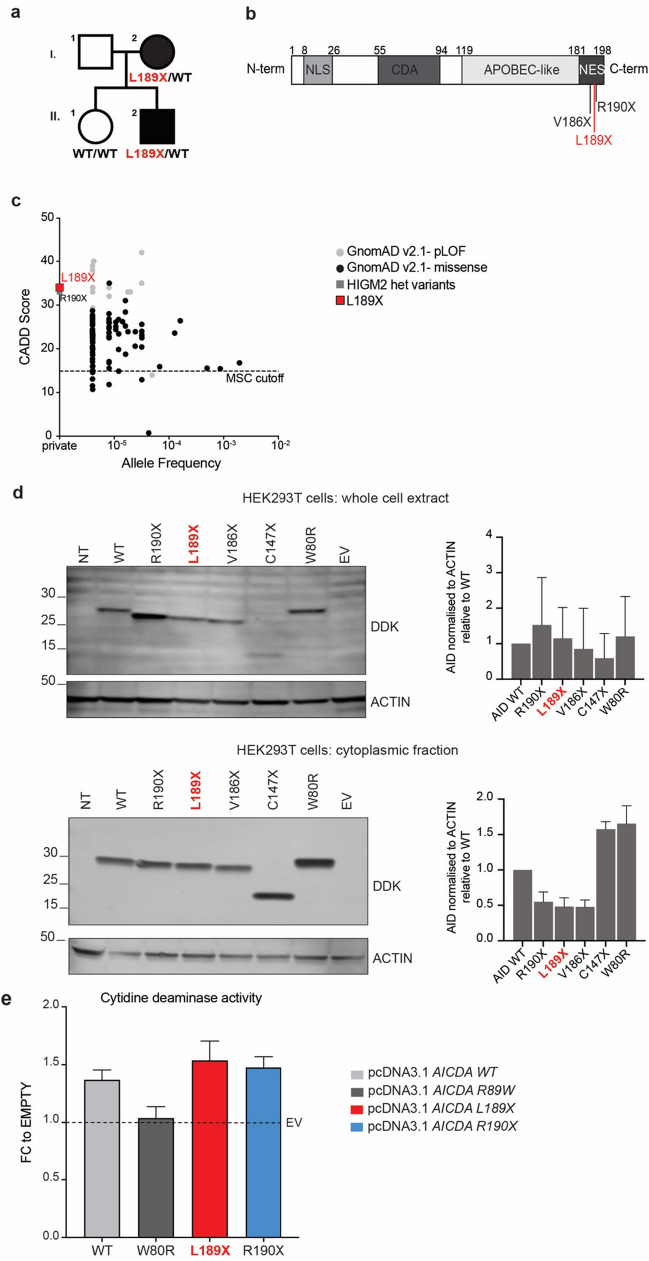
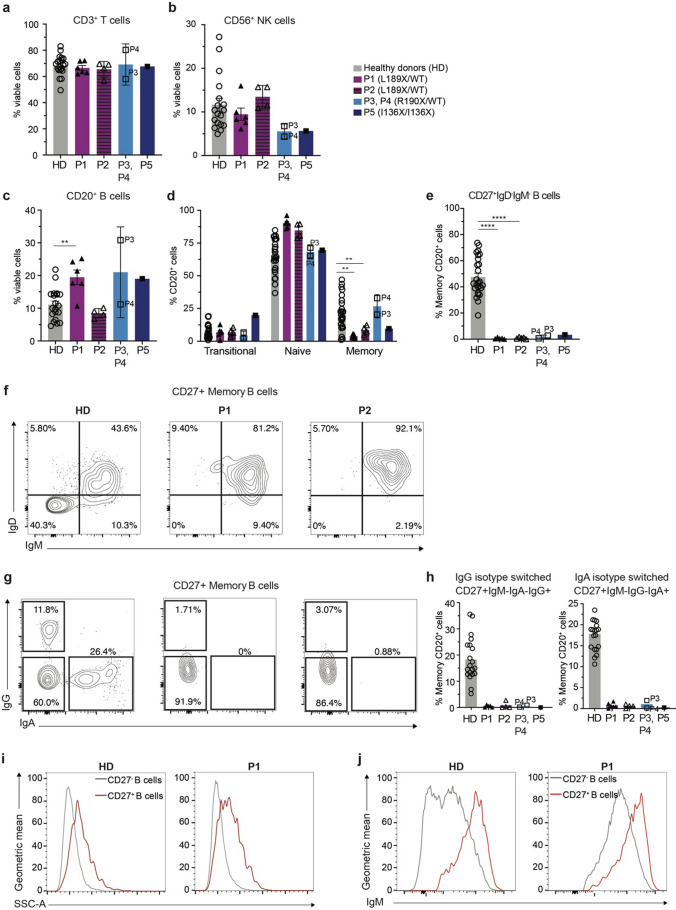
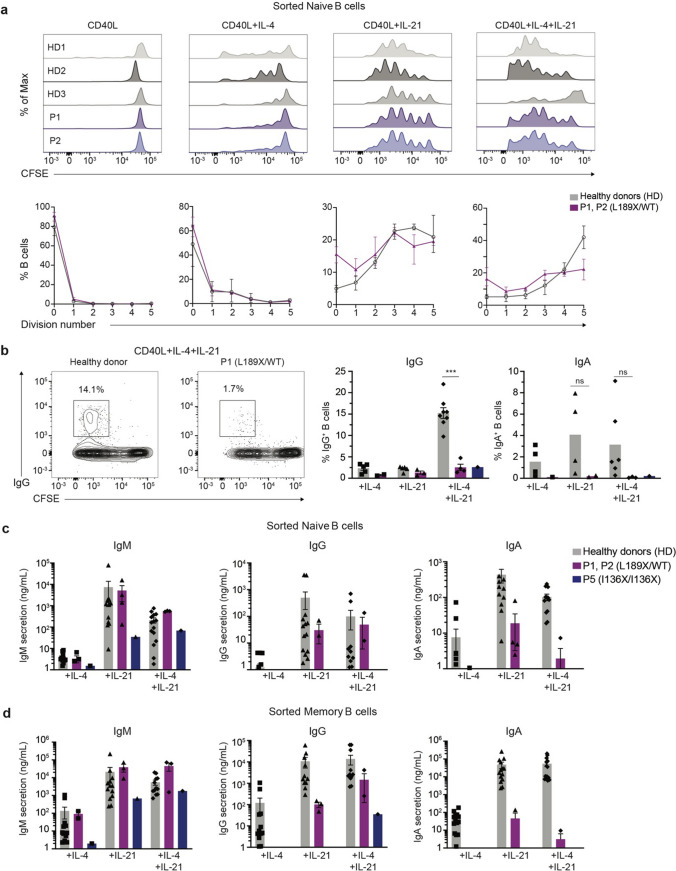
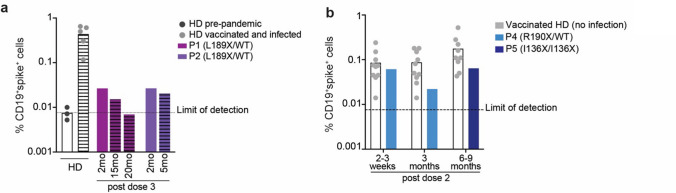
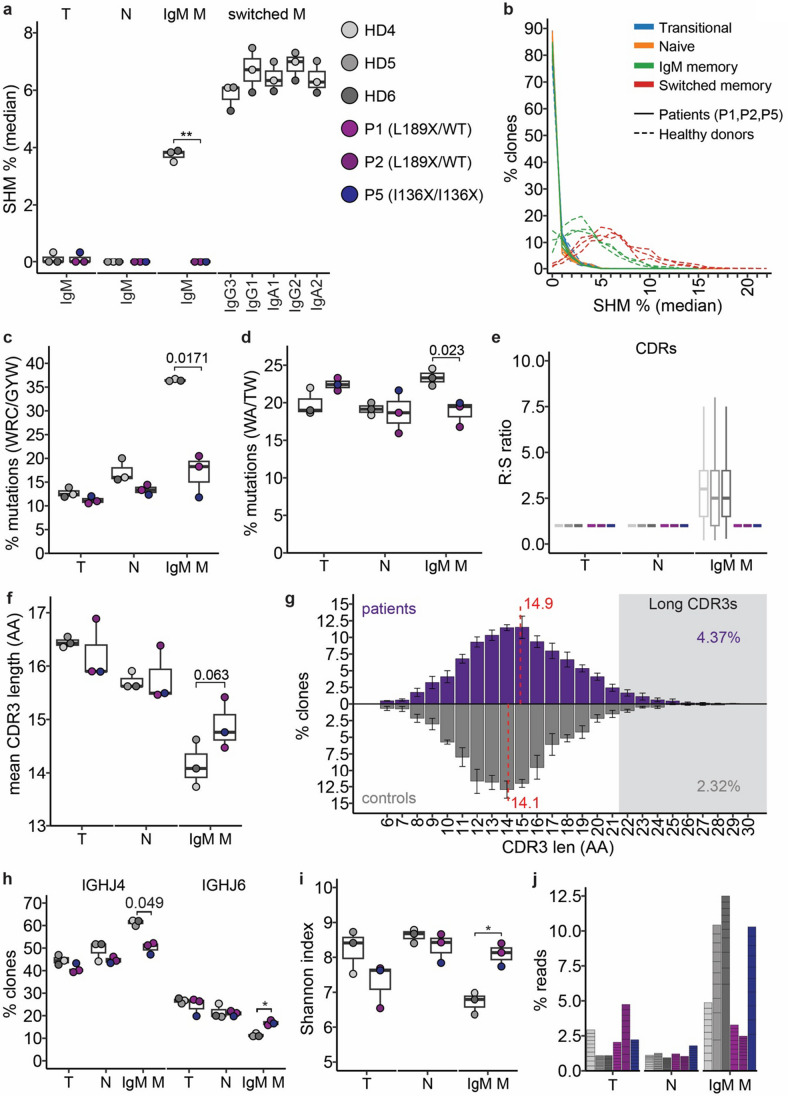
B cells and their secreted antibodies are fundamental for host-defense against pathogens. The generation of high-affinity class switched antibodies results from both somatic hypermutation (SHM) of the immunoglobulin (Ig) variable region genes of the B-cell receptor and class switch recombination (CSR) which alters the Ig heavy chain constant region. Both of these processes are initiated by the enzyme activation-induced cytidine deaminase (AID), encoded by AICDA. Deleterious variants in AICDA are causal of hyper-IgM syndrome type 2 (HIGM2), a B-cell intrinsic primary immunodeficiency characterised by recurrent infections and low serum IgG and IgA levels. Biallelic variants affecting exons 2, 3 or 4 of AICDA have been identified that impair both CSR and SHM in patients with autosomal recessive HIGM2. Interestingly, B cells from patients with autosomal dominant HIGM2, caused by heterozygous variants (V186X, R190X) located in AICDA exon 5 encoding the nuclear export signal (NES) domain, show abolished CSR but variable SHM. We herein report the immunological and functional phenotype of two related patients presenting with common variable immunodeficiency who were found to have a novel heterozygous variant in AICDA (L189X). This variant led to a truncated AID protein lacking the last 10 amino acids of the NES at the C-terminal domain. Interestingly, patients' B cells carrying the L189X variant exhibited not only greatly impaired CSR but also SHM in vivo, as well as CSR and production of IgG and IgA in vitro. Our findings demonstrate that the NES domain of AID can be essential for SHM, as well as for CSR, thereby refining the correlation between AICDA genotype and SHM phenotype as well as broadening our understanding of the pathophysiology of HIGM disorders.

Keywords: AICDA; HIGM2; Human B cells; Ig class switching; Somatic hypermutation.


Conflict of interest statement

All authors have no conflicts of interest to declare.

Figures

Fig. 1
Fig. 1
Identification of a novel heterozygous L189X/WT variant in AICDA in two related patients with hyper-IgM 2 (HIGM2) syndrome. a Pedigree showing familial segregation of the c.566_568delinsAA, p.L189X variant. Affected individuals are represented by closed black symbols (I.2, P1 and II.2, P2). b Schematic representation of AID protein showing its functional domains (NLS, nuclear localization signal; CDA, cytidine deaminase; NES, nuclear export signal; APOBEC, apolipoprotein B mRNA editing catalytic polypeptide-like), and location of heterozygous AICDA variants. c Minor allele frequency (MAF) and CADD score for predicted loss of function (pLOF, grey circles) and missense (black circles) AICDA variants reported in public databases, and variants found in previously-reported AD HIGM2 patients (grey square) and in P1 and P2 (red square). The mutation significance cutoff (MSC, 99% confidence interval) is represented by the dotted line. d HEK293T cells were untransfected (NT) or transfected with the DDK-tagged plasmids encoding WT or L189X AID (highlighted in red), or variants previously identified in patients with AD HIGM2 (V186X and R190X) [12, 30]; or C147X, located in the APOBEC-like domain [49]; W80R, previously shown to abolish AID enzymatic activity [50] or the empty vector (EV). Total cell extracts (upper panel) and cytoplasmic extracts (lower panel) were subjected to western blotting; anti-DDK antibody (Ab) was used to detect AID levels and anti-ACTIN Ab was used as a loading control. AID signal intensity for L189X (in red), R190X, V186X, C147X and W80R transfected cells relative to WT-transfected cells, in various cell compartments (total and cytoplasmic), were normalized against ACTIN, as shown by histogram bars graphs. The data shown are representative of three independent experiments. e HEK293T cells were untransfected (NT) or transfected with DDK-tagged plasmids encoding AID WT, AID L189X (highlighted in red), R190X, W80R, or the EV. Cell extracts were prepared and cytidine deaminase activity was determined. A fold-change (FC) of cytidine deaminase activity normalised to EV was calculated for each mutant protein. The data shown are mean ± SEM of four independent experiments
Fig. 2
Fig. 2
Dominant or recessive variants in AICDA disrupt memory B cell formation and Ig isotype switching. a-e PBMCs from healthy donors (HD, n = 16), P1 and P2 (heterozygous AID L189X variant), P3 (AID R190X/WT) [31], P4 (heterozygous AID R190X variant) and P5 (homozygous AID I136X variant) were stained to determine the proportions of (a) T cells (CD3+), b NK cells (CD56+) and (c) B cells (CD20+). Proportions of (d) transitional (CD27CD10+), naïve (CD27CD10) and memory (CD27+CD10) B cells and (e) Ig switched memory B cells (IgDIgMCD27+) were also determined. f, g Representative contour plots gated on HD, P1 or P2 showing frequencies of (f) IgD+, IgM+ or (g) IgG+, IgA+ CD27+ memory B cells. h Frequency of IgG+ or IgA+ switched memory B cells as determined by cell surface staining. i, j Characterisation of CD27 B cells compared to CD27+ B cells identified in HD and AID deficient patients. Representative histogram plots gated on HD or P1 CD27 (grey) and CD27+ (red) B cells showing the geometric mean of (i) SSC (90° light/side scatter), as a measure of cellular granularity, and (j) IgM surface expression. Each data point corresponds to individual healthy donors or AID-deficient patients; mean ± SEM are also shown. Results combined from at least three independent experiments. Statistical significance was determined by Mann–Whitney test, *P < 0.05, **P < 0.01, ***P < 0.001, ****P < 0.0001
Fig. 3
Fig. 3
In vitro Ig switching and Ig secretion are impaired by the heterozygous AID L189X variant. (a-d). Sort-purified naïve B cells from healthy donors (HD, n = 3–13), P1 or P2 (heterozygous AID L189X variant) and P5 (homozygous AID I136X variant) were CFSE-labelled and cultured with CD40L alone or in combination with IL-4 (100 U/ml), IL-21 (50 ng/ml), or IL-4 and IL-21 for 5 days. After this time, cells were harvested and labelled with Zombie Aqua and mAb against IgG and IgA, followed by flow cytometric analysis. (a, upper panel) Histograms showing CFSE dilution of B cell from three healthy donors (HD1-HD3), P1, and P2 from one representative experiment. (a, lower panel) CFSE analysis for naïve B cells from healthy donors (n = 13) and P1 and P2 (n = 3), showing the frequency in each cell division interval. Values represent the means ± SEM of three independent experiments. (b, left panel) Representative contour plots from one HD and P1 showing the frequencies of IgG+ switched B cells vs proliferation (CFSE). (b, right panel) Percentage of IgG+ and IgA+ switched cells in cultures of naïve B cells from HD or patients with AID deficiency. Values depict data from individual HD and patients, and mean ± SEM. Statistical significance was determined by Mann–Whitney test, *P < 0.05, **P < 0.01, ***P < 0.001, ****P < 0.0001. c-d Sort-purified naïve (c) and memory (d) B cells from healthy donors (n = 10), P1 and P2 (n = 3) and P5 (n = 1) were cultured with CD40L and either IL-4 (100 U/ml), IL-21 (50 ng/ml), or IL-4 and IL-21. After 7 days, the amount of IgM, IgG and IgA secreted into the culture supernatant was measured by ELISA. Each point represents a different individual. The data shown are representative of three independent experiments, bars show median and interquartile ranges. Statistical significance was determined by Mann–Whitney tests, *P < 0.05, **P < 0.01
Fig. 4
Fig. 4
Impaired generation of spike SARS‐CoV‐2 B‐cells in AID deficient patients. PBMCs from healthy donors (HD) and AID deficient patients P1, P2 (AID L189X/WT), P4 (R190X/WT) and P5 (I136X/I136X) were collected at different time points following vaccination against and/or infection with SARS-CoV-2 and incubated with full-length SARS-CoV-2 Spike protein to detect spike-binding B cells (CD19+spike+). a Frequency of total Spike-binding B cells in pre-pandemic healthy donors (HD, dark grey circles), SARS-CoV-2 vaccinated and infected healthy donors (HD, light grey circles), P1 (L189X/WT, purple bars) and P2 (L189X/WT, violet bars) at the indicated time points indicated following infection/vaccination. Striped bars represent samples after natural infections. b Frequency of total Spike-binding B cells in vaccinated HD (grey circles), P4 (R190X/WT, light blue bars) and P5 (I136X/I136X, dark blue bars) detected at different time following vaccination (2–3 weeks, 3 months and 6–9 months after 2nd dose vaccine). Dotted line represent the limit of detection. Each point represents a different individual (HD)
Fig. 5
Fig. 5
Heterozygous AID L189X variant dramatically disrupts somatic hypermutations (SHM). Deep sequencing of IGHG, IGHA and IGHM transcripts of transitional (CD27CD10+), naïve (CD27CD10) and memory (CD27+CD10) B cells from healthy donors (HD, n = 3), P1 (L189X/WT), P2 (L189X/WT) and P5 (I136X/I136X). a Median SHM% across all clones from transitional, naïve and memory (CD27+CD10) B cells from HDs, P1, P2 and P5. Individual clones were summarise by median SHM from all reads. Filled circles show data for each individual and boxplots summarise the median, 25th/75th percentile and 1.5*IQR for each group (patient or HD) for each cell type/isotype. b Distribution of median SHM% for clones from each sample. Lines are coloured by cell type and group. c Frequency of mutations occurring at WRC/GYW motifs in transitional, naïve and memory IgM. Data from pooling all mutations from each individual using a representative sequence from each clone. Filled circles show data for each individual and boxplots summarise each group. d Frequency of mutations occurring at WA/TW motifs in transitional, naïve and memory IgM. Data from pooling all mutations from each individual using a representative sequence from each clone. Filled circles show data for each individual and boxplots summarise each group (e) Ratio of replacement (R, non-synonomous) to silient (S, synonomous) amino acid (AA) changes in transitional, naïve and memory IgM for each individual. Boxplots summarise R:S ratios in clone representatives. Outliers are not plotted. f Mean AA lengths of complementarity-determining region 3 (CDR3) for clones from each individual for transitional, naïve and memory B cells. Filled circles show data for each individual and boxplots summarise group. g Distribution of CDR3 lengths for patients (upper) and healthy donors (lower) within the IgM + memory compartment. Each bar indicates the mean % clones for the AA length and error bars show standard deviation. Overall mean CDR3 length for each group indicated by dashed red line. The proportion of clones with long CDR3s (> 22AAs) is indicated. h Frequency of clones with IGH rearrangements using IGHJ4 or IGHJ6 for transitional, naïve and memory IgM B cells. Filled circles show data for each individual and boxplots summarise each group. i Shannon Index (H) as a measure of clone diversity. Filled circles show data for each individual and boxplots summarise each group. j Clone sizes for ten largest clones from each sample. Each clone is represented as a stacked section that indicates the clone size as a percentage of total reads from the sample. Bars are coloured for the individual

Similar articles

Cited by

References

    1. LeBien TW, Tedder TF. B lymphocytes: how they develop and function. Blood. 2008;112(5):1570–1580. - PMC - PubMed
    1. Banchereau J, Rousset F. Human B lymphocytes: phenotype, proliferation, and differentiation. Adv Immunol. 1992;52:125–262. - PubMed
    1. Liu YJ, de Bouteiller O, Fugier-Vivier I. Mechanisms of selection and differentiation in germinal centers. Curr Opin Immunol. 1997;9(2):256–262. - PubMed
    1. Goodnow CC, Vinuesa CG, Randall KL, Mackay F, Brink R. Control systems and decision making for antibody production. Nat Immunol. 2010;11(8):681–688. - PubMed
    1. Stavnezer J, Guikema JE, Schrader CE. Mechanism and regulation of class switch recombination. Annu Rev Immunol. 2008;26:261–292. - PMC - PubMed

Publication types

MeSH terms

Substances

LinkOut - more resources