. 2024 Mar 4;221(3):e20230679.
doi: 10.1084/jem.20230679. Epub 2024 Feb 16.

A TNF-IL-1 circuit controls Yersinia within intestinal pyogranulomas

Affiliations

A TNF-IL-1 circuit controls Yersinia within intestinal pyogranulomas

Rina Matsuda et al. J Exp Med. .

Abstract

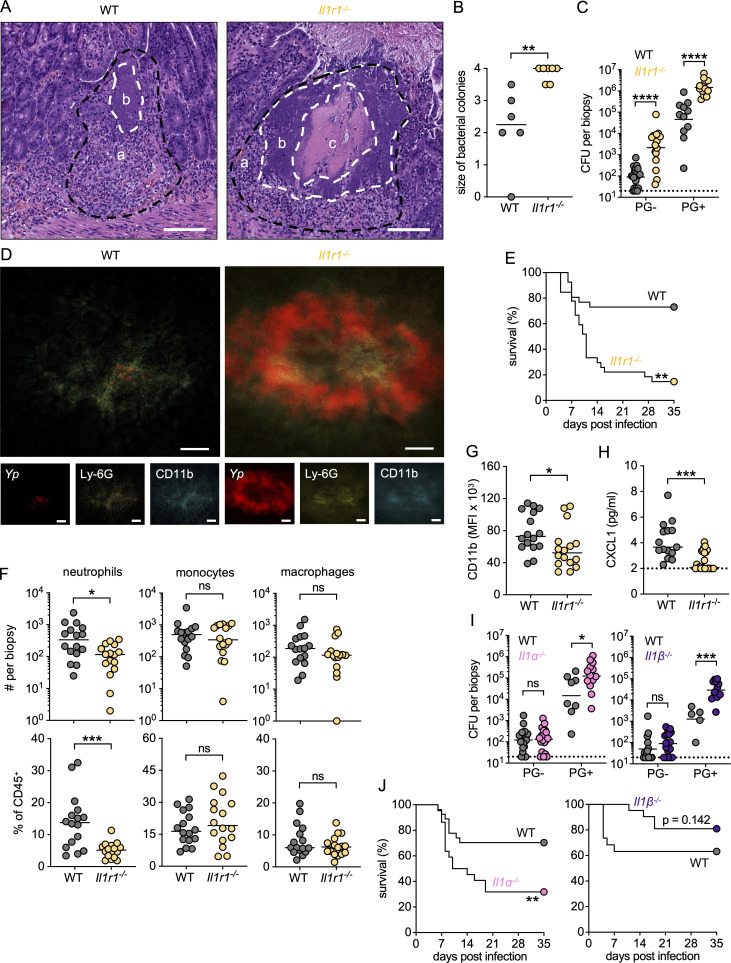
Tumor necrosis factor (TNF) is a pleiotropic inflammatory cytokine that mediates antimicrobial defense and granuloma formation in response to infection by numerous pathogens. We previously reported that Yersinia pseudotuberculosis colonizes the intestinal mucosa and induces the recruitment of neutrophils and inflammatory monocytes into organized immune structures termed pyogranulomas (PG) that control Yersinia infection. Inflammatory monocytes are essential for the control and clearance of Yersinia within intestinal PG, but how monocytes mediate Yersinia restriction is poorly understood. Here, we demonstrate that TNF signaling in monocytes is required for bacterial containment following enteric Yersinia infection. We further show that monocyte-intrinsic TNFR1 signaling drives the production of monocyte-derived interleukin-1 (IL-1), which signals through IL-1 receptors on non-hematopoietic cells to enable PG-mediated control of intestinal Yersinia infection. Altogether, our work reveals a monocyte-intrinsic TNF-IL-1 collaborative inflammatory circuit that restricts intestinal Yersinia infection.


Conflict of interest statement

Disclosures: The authors declare no competing interests exist.

Figures

Figure S1.
Figure S1.
Effects of TNFR1 deficiency on PG formation in intestinal and lymphatic tissue during Yp infection. (A) Total number of intestinal lesions at day 5 after infection with Yp. Each circle represents one mouse. Lines represent the median. Pooled data from four independent experiments. (B) Total numbers of CD45+ hematopoietic cells in PG+ small intestinal tissue isolated 5 days after infection. Each circle represents the mean of 3–20 pooled punch biopsies from one mouse. Lines represent the median. Pooled data from three independent experiments. (C) Flow cytometry plots depicting the gating strategy employed to identify neutrophils (CD11b+ Ly-6G+), monocytes (CD64+ Ly-6Chi), and macrophages (CD64+ Ly-6Clo MHC-IIhi) in small intestinal PG+ tissue. Plots representative of three independent experiments. (D) Fluorescently labeled whole-mount small intestinal PG+ tissue from Yp-infected Ccr2gfp/gfp mouse at day 5 after infection. Red (Yp-mCherry), yellow (Ly-6G-AF647), and blue (CD11b-AF700). Scale bar = 100 μm. Representative image of two independent experiments. (E) Total number of intestinal lesions at day 5 after infection with Yp. Each circle represents one mouse. Lines represent the median. Pooled data from two independent experiments. (F) Bacterial burdens in small intestinal PG and PG+ tissue (left) and indicated organs (right) isolated day 5 after infection. Each circle represents the mean CFU of three to five pooled punch biopsies from one mouse (left) or individual mice (right). Lines represent the geometric mean. Pooled data from two independent experiments. (G) Flow cytometry plots depicting chimerism (left) and frequencies of indicated cell types (right) in the blood of uninfected chimeric mice. Graphs represent pooled data from two independent experiments. All statistical analyses by Mann–Whitney U test. *P < 0.05, ns = not significant.
Figure 1.
Figure 1.
TNFR1 is required for organized PG formation and Yp control. (A) H&E-stained paraffin-embedded small intestinal sections from Yp-infected WT (left) and Tnfr1−/− (right) mice at day 5 after infection; a (black dashed lines) = immune cell infiltrate, b = bacterial colony, and c = necrosis. White dashed lines delineate the edges of central necrosis and extracellular colonies. Images representative of two independent experiments. Scale bars = 100 μm. (B) Histopathological scores of small intestinal tissue from Yp-infected WT and Tnfr1−/− mice at day 5 after infection. Each mouse was scored between 0 and 4 (minimal to extensive) for the size of the bacterial colony. Each circle represents one mouse. Lines represent the median. Pooled data from two independent experiments. (C) Bacterial burdens in small intestinal PG and PG+ tissue isolated on day 5 after infection. Each circle represents the mean CFU of three to five pooled punch biopsies from one mouse. Lines represent the geometric mean. Pooled data from three independent experiments. (D) Total numbers (top) and frequencies (bottom) of neutrophils, monocytes, and macrophages in PG+ small intestinal tissue isolated 5 days after infection. Each circle represents the mean of 3–20 pooled punch biopsies from one mouse. Lines represent the median. Pooled data from three independent experiments. (E) Fluorescently labeled whole-mount small intestinal PG+ tissue from Yp-infected WT (left) and Tnfr1−/− (right) mice at day 5 after infection. Red (Yp-mCherry), yellow (Ly-6G-AF647), and blue (CD11b-AF700). Scale bars = 100 μm. Representative image of two independent experiments. (F) CD11b surface expression on neutrophils in PG+ tissue at day 5 after infection. Each circle represents the mean of 3–10 pooled punch biopsies from one mouse. Lines represent the median. Data are representative of three independent experiments. (G) Bacterial burdens in indicated organs at day 5 after infection. Each circle represents one mouse. Lines represent the geometric mean. Pooled data from four independent experiments. (H) Survival of infected WT (n = 9) and Tnfr1−/− (n = 21) mice. Pooled data from two independent experiments. (I) Bacterial burdens in small intestinal PG and PG+ tissue at day 5 after infection of indicated chimeric mice. Each symbol represents the mean Yp CFU of three to five pooled punch biopsies from one mouse. Lines represent the geometric mean. Pooled data from two independent experiments. (J) Bacterial burdens in indicated organs at day 5 after infection of indicated chimeric mice. Each symbol represents one mouse. Lines represent the geometric mean. Pooled data from two independent experiments. Statistical analysis by Mann–Whitney U test (B–D, F, and G), Mantel–Cox test (H), and Kruskal–Wallis test with Dunn’s multiple comparisons correction (I and J). *P < 0.05, **P < 0.01, ***P < 0.001, ****P < 0.0001, ns = not significant.
Figure 2.
Figure 2.
Autocrine TNF signaling in monocytes is required for control of Yp. (A) Schematic of mixed BM chimeras. Lethally irradiated WT mice reconstituted with BM cells from indicated donor mice yield either a TNFR1-sufficient immune system (left), an immune system in which all monocytes lack TNFR1 whereas half of the remaining immune cells are TNFR1-proficient (middle), or a TNFR1-sufficient immune system devoid of monocytes (right). (B) H&E-stained paraffin-embedded small intestinal sections from chimeric WT mice reconstituted with Ccr2gfp/gfp + WT (left), Ccr2gfp/gfp + Tnfr1−/− (middle), or Ccr2gfp/gfp (right) BM at day 5 after infection; a (black dashed lines) = immune cell infiltrate, b = bacterial colony, c = necrosis. White dashed lines delineate the edges of central necrosis and extracellular bacterial colonies. Scale bars = 100 μm. Images representative of two independent experiments. (C) Bacterial burdens in small intestinal PG and PG+ tissue of chimeric WT mice reconstituted with either Ccr2gfp/gfp:WT (circles), Ccr2gfp/gfp:Tnfr1−/− (squares), or Ccr2gfp/gfp (diamonds) at day 5 after Yp infection. Each symbol represents one mouse. Lines represent the geometric mean. Pooled data from two independent experiments. (D) Bacterial burdens in indicated organs at day 5 after infection. Each symbol represents one mouse. Lines represent the geometric mean. Pooled data from two independent experiments. (E) Bacterial burdens in small intestinal PG and PG+ tissue of chimeric WT mice reconstituted with either Tnf−/−:WT (circles), Tnf−/−:Ccr2gfp/gfp (squares), or Tnf−/− (diamonds) at day 5 after Yp infection. Each symbol represents one mouse. Lines represent the geometric mean. Pooled data from three independent experiments. (F) Bacterial burdens in indicated organs at day 5 after infection. Each symbol represents one mouse. Lines the represent geometric mean. Pooled data from three independent experiments. All statistical analyses by Kruskal–Wallis test with Dunn’s multiple comparisons correction. **P < 0.01, ***P < 0.001, ****P < 0.0001, ns = not significant.
Figure S2.
Figure S2.
Autocrine TNF signaling in monocytes is required for systemic control of Yp. (A) Flow cytometry plots (top) and graphs (bottom) depicting the percent chimerism of hematopoietic cells in the blood of uninfected chimeric mice. (B) Flow cytometry plots (top) and graphs (bottom) depicting the percent chimerism of hematopoietic cells in the spleens of chimeric mice. (C) Bacterial burdens in indicated organs at day 5 after infection. Each symbol represents one mouse. Lines represent the geometric mean. (D) Bacterial burdens in small intestinal PG and PG+ tissue at day 5 after Yp infection. Each symbol represents one mouse. Lines represent the geometric mean. (E) Flow cytometry plots (top) and graphs (bottom) depicting the percent chimerism of hematopoietic cells in PG of chimeric mice. All data were pooled from two independent experiments. All statistical analyses by Kruskal–Wallis test with Dunn’s multiple comparisons correction. *P < 0.05, **P < 0.01, ***P < 0.001, ****P < 0.0001, ns = not significant.
Figure 3.
Figure 3.
TNFR1 signaling in monocytes controls Yp independently of RIPK1 kinase–induced cell death. (A) H&E-stained paraffin-embedded small intestinal sections from WT (left) and Ripk1K45A (right) mice at day 5 after Yp infection; a (black dashed lines) = immune cell infiltrate, b = bacterial colony, c = necrosis. White dashed lines delineate the edges of central necrosis and extracellular bacterial colonies. Scale bars = 100 μm. Images representative of two independent experiments. (B) Bacterial burdens in small intestinal PG and PG+ tissue (left) and indicated organs (right) of WT and Ripk1K45A mice at day 5 after Yp infection. Each circle represents one mouse. Lines represent the geometric mean. Pooled data from two independent experiments. (C) H&E-stained paraffin-embedded small intestinal sections from chimeric WT mice reconstituted with either Ccr2gfp/gfp:WT (left), Ccr2gfp/gfp:Ripk1K45A (middle), or Ccr2gfp/gfp (right) BM at day 5 after Yp infection. a (black dashed lines) = immune cell infiltrate, b = bacterial colony, c = necrosis. White dashed lines delineate the edges of central necrosis and extracellular bacterial colonies. Scale bars = 100 μm. Representative images of two independent experiments. (D) Bacterial burdens in small intestinal PG and PG+ tissue of chimeric WT mice reconstituted with either Ccr2gfp/gfp:WT (circles), Ccr2gfp/gfp:Ripk1K45A (squares), or Ccr2gfp/gfp (diamonds) at day 5 after Yp infection. Each symbol represents one mouse. Lines represent the geometric mean. Pooled data from two independent experiments. (E) Bacterial burdens in indicated organs of chimeric WT mice reconstituted with either Ccr2gfp/gfp:WT (circles), Ccr2gfp/gfp:Ripk1K45A (squares), or Ccr2gfp/gfp (diamonds) at day 5 after Yp infection. Each symbol represents one mouse. Lines represent the geometric mean. Pooled data from two independent experiments. (F) Bacterial burdens in indicated organs of WT (gray) and Tnfr1−/− (red) mice infected with WT (circles) or ΔyopJ (squares) Yp at day 5 after infection. Each symbol represents one mouse. Lines represent the geometric mean. Pooled data from four independent experiments. (G) H&E-stained paraffin-embedded small intestinal sections from WT and Tnfr1−/− mice infected with either WT or ΔyopJ Yp at day 5 after infection. a (black dashed lines) = immune cell infiltrate, b = bacterial colony, c = necrosis. White dashed lines delineate the edges of central necrosis and extracellular bacterial colonies. Scale bars = 100 μm. Representative images of three independent experiments. (H) Survival of WT (gray) and Tnfr1−/− (red) mice infected with WT (circles) or ΔyopJ (squares) Yp. n = 9–12 mice per group. Pooled data from two independent experiments. (I) Survival of WT (gray) or Tnfr1−/− (red) mice infected with WT (circles) or yopEH (squares) Yp. n = 11–15 mice per group. Pooled data from two independent experiments. Statistical analysis by Mann–Whitney U test (B), Kruskal–Wallis test with Dunn’s multiple comparisons correction (D–F), and Mantel–Cox test (H and I). *P < 0.05, **P < 0.01, ***P < 0.001, ****P < 0.0001, ns = not significant.
Figure S3.
Figure S3.
TNFR1 signaling in monocytes is independent of YopJ-induced RIPK1 kinase activity. (A) Schematic of mixed BM chimeras. Lethally irradiated WT mice reconstituted with BM cells from indicated donor mice yield either a RIPK1 kinase–sufficient immune system (left), one in which all monocytes lack RIPK1 kinase activity whereas half of the remaining immune cells are RIPK1 kinase–sufficient (middle), or a RIPK1 kinase–sufficient immune system devoid of monocytes (right). (B) Flow cytometry plots depicting chimerism (top) and graphs depicting frequencies of indicated cell types (bottom) in the blood of uninfected chimeric mice. (C) Survival of WT (left) and Tnfr1−/− (right) mice infected with WT (circles), ΔyopE (white squares), or YopHR409A (gray squares) Yp. n = 5–32 (WT) and 13–20 (Tnfr1−/−) mice per group. Pooled data from two to four independent experiments. All statistical analyses by Mantel–Cox test. ***P < 0.001, ns = not significant.
Figure 4.
Figure 4.
Cell-intrinsic TNFR1 signaling is required for maximal IL-1 production within intestinal PGs during Yp infection. (A) Cytokine levels in tissue punch biopsy homogenates isolated 5 days after infection of chimeric WT mice reconstituted with indicated donor cells. Each symbol represents the mean of 3–10 pooled punch biopsies from one mouse. Lines represent the median. Pooled data from two independent experiments. (B) Frequency of IL-1α– or IL-1β–producing monocytes and neutrophils isolated from small intestinal PG+ tissue 5 days after infection. Each circle represents the mean of 3–10 pooled punch biopsies from one mouse. Lines represent the median. Pooled data from three independent experiments. (C) Flow cytometry plots of intracellular IL-1 staining in monocytes (CD64+ Ly-6Chi) from small intestinal PG+ tissue at day 5 after infection. Plots representative of two independent experiments. (D) Intracellular IL-1 staining in monocytes and neutrophils in small intestinal PG+ tissue at day 5 after infection. Each circle represents the mean of 3–10 pooled punch biopsies from one mouse. Lines connect congenic cell populations within individual mice. Pooled data from two independent experiments. Statistical analysis by Kruskal–Wallis test with Dunn’s multiple comparisons correction (A), Mann–Whitney U test (B), and for congenically marked cells within mice: Wilcoxon test; across groups: Mann–Whitney U test (D). *P < 0.05, **P < 0.01, ****P < 0.0001, ns = not significant.
Figure S4.
Figure S4.
Cytokine production downstream of TNFR1 expression on monocytes is specific to IL-1 in intestinal PGs. (A) Cytokine levels in homogenates of PG and PG+ tissue punch biopsies at day 5 after infection of chimeric WT mice reconstituted with indicated cells. Each symbol represents the mean of 3–10 pooled punch biopsies from one mouse. Lines represent the median. Pooled data from two independent experiments. (B) Cytokine levels in serum at day 5 after infection of chimeric WT mice reconstituted with indicated cells. Lines represent the median. Pooled data from two independent experiments. (C) Flow cytometric plots and graphs depicting frequencies of indicated cell types in small intestinal PG+ tissue or spleen at day 5 after infection of WT chimeric mice reconstituted with the indicated cells. Plots representative of two independent experiments. Pooled data from two independent experiments. (D) Flow cytometry plots of intracellular IL-1 in monocytes (CD64+ Ly-6Chi) from small intestinal PG+ tissue in WT and Il1b−/− mice at day 5 after infection. Plots representative of two independent experiments. (E) Frequency of monocytes and neutrophils producing TNF in small intestinal PG+ tissue at day 5 after infection. Each circle represents the mean of 3–10 pooled punch biopsies from one mouse. Lines connect congenic cell populations within individual mice. Pooled data from two independent experiments. (F) Frequency of monocytes producing the indicated cytokines (left) and flow cytometric plots depicting intracellular cytokine staining (right) in monocytes isolated from small intestinal PG+ tissue 5 days after infection. Each circle represents the mean of 3–10 pooled punch biopsies from one mouse. Lines represent the median. Pooled data from three independent experiments. (G) Bacterial burdens in small intestinal PG and PG+ tissue (left) and indicated organs (right) of WT and Tlr4−/− mice at day 5 after Yp infection. Each symbol represents one mouse. Lines represent the geometric mean. Pooled data from two independent experiments. Statistical analyses by Kruskal–Wallis test with Dunn’s multiple comparisons correction (A and B). For congenically marked cells within mice, Wilcoxon test; across groups, Mann–Whitney U test (E), and Mann–Whitney U test (F and G). ****P < 0.0001, ns = not significant.
Figure 5.
Figure 5.
IL-1 signaling is required for PG formation and intestinal control of Yp. (A) H&E-stained paraffin-embedded small intestinal sections from Yp-infected mice at day 5 after infection; a (black dashed lines) = immune cell infiltrate, b = bacterial colony, c = necrosis. White dashed lines delineate the edges of central necrosis and extracellular bacterial colonies. Representative images of one experiment. Scale bars = 250 µm. (B) Histopathological scores of small intestinal tissue from uninfected or Yp-infected mice at day 5 after infection. Each mouse was scored between 0 and 4 (minimal to extensive) for the size of the bacterial colony. Each circle represents one mouse. Lines represent the median. Pooled data from two experiments. (C) Bacterial burdens in small intestinal PG and PG+ tissues isolated 5 days after infection. Each circle represents the mean of three to five pooled punch biopsies from one mouse. Lines represent the geometric mean. Pooled data from three independent experiments. (D) Fluorescently labeled whole-mount small intestinal PG+ tissue from Yp-infected WT (left) and Il1r1−/− (right) mice at day 5 after infection. Red (Yp-mCherry), yellow (Ly-6G-AF647), blue (CD11b-AF700). Scale bars = 100 μm. Representative image of two independent experiments. (E) Survival of infected WT (n = 26) and Il1r1−/− (n = 20) mice. Pooled data from two independent experiments. (F) Total numbers (top) and frequencies (bottom) of neutrophils, monocytes, and macrophages in PG+ small intestinal tissue isolated 5 d after infection. Each circle represents the mean of 3–20 pooled punch biopsies from one mouse. Lines represent the median. Pooled data from three independent experiments. (G) CD11b surface expression on neutrophils in PG+ tissue at day 5 after infection. Each circle represents the mean of 3–10 pooled punch biopsies from one mouse. Lines represent the median. Data representative of three independent experiments. (H) CXCL1 levels in PG+ tissue punch biopsy homogenates isolated 5 days after infection. Each datapoint represents the mean of 3–20 pooled punch biopsies from one mouse. Lines represent the median. Pooled data from three independent experiments. (I) Bacterial burdens in small intestinal PG and PG+ tissues at day 5 after infection of indicated genotypes. Each circle represents the mean of three to five pooled punch biopsies from one mouse. Lines represent the geometric mean. Pooled data from three independent experiments. (J) Survival of infected WT (left: n = 27; right: n = 19), Il1a−/− (n = 22), and Il1b−/− (n = 21) mice. Pooled data from (left) three and (right) two independent experiments. Statistical analysis by Mann–Whitney U test (B, C, and F–I) and Mantel–Cox test (E and J). *P < 0.05, **P < 0.01, ***P < 0.001, ****P < 0.0001, ns = not significant.
Figure S5.
Figure S5.
Monocyte-derived IL-1 signals to non-hematopoietic cells to restrict Yp infection. (A) Bacterial burdens in Peyer’s patches (PP) at day 5 after infection. Each circle represents one mouse. Lines represent the geometric mean. Pooled data from three independent experiments. (B) Bacterial burdens in indicated organs at day 5 after infection. Each circle represents one mouse. Lines represent the geometric mean. Pooled data from three independent experiments. (C) Cytokine levels in PG+ tissue punch biopsy homogenates isolated 5 days after infection. Each datapoint represents the mean of 3–20 pooled bunch biopsies from one mouse. Lines represent the median. Pooled data from three independent experiments. (D and E) Bacterial burdens in indicated organs at day 5 after infection. Each circle represents one mouse. Lines represent the geometric mean. Pooled data from three independent experiments. (F) Flow cytometric plots and graphs depicting the percent chimerism in the blood of chimeric mice. Flow cytometric plots are representative of two independent experiments. Pooled data from two independent experiments. (G) Bacterial burdens in Peyer’s patches isolated 5 days after infection. Each symbol represents one mouse. Lines represent the geometric mean. Pooled data from three independent experiments. (H) Frequencies of indicated cell types in small intestinal PG+ tissue at day 5 after infection of indicated chimeric mouse. Pooled data from three independent experiments. (I) Bacterial burdens in Peyer’s patches isolated 5 days after infection. Each symbol represents one mouse. Lines represent the geometric mean. Pooled data from three independent experiments. Statistical analysis by Mann–Whitney U test (A–E), and Kruskal–Wallis test with Dunn’s multiple comparisons correction (G and I). *P < 0.05, **P < 0.01, ***P < 0.001, ****P < 0.0001, ns = not significant.
Figure 6.
Figure 6.
Monocyte-derived IL-1 signals to non-hematopoietic cells to restrict Yp in intestinal PGs. (A) Bacterial burdens in small intestinal PG and PG+ tissues at day 5 after infection of indicated chimeric mice. Each symbol represents the mean of three to five pooled punch biopsies from one mouse. Lines represent the geometric mean. Data were pooled from four independent experiments. (B) Bacterial burdens in the indicated organ at day 5 after infection of indicated chimeric mouse. Each symbol represents one mouse. Lines represent the geometric mean. Pooled data from four independent experiments. (C) Bacterial burdens in small intestinal PG and PG+ tissues at day 5 after infection of indicated chimeric mice. Each symbol represents the mean of three to five pooled punch biopsies from one mouse. Lines represent the geometric mean. Pooled data from three independent experiments. (D) Bacterial burdens in indicated organs at day 5 after infection of the indicated chimeric mouse. Each symbol represents one mouse. Lines represent the geometric mean. Data were pooled from three independent experiments. (E) Model of TNF-IL-1 circuit mediated by monocytes and non-hematopoietic cells to restrict Yp infection within intestinal PGs. All statistical analyses by Kruskal–Wallis test with Dunn’s multiple comparisons correction. *P < 0.05, **P < 0.01, ***P < 0.001, ****P < 0.0001, ns = not significant.

Update of

References

    1. Adams, K.N., Takaki K., Connolly L.E., Wiedenhoft H., Winglee K., Humbert O., Edelstein P.H., Cosma C.L., and Ramakrishnan L.. 2011. Drug tolerance in replicating mycobacteria mediated by a macrophage-induced efflux mechanism. Cell. 145:39–53. 10.1016/j.cell.2011.02.022 - DOI - PMC - PubMed
    1. Aizawa, E., Karasawa T., Watanabe S., Komada T., Kimura H., Kamata R., Ito H., Hishida E., Yamada N., Kasahara T., et al. . 2020. GSDME-dependent incomplete pyroptosis permits selective IL-1α release under caspase-1 inhibition. iScience. 23:101070. 10.1016/j.isci.2020.101070 - DOI - PMC - PubMed
    1. Al-Sadi, R.M., and Ma T.Y.. 2007. IL-1β causes an increase in intestinal epithelial tight junction permeability. J. Immunol. 178:4641–4649. 10.4049/jimmunol.178.7.4641 - DOI - PMC - PubMed
    1. Algood, H.M.S., Lin P.L., and Flynn J.L.. 2005. Tumor necrosis factor and chemokine interactions in the formation and maintenance of granulomas in tuberculosis. Clin. Infect. Dis. 41:S189–S193. 10.1086/429994 - DOI - PubMed
    1. Ali, T., Kaitha S., Mahmood S., Ftesi A., Stone J., and Bronze M.S.. 2013. Clinical use of anti-TNF therapy and increased risk of infections. Drug Healthc. Patient Saf. 5:79–99. 10.2147/DHPS.S28801 - DOI - PMC - PubMed

LinkOut - more resources