

Clinician Risk Tolerance and Rates of Admission From the Emergency Department
- PMID: 38363570
- PMCID: PMC10873771
- DOI: 10.1001/jamanetworkopen.2023.56189
Clinician Risk Tolerance and Rates of Admission From the Emergency Department
Abstract
Importance: Much remains unknown about the extent of and factors that influence clinician-level variation in rates of admission from the emergency department (ED). In particular, emergency clinician risk tolerance is a potentially important attribute, but it is not well defined in terms of its association with the decision to admit.
Objective: To further characterize this variation in rates of admission from the ED and to determine whether clinician risk attitudes are associated with the propensity to admit.
Design, setting, and participants: In this observational cohort study, data were analyzed from the Massachusetts All Payer Claims Database to identify all ED visits from October 2015 through December 2017 with any form of commercial insurance or Medicaid. ED visits were then linked to treating clinicians and their risk tolerance scores obtained in a separate statewide survey to examine the association between risk tolerance and the decision to admit. Statistical analysis was performed from 2022 to 2023.
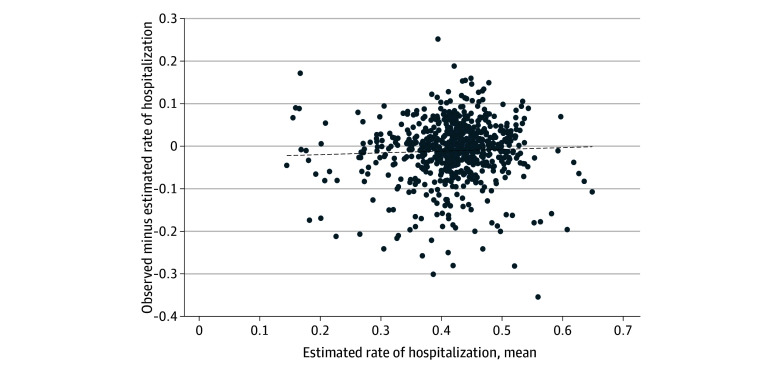
Main outcomes and measures: The ratio between observed and projected admission rates was computed, controlling for hospital, and then plotted against the projected admission rates to find the extent of variation. Pearson correlation coefficients were then used to examine the association between the mean projected rate of admission and the difference between actual and projected rates of admission. The consistency of clinician admission practices across a range of the most common conditions resulting in admission were then assessed to understand whether admission decisions were consistent across different conditions. Finally, an assessment was made as to whether the extent of deviation from the expected admission rates at an individual level was associated with clinician risk tolerance.
Results: The study sample included 392 676 ED visits seen by 691 emergency clinicians. Among patients seen for ED visits, 221 077 (56.3%) were female, and 236 783 (60.3%) were 45 years of age or older; 178 890 visits (46.5%) were for patients insured by Medicaid, 96 947 (25.2%) were for those with commercial insurance, 71 171 (18.5%) were Medicare Part B or Medicare Advantage, and the remaining 37 702 (9.8%) were other insurance category. Of the 691 clinicians, 429 (62.6%) were male; mean (SD) age was 46.5 (9.8) years; and 72 (10.4%) were Asian, 13 (1.9%) were Black, 577 (83.5%) were White, and 29 (4.2%) were other race. Admission rates across the clinicians included ranged from 36.3% at the 25th percentile to 48.0% at the 75th percentile (median, 42.1%). Overall, there was substantial variation in admission rates across clinicians; physicians were just as likely to overadmit or underadmit across the range of projected rates of admission (Pearson correlation coefficient, 0.046 [P = .23]). There also was weak consistency in admission rates across the most common clinical conditions, with intraclass correlations ranging from 0.09 (95% CI, 0.02-0.17) for genitourinary/syncope to 0.48 (95% CI, 0.42-0.53) for cardiac/syncope. Greater clinician risk tolerance (as measured by the Risk Tolerance Scale) was associated with a statistically significant tendency to admit less than the projected admission rate (coefficient, -0.09 [P = .04]). The other scales studied revealed no significant associations.
Conclusions and relevance: In this cohort study of ED visits from Massachusetts, there was statistically significant variation between ED clinicians in admission rates and little consistency in admission tendencies across different conditions. Admission tendencies were minimally associated with clinician innate risk tolerance as assessed by this study's measures; further research relying on a broad range of measures of risk tolerance is needed to better understand the role of clinician attitudes toward risk in explaining practice patterns and to identify additional factors that may be associated with variation at the clinician level.
Conflict of interest statement
Figures

Similar articles
-
Analysis of Consistency in Emergency Department Physician Variation in Propensity for Admission Across Patient Sociodemographic Groups.JAMA Netw Open. 2021 Sep 1;4(9):e2125193. doi: 10.1001/jamanetworkopen.2021.25193. JAMA Netw Open. 2021. PMID: 34546373 Free PMC article.
-
Association Between US Physician Malpractice Claims Rates and Hospital Admission Rates Among Patients With Lower-Risk Syncope.JAMA Netw Open. 2020 Dec 1;3(12):e2025860. doi: 10.1001/jamanetworkopen.2020.25860. JAMA Netw Open. 2020. PMID: 33320263 Free PMC article.
-
Association of Functional Status, Cognition, Social Support, and Geriatric Syndrome With Admission From the Emergency Department.JAMA Intern Med. 2023 Aug 1;183(8):784-792. doi: 10.1001/jamainternmed.2023.2149. JAMA Intern Med. 2023. PMID: 37307004 Free PMC article.
-
Point-of-care Cognitive Support Technology in Emergency Departments: A Scoping Review of Technology Acceptance by Clinicians.Acad Emerg Med. 2018 May;25(5):494-507. doi: 10.1111/acem.13325. Epub 2017 Nov 8. Acad Emerg Med. 2018. PMID: 28960689
-
Emergency Department Visits for Adults with Diabetes, 2010.2013 Nov. In: Healthcare Cost and Utilization Project (HCUP) Statistical Briefs [Internet]. Rockville (MD): Agency for Healthcare Research and Quality (US); 2006 Feb–. Statistical Brief #167. 2013 Nov. In: Healthcare Cost and Utilization Project (HCUP) Statistical Briefs [Internet]. Rockville (MD): Agency for Healthcare Research and Quality (US); 2006 Feb–. Statistical Brief #167. PMID: 24455787 Free Books & Documents. Review.
Cited by
-
Understanding Provider-Level Variation in Clinical Practice: A Longitudinal Survey of Corticosteroid Use in Septic Shock.CHEST Crit Care. 2025 Jun;3(2):100134. doi: 10.1016/j.chstcc.2025.100134. Epub 2025 Jan 22. CHEST Crit Care. 2025. PMID: 40575578 Free PMC article.
-
Predicting Outcomes in Frail Older Community-Dwellers in Western Australia: Results from the Community Assessment of Risk Screening and Treatment Strategies (CARTS) Programme.Healthcare (Basel). 2024 Jul 5;12(13):1339. doi: 10.3390/healthcare12131339. Healthcare (Basel). 2024. PMID: 38998873 Free PMC article.
-
External evaluation of Brain Injury Guideline (BIG) low risk criteria for traumatic brain injury.Am J Emerg Med. 2024 Dec;86:104-109. doi: 10.1016/j.ajem.2024.10.013. Epub 2024 Oct 11. Am J Emerg Med. 2024. PMID: 39418684
References
Publication types
MeSH terms
Grants and funding
LinkOut - more resources
Full Text Sources
Medical
