. 2024 Feb 27;43(2):113801.
doi: 10.1016/j.celrep.2024.113801. Epub 2024 Feb 14.

DLK signaling in axotomized neurons triggers complement activation and loss of upstream synapses

Affiliations

DLK signaling in axotomized neurons triggers complement activation and loss of upstream synapses

Elham Asghari Adib et al. Cell Rep. .

Abstract

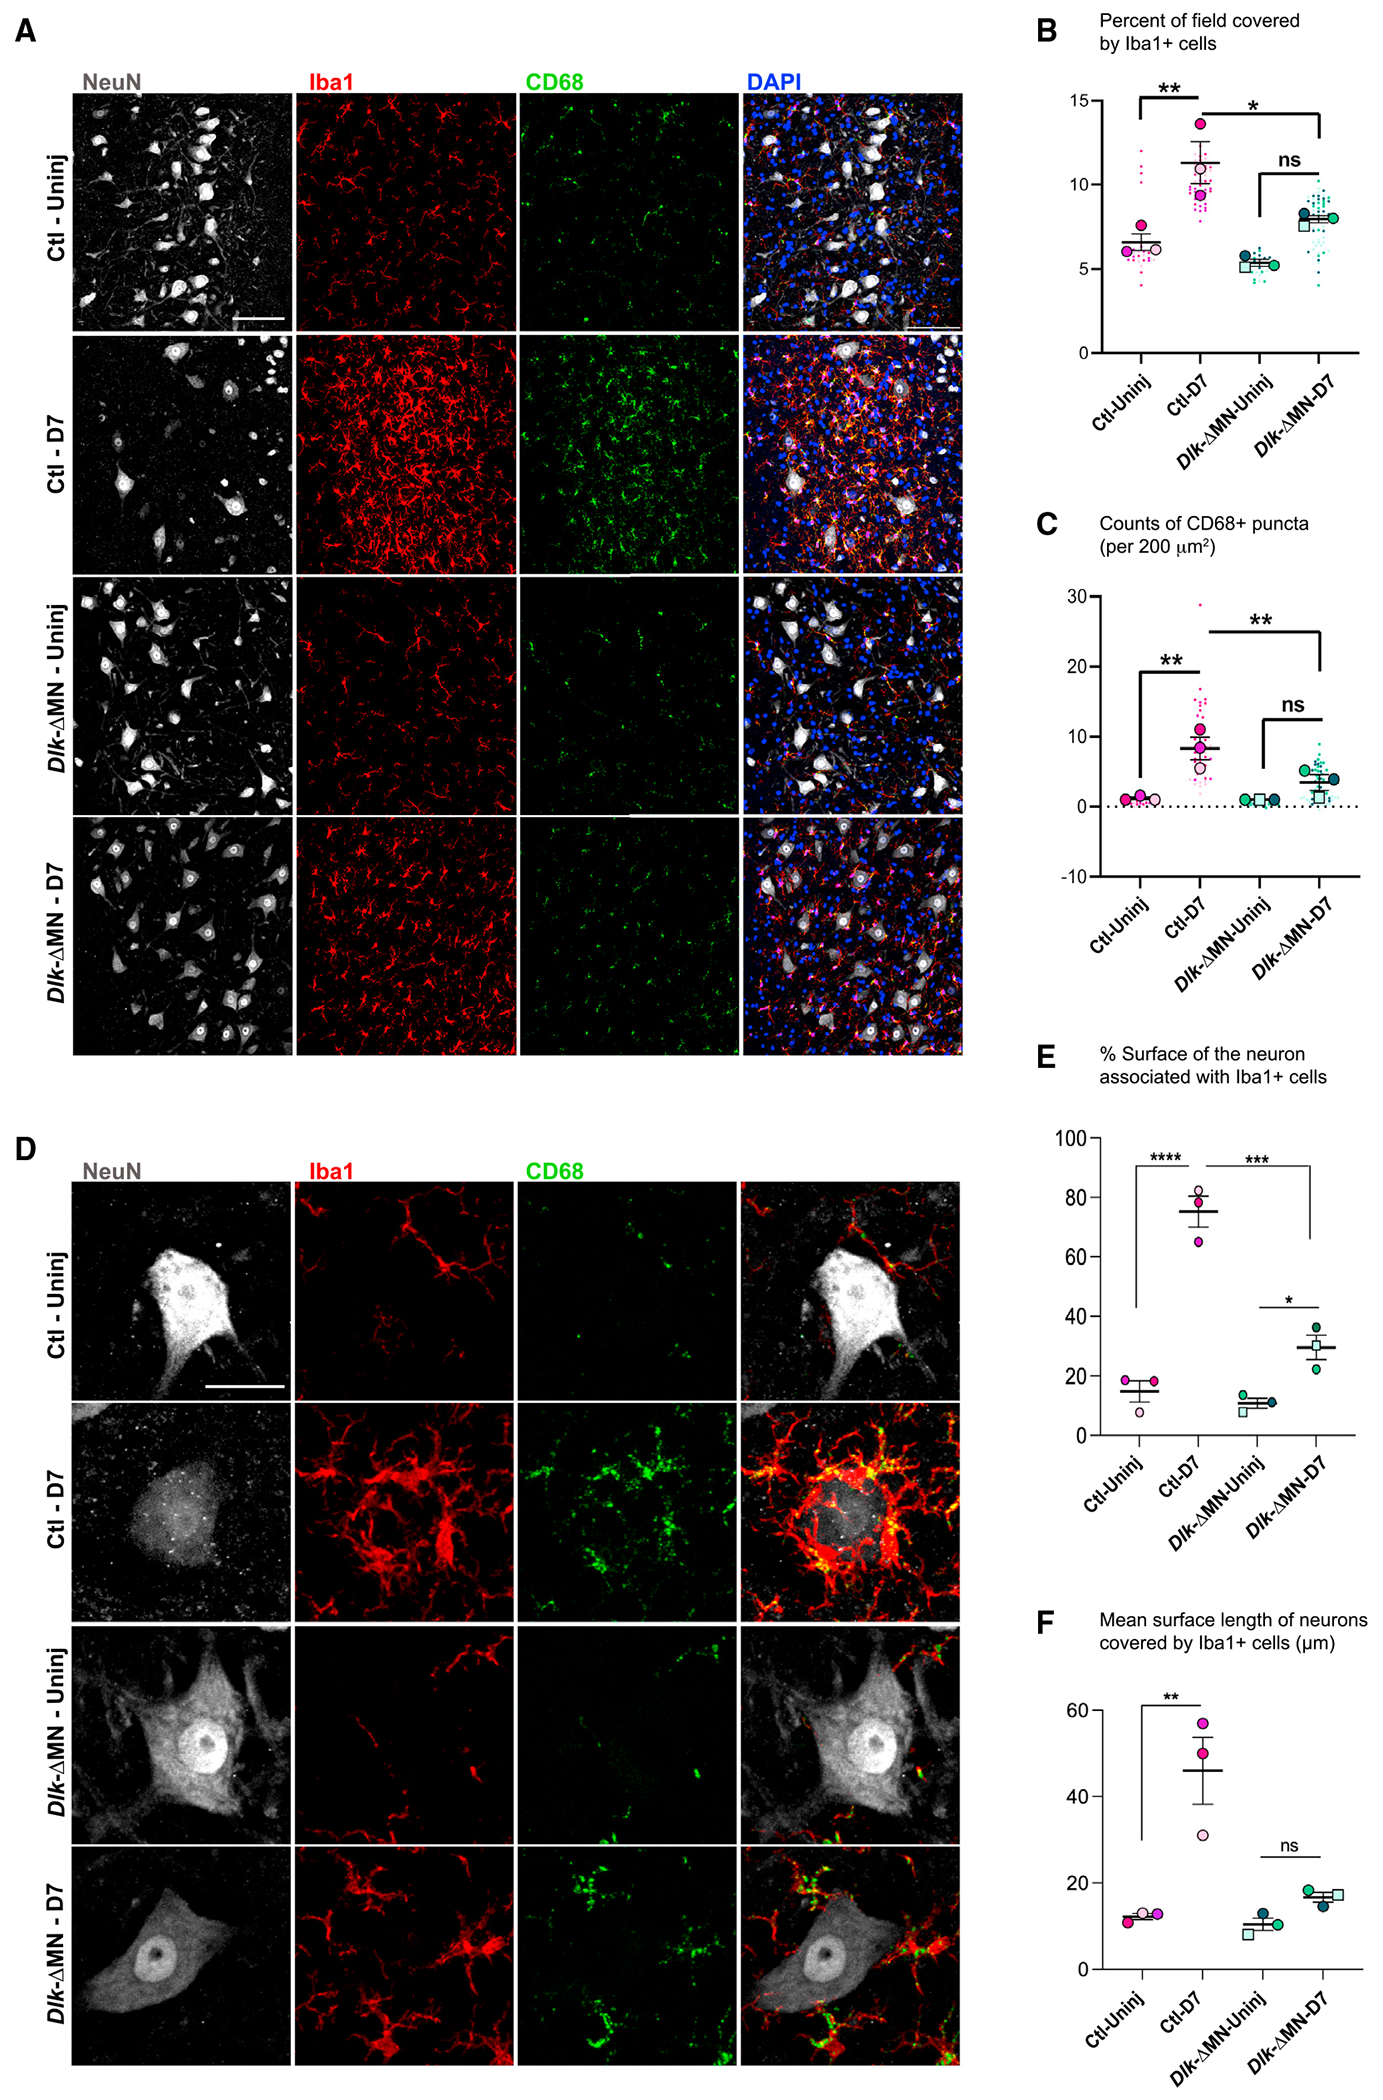
Axotomized spinal motoneurons (MNs) lose presynaptic inputs following peripheral nerve injury; however, the cellular mechanisms that lead to this form of synapse loss are currently unknown. Here, we delineate a critical role for neuronal kinase dual leucine zipper kinase (DLK)/MAP3K12, which becomes activated in axotomized neurons. Studies with conditional knockout mice indicate that DLK signaling activation in injured MNs triggers the induction of phagocytic microglia and synapse loss. Aspects of the DLK-regulated response include expression of C1q first from the axotomized MN and then later in surrounding microglia, which subsequently phagocytose presynaptic components of upstream synapses. Pharmacological ablation of microglia inhibits the loss of cholinergic C boutons from axotomized MNs. Together, the observations implicate a neuronal mechanism, governed by the DLK, in the induction of inflammation and the removal of synapses.

Keywords: CP: Neuroscience; axon damage; axonal regeneration; c1q; microglia; motoneuron; peripheral nerve; phagocytosis; plasticity; stress response; synapse stripping.


Conflict of interest statement

Declaration of interests The authors declare no competing interests.

Figures

Figure 1.
Figure 1.. Neuronal DLK influences axotomy-induced synapse loss
(A) Synaptophysin (green) surrounding motoneurons (MNs) labeled by Rosa26-tdTomato in ChAT-Cre; Rpl22HA/HA;Ai14/Ai14 mice, which are either Ctl (Dlk+/+) or Dlk-ΔMN (Dlk KO, Dlkfx/fx). MNs in the L3–L6 lumbar segments of the ventral spinal cord were examined 7 days post sciatic nerve crush (SNC). Axotomized MNs on the side IL to the injury site (D7) are identified by their expression of ATF3 (gray), while uninjured (Uninj) MNs are observed on the CL side of the same longitudinal tissue section. Scale bar, 50 μm. (B) The presynaptic active zone component Bassoon (green), surrounding MNs (labeled by NeuN) in the L3–L6 lumbar segments of the ventral spinal cord 7 days post SNC (D7). Genotypes are Rpl22HA/HA; Dlk+/+; ChAT-Cre for Ctls and Rpl22HA/HA; Dlkfx/fx; ChAT-Cre for Dlk-ΔMN. Injured MNs in the injured side of spinal cord sections are identified based on ATF3 staining (gray), Scale bar, 50 μm. (C) Quantification of synaptophysin intensity (shown in A) surrounding the MN cell body surface. The entire pool of MNs in L3–L6 lumbar segments were imaged from four or five longitudinal sections from n = 3 mice per genotype. Small dots indicate the mean synaptophysin intensity measured for each MN (sum green pixel intensity/area μm2 of tdTomato), while large dots indicate the mean of these measurements per mouse. Paired t test was done between Ctl injured and Ctl uninjured samples. ***p = 0.0002. The same test was done for Dlk-ΔMN injured and uninjured conditions. (D) Quantification of Bassoon density. The intensity of Bassoon was measured within a 20-μm distance from the surface of the neurons for the entire MN pool in L3–L6 lumbar sections. Small dots indicate the measurements for individual neurons, while large dots indicate the mean of these measurements per mouse. n = 3 per genotype. Paired t test was done between Ctl injured and Ctl uninjured samples. *p = 0.01. The same test was done for Dlk-ΔMN injured and uninjured conditions. (E) VGlut1 (green) presynaptic afferents on MN cell bodies (tdTomato) in uninjured and 7 days post SNC. Genotypes are Ai14/Ai14; Rpl22HA/HA; Dlk+/+; ChAT-Cre for Ctls or Ai14/Ai14; Rpl22HA/HA; Dlkfx/fx; ChAT-Cre for Dlk-ΔMN. Scale bar, 20 μm. (F) Immunohistochemistry of ventral spinal cord 7 days post SNC (D7) for VAChT (green), a component of C boutons along with ATF3 (gray), and tdTomato (red). Genotypes are Ai14/Ai14; Rpl22HA/HA; Dlk+/+; ChAT-Cre for Ctls and Ai14/Ai14; Rpl22HA/HA; Dlkfx/fx; ChAT-Cre for Dlk-ΔMN. Scale bar, 20 μm. (G) Quantification of mean VGlut1 synaptic density on MN cell bodies. From 20-μm confocal stacks of MN cross sections, the number of VGlut1 boutons counted on each MN cell body was normalized to the cell body perimeter and reported as per 100 μm. The mean synaptic density for visible MNs in segments L3–L6 (totaling 100–150 MNs per animal) is plotted for each animal. A one-way ANOVA with the Tukey test for multiple comparisons was performed. *p < 0.05. (H) Quantification of mean VAChT bouton density on MN cell bodies. The number of VAChT boutons normalized to perimeter was measured for all MNs in L3–L6 within the CL (uninjured) and IL (injured) sides of three sagittal sections per animal. The mean is shown for each animal, n = 3 animals per condition. A one-way ANOVA with the Tukey test for multiple comparisons was performed. *p < 0.05, and ****p < 0.0001.
Figure 2.
Figure 2.. Neuronal DLK influences microglial responses to PNI
(A) Iba1 (Red) and CD68 (green) indicate microglia/monocytes and their phagocytic lysosomes increase in density surrounding injured motoneurons (labeled by NeuN in gray) 7 days post SNC. This response is attenuated in Dlk-ΔMN animals. Genotypes are Rpl22HA/HA; Dlk+/+; ChAT-Cre for Ctls and Rpl22HA/HA; Dlkfx/fx; ChAT-Cre for Dlk-ΔMN. Scale bar, 200 μm. (B) The percentage of the field of view (within 780 × 780 μm2 images of injured/uninjured MNs) that was Iba1+, indicating the presence of microglia. Images were collected from four or five longitudinal slices that covered the entire MN pool in L4–L6. (C) CD68+ puncta, indicating the presence of microglial lysosomes, were counted in both injured and uninjured sides of the spinal cords (in the same images described for B) and were graphed based on counts of CD68 puncta per 200 μm2. (D) Close-up views of Iba1+ cells interacting with axotomized motoneurons. Scale bar, 20 μm. (E and F) Extent of the motoneuron surface contacted by microglia at D7. From merged images of individual MNs, a line tool was used to measure the fraction of MN perimeter that is in physical contact with microglia. (F) The mean length of individual lines, which indicate the length of MN surface contacted by a single microglial process. Statistical comparisons were evaluated for mean values per animal (n = 3 per genotype) using one-way ANOVA with the Tukey test for multiple comparisons. *p < 0.05, **p < 0.005, ***p < 0.005, and ****p < 0.0001.
Figure 3.
Figure 3.. RiboTag profiling of DLK-regulated responses in injured MNs
(A) Unilateral SNC was performed at mid-thigh level. The injured and uninjured side of the lumbar spinal cord was collected in the same mice 3 days post SNC. We also collected spinal cords from naive, completely uninjured mice. Genotypes are Rpl22HA/HA; Dlk+/+; ChAT-Cre for Ctls and Rpl22HA/HA; Dlkfx/fx; ChAT-Cre for Dlk-ΔMN. (B) Schematic of the RiboTag approach. Expression of HA-tag Rpl22 in ChAT+ MNs made it possible to collect ribosome-associated mRNAs from the ventral horn of the spinal cord in both Ctl and Dlk KO MNs. (C) Principal-component analysis (PCA) plot shows grouping among replicates of each condition. The most variability is seen between injured and uninjured and then Ctl injured (copper circles) and Dlk-ΔMN injured (teal circles). (D) Heatmap of the first 30 most variable genes post SNC is shown. Most of the regeneration-associated genes (RAGs) are still upregulated in Dlk-ΔMN, although upregulation of some is diminished strongly (for example, Coch, Npy, and Gal). (E) Venn diagram of differentially expressed genes (DEGs). From 2,086 DEGs, a distinct subset (310) of the SNC-induced DEGs showed strong dependence on DLK (based on 1.5-fold change, an adjusted p value of less than 0.05). (F) Volcano plot comparing DEGs from injured MNs of Dlk-ΔMN vs. Ctl (injured) mice. For this plot, significant labeled DEGs are based on a fold change of 1, an adjusted p value of less than 0.05. (G) Bubble plot of Gene Ontology (GO) analysis in three categories: Biological Processes (BP), Cellular Component (CC), and Molecular Function (MF). The Z score suggests whether the genes in each significant GO term are likely to deplete (negative value) or increase (positive value). To calculate the Z score, the number of upregulated genes in each GO term is subtracted from the downregulated genes and divided by the square root of the total count of genes in that GO term..
Figure 4.
Figure 4.. DLK function in injured motor neurons triggers C1q expression
(A and B) Heatmaps of selected genes from the ribosome-associated transcripts in MNs associated with GO terms (innate immune response and immune response process). Cytokines such as CCL2 and 7 are not regulated by DLK. Members of the complement cascade C1qa, C1qb, C1qc, and Masp1 show DLK-dependent induction in injured MNs. *Levels of C3 do not show statistically significant changes; read counts <100. Genotypes are Rpl22HA/HA; Dlk+/+; ChAT-Cre for Ctls or Rpl22HA/HA; Dlkfx/fx; ChAT-Cre for Dlk-ΔMN. (C) In situ hybridization of C1qb (gray), Chat (green), and Atf3 (red) 3 days post SNC. C1q is strongly expressed by non-neuronal cells that surround injured MNs, but this response is reduced in Dlk-ΔMN animals. Genotypes are Rpl22HA/HA; Dlkfx/fx; (Cre negative) for Ctls or Rpl22HA/HA; Dlkfx/fx; ChAT-Cre for Dlk-ΔMN. Scale bar, 200 μm. (D) Close-up of in situ hybridization of C1qb (gray), and Atf3 (red) immunostained for Iba1 (green) and DAPI. Iba1 cells that express C1qb make extensive contacts with axotomized MNs in Ctl but not in Dlk-ΔMN animals. (E) Quantification of the number of Iba1+/C1q+ microglia associated with axotomized MNs (shown in D) in Ctl and Dlk-ΔMN animals. (F) In situ hybridization of C1qb (gray) and Atf3 (red), 1 day post SNC, shows MN expression of C1qb in Ctl and not Dlk-ΔMN animals. Genotypes are Rpl22HA/HA; Dlkfx/fx; Cre negative for Ctls or Rpl22HA/HA; Dlkfx/fx; ChAT-Cre for Dlk-ΔMN. (G) Quantification of (F); percentage C1qb-positive axotomized MNs is calculated by counting the number of neurons that have C1qb puncta in them and dividing them by the total number of axotomized MNs.
Figure 5.
Figure 5.. Neuronal DLK promotes C1q deposition and internalization of presynaptic components by Iba1+ cells
(A) Immunostaining of C1q 3 days post SNC. Dotted boxes in the merged image are enlarged in the far right panel. Ctl axotomized MNs are heavily coated by C1q-positive puncta. However, in Dlk-ΔMN mice, C1q localization is largely restricted to CD68+ cells (indicated with yellow arrows). Genotypes are Rpl22HA/HA; Dlkfx/fx; (Cre negative) for Ctls or Rpl22HA/HA; Dlkfx/fx; ChAT-Cre for Dlk-ΔMN. (B) Quantification of mean C1q intensity surrounding MNs. A one-way ANOVA with the Tukey test for multiple comparisons was performed. *p < 0.05 (p = 0.0238). (C) Representative images of axotomized MNs in Ctl, Dlk-ΔMN, and C3 KO 7 days post SNC. Insets show enlargements of CD68+ puncta that either contain or do not contain Bassoon. Scale bar, 20 μm. (D) Quantification of microglial density at D7 post SNC. (E) Extent of the motoneuron surface contacted by microglia at D7. From merged images of individual MNs, a line tool was used to measure length of contact interfaces between microglia and MNs (similar to measurements in Figure 2F). Statistical comparisons were evaluated for mean values per animal (n = 3 per genotype) using one-way ANOVA with the Tukey test for multiple comparisons. *p < 0.05, **p < 0.005, ***p < 0.005, and ****p < 0.0001. (F) 3D rendering of a Ctl neuron (Gray-NeuN) at D7 post SNC, which is surrounded by multiple Iba1+ cells (blue) and presynaptic Bassoon puncta (green). The arrow points to an example of an object that is positive for Bassoon that colocalizes within a CD68+ monocyte lysosome. Scale bar, 20 μm. (G) Quantification of the density of engulfed Bassoon puncta, which are colocalized with CD68 within Iba1+ cells. This analysis was done for the entire pool of MNs in L3–L6 lumbar segments imaged from three or four longitudinal sections, n = 3 mice per genotype. A one-way ANOVA with the Tukey test for multiple comparisons was performed. ****p < 0.0001. (H) The percentage change in engulfed Bassoon at D7 post SNC was measured per animal, comparing injured (IL) to uninjured (CL) regions in the same longitudinal sections described for (G).

References

    1. Alvarez FJ, Rotterman TM, Akhter ET, Lane AR, English AW, and Cope TC (2020). Synaptic Plasticity on Motoneurons After Axotomy: A Necessary Change in Paradigm. Front. Mol. Neurosci 13, 68. 10.3389/fnmol.2020.00068. - DOI - PMC - PubMed
    1. Blinzinger K, and Kreutzberg G (1968). Displacement of synaptic terminals from regenerating motoneurons by microglial cells. Z. Zellforsch. Mikrosk. Anat 35, 145–157. 10.1007/bf00325030. - DOI - PubMed
    1. Kettenmann H, Kirchhoff F, and Verkhratsky A (2013). Microglia: new roles for the synaptic stripper. Neuron 77, 10–18. 10.1016/j.neuron.2012.12.023. - DOI - PubMed
    1. Rotterman TM, Akhter ET, Lane AR, MacPherson KP, García VV, Tansey MG, and Alvarez FJ (2019). Spinal Motor Circuit Synaptic Plasticity after Peripheral Nerve Injury Depends on Microglia Activation and a CCR2 Mechanism. J. Neurosci 39, 3412–3433. 10.1523/JNEUROSCI.2945-17.2019. - DOI - PMC - PubMed
    1. Svensson M, and Aldskogius H (1993). Synaptic density of axotomized hypoglossal motorneurons following pharmacological blockade of the microglial cell proliferation. Exp. Neurol 120, 123–131. 10.1006/exnr.1993.1046. - DOI - PubMed

Publication types