. 2024 Feb 16;103(7):e37171.
doi: 10.1097/MD.0000000000037171.

Single-nucleus RNA sequencing reveals that macrophages and smooth muscle cells promote carotid atherosclerosis progression through mitochondrial autophagy

Affiliations

Single-nucleus RNA sequencing reveals that macrophages and smooth muscle cells promote carotid atherosclerosis progression through mitochondrial autophagy

Yamin Song et al. Medicine (Baltimore). .

Abstract

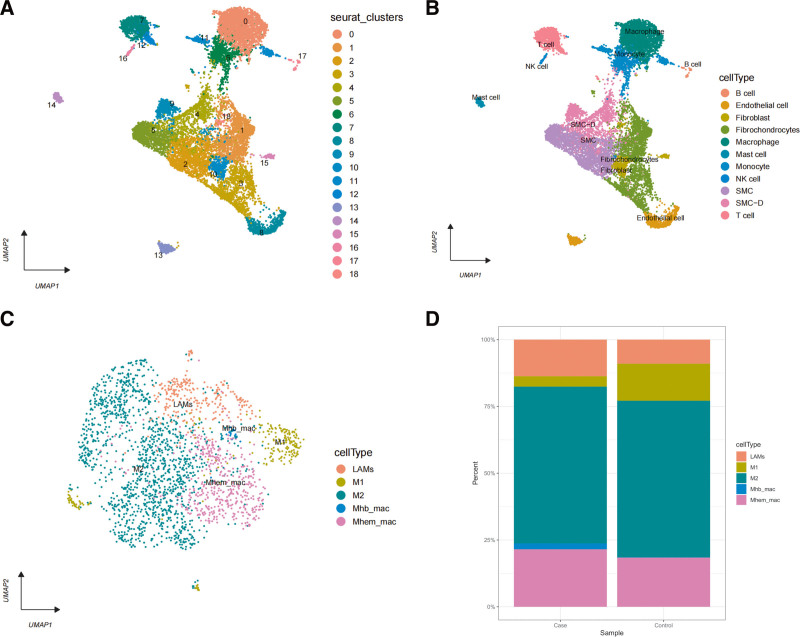
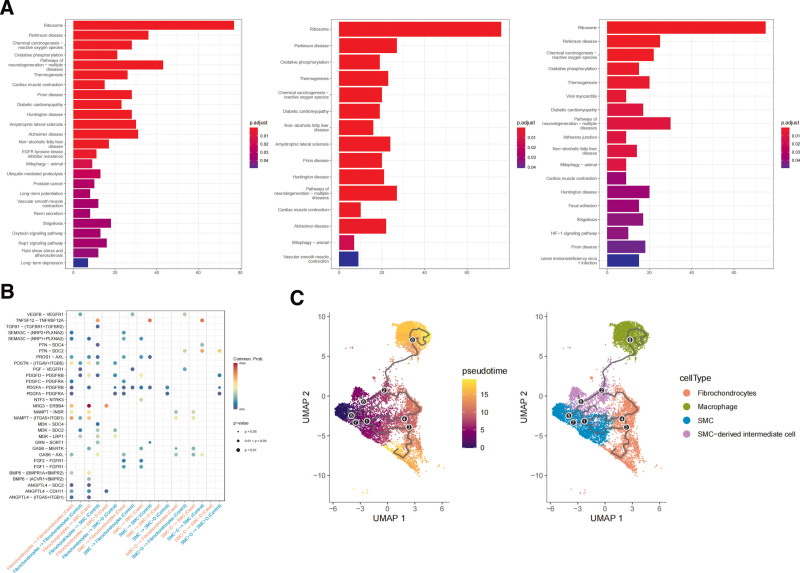
Carotid atherosclerotic plaques are the manifestation of atherosclerosis in the carotid arteries and can significantly increase the incidence of cerebrovascular disease. Macrophages and smooth muscle cells are crucial for their development. To reveal the mechanism of carotid atherosclerotic plaque formation, we performed single-nucleus RNA sequencing of the carotid plaque tissue and identified 11 cell types, and the macrophages were divided into 5 different macrophage subpopulations. The macrophages and smooth muscle cells in the patients with symptomatic carotid atherosclerotic plaques caused intraplaque cell death via the mitochondrial autophagic pathway, resulting in plaque instability and rupture, which in turn led to clinical cardiovascular and cerebrovascular events. The findings provide new insights into carotid atherosclerosis formation, and this may provide new directions for the prevention and treatment of carotid atherosclerosis.


Conflict of interest statement

The authors have no conflicts of interest to disclose.

Figures

Figure 1.
Figure 1.
Cell type identification of plaques in carotid atherosclerosis. The X-axis represents the UMAP first component, and the Y-axis represents the UMAP second component. A: clustering of cells within plaques; Arabic numerals indicated cluster numbers and different cell types were indicated by different color hours. B: annotation of different cell clusters. Colors represent the different cell types. C: nomination of different macrophage subtypes in plaques. Colors represent the different cell types. D: percentage of macrophage subtypes. Scale stacking plots of cell numbers for each cell type in each treatment fraction in the macrophage subtype. X-axis is the treatment group name and Y-axis is the percentage of cell type.
Figure 2.
Figure 2.
KEGG enrichment analysis of differential genes in macrophage subtypes. KEGG enrichment analysis of differential genes in M1, M2, LAMs, Mhem, and Mhb macrophages. The X-axis represents the number of enriched genes, and the Y-axis represents the name of the enriched KEGG Pathway. Colors correspond to the value of P-value, with red indicates more significant enrichment.
Figure 3.
Figure 3.
Cellular communication analysis of macrophage subpopulations. The X-axis represents the communication relationship between cells, and the Y-axis represents the ligand-receptor pairs. The color of the circle corresponds to the probability of the ligand-receptor pair, and the darker the color, the higher the probability; the size of the circle represents the significance level, and the larger the significance level, the higher the significance level.
Figure 4.
Figure 4.
Functional analysis of smooth muscle cells. A: KEGG enrichment analysis of differential genes in smooth muscle cells. The X-axis represents the number of enriched genes, and the Y-axis represents the name of the enriched KEGG Pathway. B: The cellular communication analysis of smooth muscle cells. The X-axis represents the communication relationship between cell types, the Y-axis represents the ligand-receptor pairs, the color of the circle represents the probability of the existence of the corresponding ligand-receptor pairs, the darker the color represents the higher the probability, the size of the circle represents the significance level, the larger the significance level represents the higher the significance level; C: Proposed time-series cell trajectory diagram. The black line in the left panel indicates the putative cell developmental trajectory. The color ranges from purple to yellow; the closer the color is too yellow, the later the cell development is. The black lines in the right panel represent the putative cell developmental trajectory, the colors represent different clusters, and the numbers represent the branching nodes of cell development.

Similar articles

References

    1. Bos D, Arshi B, van den Bouwhuijsen QJA, et al. . Atherosclerotic carotid plaque composition and incident stroke and coronary events. J Am Coll Cardiol. 2021;77:1426–35. - PubMed
    1. Finn AV, Nakano M, Narula J, et al. . Concept of vulnerable/unstable plaque. Arterioscler Thromb Vasc Biol. 2010;30:1282–92. - PubMed
    1. Moroni F, Ammirati E, Norata GD, et al. . The role of monocytes and macrophages in human atherosclerosis, plaque neoangiogenesis, and atherothrombosis. Mediators Inflamm. 2019;2019:7434376. - PMC - PubMed
    1. Wei Y, Zhu M, Corbalán-Campos J, et al. . Regulation of Csf1r and Bcl6 in macrophages mediates the stage-specific effects of microRNA-155 on atherosclerosis. Arterioscler Thromb Vasc Biol. 2015;35:796–803. - PubMed
    1. Kalinski AL, Yoon C, Huffman LD, et al. . Analysis of the immune response to sciatic nerve injury identifies efferocytosis as a key mechanism of nerve debridement. eLife. 2020;9 :e60223. - PMC - PubMed