Review
. 2024 Feb 28;124(4):1950-1991.
doi: 10.1021/acs.chemrev.3c00661. Epub 2024 Feb 16.

Chiral Induced Spin Selectivity

Affiliations
Review

Chiral Induced Spin Selectivity

Brian P Bloom et al. Chem Rev. .

Abstract

Since the initial landmark study on the chiral induced spin selectivity (CISS) effect in 1999, considerable experimental and theoretical efforts have been made to understand the physical underpinnings and mechanistic features of this interesting phenomenon. As first formulated, the CISS effect refers to the innate ability of chiral materials to act as spin filters for electron transport; however, more recent experiments demonstrate that displacement currents arising from charge polarization of chiral molecules lead to spin polarization without the need for net charge flow. With its identification of a fundamental connection between chiral symmetry and electron spin in molecules and materials, CISS promises profound and ubiquitous implications for existing technologies and new approaches to answering age old questions, such as the homochiral nature of life. This review begins with a discussion of the different methods for measuring CISS and then provides a comprehensive overview of molecules and materials known to exhibit CISS-based phenomena before proceeding to identify structure-property relations and to delineate the leading theoretical models for the CISS effect. Next, it identifies some implications of CISS in physics, chemistry, and biology. The discussion ends with a critical assessment of the CISS field and some comments on its future outlook.


Conflict of interest statement

The authors declare no competing financial interest.

Figures

Figure 1
Figure 1
Number of publications, and the citations of those publications, using the phrase “chiral induced spin selectivity” or “chirality induced spin selectivity” from 2012 to 2022. The bars show the number of publications each year, and the solid curve shows the cumulative growth in citations. Data are from Clarivate Web of Science.
Figure 2
Figure 2
Representative schematic diagram (a) for the determination of CISS using Mott polarimetry measurements. First, photoelectrons in a substrate are excited (i) and then transmit through the chiral spin filter (ii), resulting in a net spin polarization. The photoelectrons are scattered on an Au foil target according to their spin (iii) and quantified at two independent detectors (iv). The schematic is reproduced with permission from ref (39). Copyright 2022 American Chemical Society. Panel b shows the photoelectron spin polarization from a bare Au(111) substrate excited with clockwise (green), linear (blue), and counterclockwise (red) polarized light. Panels c–e show the spin polarization for photoelectrons from an Au(111) surface that is coated with double-stranded DNA for clockwise, linear, and counterclockwise excitation, respectively. The data are adapted from ref (12) with permission. Copyright 2011 Science.
Figure 3
Figure 3
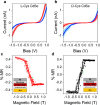
Panel a shows the experimental geometry used for a measurement of the current–voltage curves. Panel b shows current–voltage curves for peptide 1N with the linker on the N-terminus of the peptide. The blue curve corresponds to a South magnetized tip in which the electron transport is aligned parallel with its spin and the red curve corresponds to a North magnetized tip in which the electron transport is aligned antiparallel to its spin. Panel c shows current voltage curves for peptide 1C; in this case the South magnetized tip shows a lower current and the North magnetized tip shows the higher current. Panel d plots the percent spin polarization, as calculated from the data in panels b and c for peptide 1N (green, 44%) and peptide 1C (orange, −32%). The figure is adapted from ref (43) with permission. Copyright 2022 John Wiley and Sons.
Figure 4
Figure 4
Panels a and b show a representative schematic diagram of a Hall device passivated with chiral oligopeptides. Panel c shows that upon charge polarization of the oligopeptides, a transient Hall voltage is generated. Panel d shows the dependence of the Hall voltage on the magnitude and sign of the gate voltage and the handedness of the oligopeptides. The figure is adapted from ref (20) with permission.
Figure 5
Figure 5
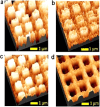
Topography and magnetic force microscopy phase images are shown for a molecular-induced magnetization orientation. The top row shows AFM topography images of SAMs of l-polylalanine (a) and d-polyalanine (b) adsorbed on Co thin ferromagnetic layers with a 5 nm Au overlayer, and the bottom row shows their corresponding magnetic AFM magnetic phase images (l-polylalanine (c) and d-polylalanine (d)). Adsorption of oligopeptides induce a magnetization, and the direction of the magnetization is controlled by the enantiomeric form of the molecules. The figure is adapted from ref (57) with permission (http://creativecommons.org/licenses/by/4.0/).
Figure 6
Figure 6
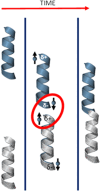
The image shows the effect of spin-dependent charge reorganization interactions between two chiral molecules. From left to right: The two chiral reactant molecules are represented by helices and are noninteracting at a very large distance. As the chiral molecules approach each other dispersion forces generate induced dipoles on each molecule, which in turn are accompanied by a spin polarization. The two chiral molecules react to give a product with an energy that depends on whether the spin polarizations on the molecules are aligned antiparallel or parallel.
Figure 7
Figure 7
Panel a shows a schematic diagram for the Kelvin probe measurement. Panels b–d show changes in the measured contact potential difference with North (red) and South (blue) magnetizations for d-oligopeptide SAMs, achiral SAMs, and l-oligopeptide SAMs, respectively on ferromagnetic electrodes. The figure is adapted from ref (19) with permission. Copyright 2020 American Chemical Society.
Figure 8
Figure 8
Panel a shows an experimental schematic for magneto-optic Kerr effect measurements on chiral perovskite thin films. Panel b shows magneto-optic Kerr rotation measurements on S-hybrid organic–inorganic perovskites, under positive (top) and negative (bottom) out-of-plane external magnetic fields. The red line is an adjacent average smoothing of the data. Panel c shows the change in photoinduced Kerr response as a function of the external magnetic field strength. The red line is a linear fit to the data. The figure is adapted from ref (97) with permission. Copyright 2020 American Chemical Society.
Figure 9
Figure 9
Spin transport measurements on CdSe quantum dots passivated with l-cysteine (a,c) and d-cysteine (b,d) ligands. Panels a and b show mc-AFM measurements in which the red curve corresponds to the electron spin antiparallel to its momentum and the blue curve corresponds to the electron spin parallel to its momentum. The shaded regions represent 95% confidence intervals. Panels c and d show corresponding magnetoresistance (MR) measurements on spin-valve devices. The data are replotted from ref (163) with permission. Copyright 2016 American Chemical Society.
Figure 10
Figure 10
Panel a shows a schematic which illustrates the atomic molecular deposition super cycle repeated a total number of “L” times until a desired thickness is achieved. The deposition is composed of two subcycles; atomic layer deposition (blue) of alumina using trimethylaluminum and water repeated “n” times followed by dosing of the film (red) with d- or l-alaninol repeated “m” times. Panel b shows jV characteristics of a device with a film fabricated using l-alaninol precursors for two different magnetic field directions; the inset illustrates the measurement circuit design. Panel c plots the resulting spin polarization as a function of bias potential. This figure is adapted from ref (195) with permission. Copyright 2022 American Chemical Society.
Figure 11
Figure 11
The plot shows the dependence of the spin polarization on the thickness for the polymer synthesized on a ferromagnetic electrode with application of an oriented external magnetic field. The inset shows the average current versus voltage (jV) curves recorded for 60 ± 3 nm thickness polymers with the magnet North pole pointing up (red) and down (blue). The figure is adapted from ref (150) with permission. Copyright 2022 American Association for the Advancement of Science.
Figure 12
Figure 12
SEM image of a single magnetic nanoparticle spintronic device. Because of its CISS properties, the active memory device, which is about 30 nm in size, presents a memristor-like nonlinear logic operation at low voltages under ambient conditions. Inset: The active memory is the 30 nm magnetic quantum dot covered with chiral molecules that is located between the two gold electrodees. Unpublished work.
Figure 13
Figure 13
Enantiospecific adsorption of polyalanine (PAL). (a) The micrographs show the adsorption of the PAL oligopeptide [shown in inset of panel v] on ferromagnetic substrates magnetized with the magnetic dipole pointing Up (H+) or Down (H−) relative to the substrate surface. To visualize the adsorption, SiO2 nanoparticles were attached to the adsorbed oligopeptides. Panels i and ii show L-PAL and panels iii and iv show D-PAL adsorbed for 2 s on a substrate magnetized Up or Down. Panel v summarizes the nanoparticle adsorption densities shown in panels i–iv, compared with the adsorption density on Au with the same applied external magnetic field (red bars). Double-headed arrows represent error bars, the standard deviation among 10 measurements conducted on each of the 10 samples, hence a total of 100 measurements. b Panel i shows the CD spectra of a racemic solution of PAL, obtained following exposure to a ferromagnetic substrate with magnetization pointing Down (red) or Up (blue). Following the adsorption onto the ferromagnetic surface, it is evident that the solution becomes enantioenriched. The line width reflects the uncertainty of the results. Panel ii shows the CD spectra of the pure enantiomers for comparison. The figure is adapted from ref (21) with permission. Copyright 2018 American Association for the Advancement of Science.
Figure 14
Figure 14
Studies into the effect of solution pH on the asymmetry in effective adsorption rate constant of cysteine onto a magnetized ferromagnetic substrate with a North and South applied magnetic field. Panel A shows the results of l-cysteine (green) and d-cysteine (purple) adsorbates; panel B shows the results for n-acetyl l-cysteine methyl ester. The figure is adapted from ref (23) with permission. Copyright 2021 American Chemical Society.
Figure 15
Figure 15
Proposed mechanistic scheme to explain the role of CISS during water splitting. Panel a shows a model lattice where the color of the ball indicates the spin of a radical intermediate adsorbate on the catalyst (shown here as a hydroxyl); blue indicates a spin down site whereas red indicates a spin up site. For chiral catalysts (left) the electrons at adjacent sites are spin aligned, because of the spin polarization, and thus formation of triplet oxygen is favored. For achiral catalysts (right) spin disorder exists and often necessitates either a change in spin state or a singlet-mediated pathway for the reaction to proceed. The figure is adapted from ref (299). Copyright 2020 American Chemical Society. Panel b shows the influence of the solution pH conditions on this process. For achiral catalysts a larger potential (+E) is needed to overcome the spin disorder limitations, compared to chiral catalysts, and additional singlet reaction pathways become more prominent. Panel c shows a theoretical treatment to determine the free energy of oxygen evolution at each reaction step on a CoFe2O4(111) surface toward triplet oxygen with (red) and without (blue) spin alignment on the catalyst surface. This figure is adapted from ref (421) with permission (http://creativecommons.org/licenses/by/4.0/).
Figure 16
Figure 16
Linear sweep voltammograms for oxygen reduction in O2-saturated 0.1 M KOH solutions using electrodes coated with achiral (a) and chiral (b) SAMs. The possible spin-mediated O2–substrate interactions available in the case of a chiral catalyst (c) and an achiral catalyst (d). The figure is adapted from ref (428) with permission.
Figure 17
Figure 17
Electrochemical quartz crystal microbalance measurements of the electropolymerization of R,R-EDOT (a) and S,S-EDOT (b) onto a ferromagnetic electrode with a North (red) or South (blue) applied magnetic field. Panel c shows an experimental scheme illustrating differences in the spin-exchange interactions between the chiral monomers and the magnetization state of the electrode giving rise to differences in the nucleation step of the reaction. The figure is adapted from ref (434) with permission. Copyright 2020 American Chemical Society.

Similar articles

Cited by

References

    1. MacDermott A.J.; Barron L.D.; Brack A.; Buhse T.; Drake A.F.; Emery R.; Gottarelli G.; Greenberg J.M.; Haberle R.; Hegstrom R.A.; Hobbs K.; Kondepudi D.K.; McKay C.; Moorbath S.; Raulin F.; Sandford M.; Schwartzman D.W.; Thiemann W.H.-P.; Tranter G.E.; Zarnecki J.C. Homochirality as the Signature of Life: the SETH Cigar. Planet. Space Sci. 1996, 44, 1441–1446. 10.1016/S0032-0633(96)00057-8. - DOI - PubMed
    1. Meierhenrich U.Amino Acids and the Asymmetry of Life: Caught in the Act of Formation; Springer. 2008.
    1. Xiao W.; Ernst K.-H.; Palotas K.; Zhang Y.; Bruyer E.; Peng L.; Greber T.; Hofer W. A.; Scott L. T.; Fasel R. Microscopic Origin of Chiral Shape Induction in Achiral Crystals. Nat. Chem. 2016, 8, 326–330. 10.1038/nchem.2449. - DOI - PubMed
    1. Lee T. D.; Yang C. N. Question of Parity Conservation in Weak Interactions. Phys. Rev. 1956, 104, 254–258. 10.1103/PhysRev.104.254. - DOI
    1. Ray K.; Ananthavel S. P.; Waldeck D. H.; Naaman R. Asymmetric Scattering of Polarized Electrons by Organized Organic Films of Chiral Molecules. Science 1999, 283, 814–6. 10.1126/science.283.5403.814. - DOI - PubMed