. 2024 Mar 13;15(3):e0015924.
doi: 10.1128/mbio.00159-24. Epub 2024 Feb 16.

Critical role of growth medium for detecting drug interactions in Gram-negative bacteria that model in vivo responses

Affiliations

Critical role of growth medium for detecting drug interactions in Gram-negative bacteria that model in vivo responses

Kathleen P Davis et al. mBio. .

Abstract

The rise in infections caused by multidrug-resistant (MDR) bacteria has necessitated a variety of clinical approaches, including the use of antibiotic combinations. Here, we tested the hypothesis that drug-drug interactions vary in different media, and determined which in vitro models best predict drug interactions in the lungs. We systematically studied pair-wise antibiotic interactions in three different media, CAMHB, (a rich lab medium standard for antibiotic susceptibility testing), a urine mimetic medium (UMM), and a minimal medium of M9 salts supplemented with glucose and iron (M9Glu) with three Gram-negative ESKAPE pathogens, Acinetobacter baumannii (Ab), Klebsiella pneumoniae (Kp), and Pseudomonas aeruginosa (Pa). There were pronounced differences in responses to antibiotic combinations between the three bacterial species grown in the same medium. However, within species, PaO1 responded to drug combinations similarly when grown in all three different media, whereas Ab17978 and other Ab clinical isolates responded similarly when grown in CAMHB and M9Glu medium. By contrast, drug interactions in Kp43816, and other Kp clinical isolates poorly correlated across different media. To assess whether any of these media were predictive of antibiotic interactions against Kp in the lungs of mice, we tested three antibiotic combination pairs. In vitro measurements in M9Glu, but not rich medium or UMM, predicted in vivo outcomes. This work demonstrates that antibiotic interactions are highly variable across three Gram-negative pathogens and highlights the importance of growth medium by showing a superior correlation between in vitro interactions in a minimal growth medium and in vivo outcomes.

Importance: Drug-resistant bacterial infections are a growing concern and have only continued to increase during the SARS-CoV-2 pandemic. Though not routinely used for Gram-negative bacteria, drug combinations are sometimes used for serious infections and may become more widely used as the prevalence of extremely drug-resistant organisms increases. To date, reliable methods are not available for identifying beneficial drug combinations for a particular infection. Our study shows variability across strains in how drug interactions are impacted by growth conditions. It also demonstrates that testing drug combinations in tissue-relevant growth conditions for some strains better models what happens during infection and may better inform combination therapy selection.

Keywords: Acinetobacter; Klebsiella; Pseudomonas aeruginosa; antibiotic resistance; combination therapy.


Conflict of interest statement

The authors declare no conflict of interest.

Figures

Fig 1
Fig 1
Variation in drug interaction across species and media. (A) Study design involved testing 28 pairs of antibiotics against A. baumannii ATCC17978 (Ab) and P. aeruginosa PaO1 (Pa), and 45 pairs against K. pneumoniae ATCC 43816 (Kp). Testing was done with all strains grown in three different growth conditions: cation-adjusted Mueller-Hinton Broth (CAMHB); M9 minimal medium + 0.5% glucose supplemented with 0.6 µM iron (II) sulfate, and with 10 mM sodium acetate for Ab and Pa; and urine mimetic medium (UMM) (41) supplemented with 0.01% glucose and 0.6 µM iron (II) sulfate for Kp. (B) Clustergram of the log2FIC50 values of the 28 drug pairs tested across all three species and media, with each row representing a drug combination (indicated by black squares under the drug abbreviations in the table on the right) and each column representing a species tested in a particular medium. Each drug-pair number is maintained throughout the manuscript for ease of comparison. Each value represents an average of at least three replicates. Hierarchical clustering was performed using average linkage between clusters and Pearson correlation distance metric between columns. Combinations tested against Pa in CAMHB, M9Glu, and UMM clustered together (Cluster I, dotted lines on tree), and combinations tested against Kp in CAMHB and UMM clustered together (Cluster II, solid lines on tree). However, combinations tested against Kp in M9Glu clustered together with combinations tested against Ab in M9Glu and CAMHB (Cluster III, dashed lines on tree), while combinations tested against Ab in UMM clustered separately (Cluster IV, dot-dash line pattern on tree). (C) Clustergram of the log2FIC50 values of all 45 drug pairs tested against Kp in all three media (columns). Hierarchical clustering, notation of drug pairs, and representation of log2FIC50 are the same as for (B). (D) The Pearson correlation coefficient (R) and P value were determined for each species-to-species comparison of mean log2FIC50 values in the three media conditions. (E) The Pearson correlation coefficient (R) and P value were determined for each medium-to-medium comparison of mean log2FIC50 values in the three species.
Fig 2
Fig 2
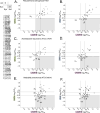
Nutrient-limited media (M9Glu, UMM) reveal more synergistic combinations than standard-rich media (CAMHB) for Klebsiella pneumoniae. (A–F) Scatterplots of log2FIC50 values for all 28 drug pairs tested against (A, B) Pa PaO1, (C, D) Ab ATCC17978 and (E, F) 45 drug pairs tested against Kp ATCC43816. X-values represent log2FIC50 in CAMHB, while y-values represent log2FIC50 value in nutrient-limited media, (A, C, E) M9Glu and (B, D, F) UMM. Lines parallel to the x-axis and y-axis indicate the boundaries of additivity (log2FIC50 from −0.19 to 0.26, see Materials and Methods). Combinations that fall in the upper-left and lower-right sections of each graph indicate discordant interactions between results in CAMHB and results in the nutrient-limited medium (marked with a (D) in the key on the left). Combinations that fall in the gray-shaded regions are synergistic in nutrient-limited media but additive or antagonistic in CAMHB; combinations for which this occurs in one or more species are bold-faced and underlined in the list of combinations on the left.
Fig 3
Fig 3
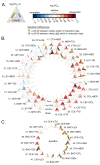
Different strains show different degrees of variation across media conditions. (A) Triangle diagram represents how the log2FIC50 data are depicted in (B) and (C) with UMM value on the top right, M9glu value on the top left, and CAMHB on the bottom. Log2FIC50 values are reported as in Fig. 1. (B, C) Yellow teardrops indicate significant differences (P ≤ 0.05) between media where combinations change interaction type (e.g., switch from synergy to antagonism between media); green teardrops indicate significance for combinations that do not change interaction type. Significance was based on a two-way ANOVA using Tukey’s multiple comparison post-test (α = 0.05), using the log2FIC50. (B) The innermost ring of triangles represents log2FIC50 data of combinations tested in Pa, the second ring from the middle represents combinations tested in Ab, and the outermost ring represents the combinations tested in Kp. (C) The log2FIC50 data for combinations only tested against Kp.
Fig 4
Fig 4
Some drugs were more frequently observed in combinations that show a significant difference in interaction between media. An asterisk indicates a drug that was only tested against Kp. (A) Yellow bars: the percentage of combinations involving each drug that showed a statistically significant log2FIC50 interaction type switch (e.g., synergistic to antagonistic) in different media conditions (yellow bars). Black bars: the percentage of combinations involving each drug that showed a statistically significant log2FIC50 interaction type switch to or from synergy. (B) The percentage of combinations involving each drug that switched from additivity or antagonism in CAMHB to synergy in nutrient-limited media (M9Glu or UMM).
Fig 5
Fig 5
Media effects observed for Ab17978 and Kp43816 are recapitulated by Ab and Kp clinical isolates. (A) log2FIC50 and log2Fold50 values for combinations tested against Ab clinical isolates (Ab5075, EGA355, and EGA368) and lab strain (Ab17978) grown in CAMHB (left) and M9Glu (right). The log2Fold50 values are indicated with an asterisk. (B) log2FIC50 values for combinations tested against Kp clinical isolates (BIDMC33B, BWH15, UCI38, and MGH47) and lab strain (Kp43816) grown in CAMHB (left) and M9Glu (right). For (A) and (B), not all combinations were tested against all strains, due to variation in isolate resistance profiles; combinations not tested are shown in black. All values are averages of at least three biological replicates. (C) Pearson correlation coefficients (r values) for comparing log2FIC50 values in CAMHB versus M9Glu (shown in (A)) for Ab17978 and Ab clinical isolates (left violin), and Pearson correlation coefficients (r values) for comparing log2FIC50 values in CAMHB versus M9Glu (shown in (B)) for Kp43816 and Kp clinical isolates (right violin).
Fig 6
Fig 6
Drug combinations identified as synergistic in M9Glu, but not CAMHB, significantly reduce lung bacterial burden during mouse lung infection by Klebsiella pneumoniae. (A–C) Swiss Webster wild-type mice (black circles) were infected via intranasal route with 10,000 CFUs of Kp43816 and infection was allowed to proceed for 14 h at which point mice were treated with either DMSO or indicated doses of drugs (in mg/kg) via intraperitoneal injection. Mice receiving meropenem were given a second dose at 18 h due to its short in vivo half-life (52). Lungs were harvested after 22 h post infection and plated for bacterial burden (CFU/g of lung). Blue lines indicate geometric means. Data for each drug combination group were compiled from n = 3 independent experiments with three to four mice in each group. Statistical analysis was done by two-way ANOVA with Bonferroni corrections.

References

    1. Antimicrobial Resistance Collaborators . 2022. Antimicrobial resistance C. global burden of bacterial antimicrobial resistance in 2019: A systematic analysis. Lancet 399:629–655. doi:10.1016/S0140-6736(21)02724-0 - DOI - PMC - PubMed
    1. Khurana S, Singh P, Sharad N, Kiro VV, Rastogi N, Lathwal A, Malhotra R, Trikha A, Mathur P. 2021. Profile of co-infections & secondary infections in COVID-19 patients at a dedicated COVID-19 facility of a tertiary care Indian hospital: implication on antimicrobial resistance. Indian J Med Microbiol 39:147–153. doi:10.1016/j.ijmmb.2020.10.014 - DOI - PMC - PubMed
    1. De Oliveira DMP, Forde BM, Kidd TJ, Harris PNA, Schembri MA, Beatson SA, Paterson DL, Walker MJ. 2020. Antimicrobial resistance in ESKAPE pathogens. Clin Microbiol Rev 33:e00181-19. doi:10.1128/CMR.00181-19 - DOI - PMC - PubMed
    1. Hernando-Amado S, Coque TM, Baquero F, Martínez JL. 2019. Defining and combating antibiotic resistance from one health and global health perspectives. Nat Microbiol 4:1432–1442. doi:10.1038/s41564-019-0503-9 - DOI - PubMed
    1. Agyeman AA, Bergen PJ, Rao GG, Nation RL, Landersdorfer CB. 2020. A systematic review and meta-analysis of treatment outcomes following antibiotic therapy among patients with carbapenem-resistant Klebsiella pneumoniae infections. Int J Antimicrob Agents 55:105833. doi:10.1016/j.ijantimicag.2019.10.014 - DOI - PubMed