Clinical Trial
. 2024 Feb 16;15(1):1430.
doi: 10.1038/s41467-024-45798-8.

Neoadjuvant cobimetinib and atezolizumab with or without vemurafenib for high-risk operable Stage III melanoma: the Phase II NeoACTIVATE trial

Affiliations
Clinical Trial

Neoadjuvant cobimetinib and atezolizumab with or without vemurafenib for high-risk operable Stage III melanoma: the Phase II NeoACTIVATE trial

Tina J Hieken et al. Nat Commun. .

Abstract

Both targeted therapies and immunotherapies provide benefit in resected Stage III melanoma. We hypothesized that the combination of targeted and immunotherapy given prior to therapeutic lymph node dissection (TLND) would be tolerable and drive robust pathologic responses. In NeoACTIVATE (NCT03554083), a Phase II trial, patients with clinically evident resectable Stage III melanoma received either 12 weeks of neoadjuvant vemurafenib, cobimetinib, and atezolizumab (BRAF-mutated, Cohort A, n = 15), or cobimetinib and atezolizumab (BRAF-wild-type, Cohort B, n = 15) followed by TLND and 24 weeks of adjuvant atezolizumab. Here, we report outcomes from the neoadjuvant portion of the trial. Based on intent to treat analysis, pathologic response (≤50% viable tumor) and major pathologic response (complete or near-complete, ≤10% viable tumor) were observed in 86.7% and 66.7% of BRAF-mutated and 53.3% and 33.3% of BRAF-wild-type patients, respectively (primary outcome); these exceeded pre-specified benchmarks of 50% and 30% for major pathologic response. Grade 3 and higher toxicities, primarily dermatologic, occurred in 63% during neoadjuvant treatment (secondary outcome). No surgical delays nor progression to regional unresectability occurred (secondary outcome). Peripheral blood CD8 + TCM cell expansion associated with favorable pathologic responses (exploratory outcome).


Conflict of interest statement

T.J.H.: Research support—Genentech, SkylineDX BV; R.R.M.: Research support—Bristol-Myers Squibb, GSK; L.A.K.: Advisory Board—Immunocore; R.S.D.: Research support—Bristol-Myers Squibb; S.N.M.: Research support—Bristol-Myers Squibb, Sorrento Therapeutics; Intellectual Property: Sorrento Therapeutics; A.D.: Honoraria—Intellisphere, Roche/Genentech; Advisory Board—TP Therapeutics, Guardant Health, AnHeart Therapeutics, ChromaCode; Clinical trial support—Syntrix Pharmaceuticals, Novartis, Merck, AnHeart Therapeutics, Sorrento Therapeutics, Guardant, Philogen, AstraZeneca; M.A.P.: Research funding—Intuitive Surgical; Honoraria—Kubtec Medical Imaging; D.L.P.: Advisory Board and Equity Interest—InSitu Biologics; Advisory Board—Medivis; M.S.B.: Research support—Alkermes, Bristol-Myers Squibb, Genentech, Merck, nFerence, Pharmacylclics, Regeneron, Sorrento Therapeutics, TILT Biotherapeutics, Transgene, Viewpoint Molecular Therapeutics; Consultant/Scientific Advisory Board—Sorrento Therapeutics, TILT Biotherapeutics, Viewpoint Molecular Therapeutics All other authors have no competing interests to declare.

Figures

Fig. 1
Fig. 1
CONSORT diagram for NeoACTIVATE (screening through operation).
Fig. 2
Fig. 2. Imaging Response to Neoadjuvant Treatment.
A Waterfall plot of radiographic responses to neoadjuvant treatment. The percent change in size of the largest lymph node from before to after neoadjuvant treatment is shown for all patients with measurable disease per RECIST 1.1 who completed adjuvant therapy on protocol and had post-neoadjuvant imaging assessment on protocol. B Comparison of Imaging and Pathologic Response.
Fig. 3
Fig. 3. Pathologic Response to Neoadjuvant Treatment.
The frequency and depth of pathologic response are shown in graphs and table for the entire intent-to-treat population and for each cohort.
Fig. 4
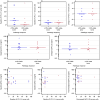
Fig. 4. PD-L1 IHC and sPD-L1 Analyses.
The percentage of tumor cells (A) and immune cells (B) with PD-L1 expression at baseline, and the change in percentage of immune cells with PD-L1 expression after neoadjuvant treatment (C) were quantitated. The plasma concentration of soluble PD-L1 at baseline (D) and the change in sPD-L1 concentration (E) were measured. Tissue PD-L1 staining on tumor (F) and immune cells (G, H) was compared at baseline (F, G) and after neoadjuvant therapy (H). Data are separated by treatment cohort in Supplementary Figs. 2 and 3. Blue circles are ≤10% viable tumor. Red triangles are >10% viable tumors. AE lines are medians.
Fig. 5
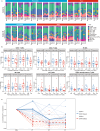
Fig. 5. Longitudinal analyses of peripheral blood immune cell populations.
Cellular subsets from peripheral blood samples were identified via CyTOF and quantitated at baseline, after Cycle 1, after completion of neoadjuvant treatment (Cycle 3), and after operation (Cycle 4). A Relative composition of immune cells at each timepoint in individual patients, faceted by treatment cohort and response status. B Frequencies of select lymphocyte subtypes as a percentage of total PBMCs, grouped by pathologic response status (favorable: pCR or near-pCR, ≤10% viable tumor cells; poor: pPR or pNR, >10% viable tumor cells). An asterisk (*) denotes p < 0.05 (linear regression t-test, two sided adjusting treatmentarms). Jitters on the plot represent subjects. The lower and upper whiskers represent the range of data points within 1.5 times the interquartile range below or above the first and third quartiles respectively, while the box itself illustrates the middle 50% of the data, bounded by the first and third quartiles, with a median line indicating the data’s median value. C Change from baseline intensity of PD-L1 expression on T cells in individual BRAFm and BRAFwt patients. Bold lines denote mean values for each cohort.

References

    1. Robert C, et al. Improved overall survival in melanoma with combined dabrafenib and trametinib. N. Engl. J. Med. 2015;372:30–39. doi: 10.1056/NEJMoa1412690. - DOI - PubMed
    1. Robert C, et al. Pembrolizumab versus ipilimumab in advanced melanoma (KEYNOTE-006): post-hoc 5-year results from an open-label, multicentre, randomised, controlled, phase 3 study. Lancet Oncol. 2019;20:1239–1251. doi: 10.1016/S1470-2045(19)30388-2. - DOI - PubMed
    1. Larkin J, et al. Five-year survival with combined nivolumab and ipilimumab in advanced melanoma. N. Engl. J. Med. 2019;381:1535–1546. doi: 10.1056/NEJMoa1910836. - DOI - PubMed
    1. Wolchok JD, et al. Long-term outcomes with nivolumab plus ipilimumab or nivolumab alone versus ipilimumab in patients with advanced melanoma. J. Clin. Oncol. 2022;40:127–137. doi: 10.1200/JCO.21.02229. - DOI - PMC - PubMed
    1. Weber J, et al. Adjuvant Nivolumab versus Ipilimumab in Resected Stage III or IV Melanoma. N. Engl. J. Med. 2017;377:1824–1835. doi: 10.1056/NEJMoa1709030. - DOI - PubMed

Publication types