. 2024 Feb 16;15(1):1452.
doi: 10.1038/s41467-024-45710-4.

A microfluidic platform integrating functional vascularized organoids-on-chip

Affiliations

A microfluidic platform integrating functional vascularized organoids-on-chip

Clément Quintard et al. Nat Commun. .

Abstract

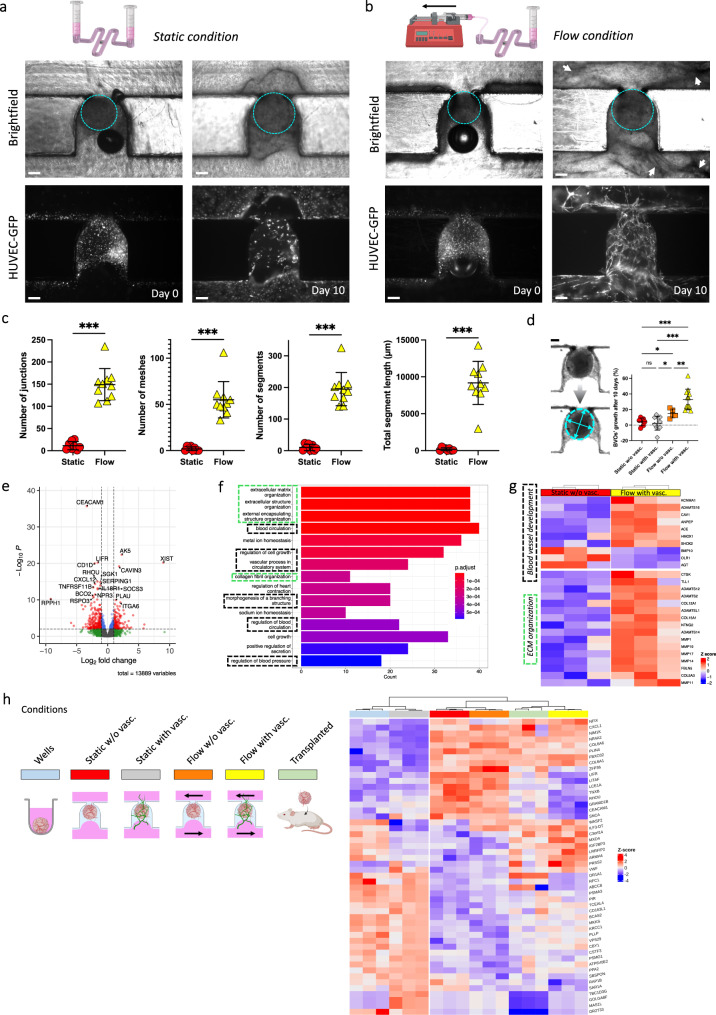
The development of vascular networks in microfluidic chips is crucial for the long-term culture of three-dimensional cell aggregates such as spheroids, organoids, tumoroids, or tissue explants. Despite rapid advancement in microvascular network systems and organoid technologies, vascularizing organoids-on-chips remains a challenge in tissue engineering. Most existing microfluidic devices poorly reflect the complexity of in vivo flows and require complex technical set-ups. Considering these constraints, we develop a platform to establish and monitor the formation of endothelial networks around mesenchymal and pancreatic islet spheroids, as well as blood vessel organoids generated from pluripotent stem cells, cultured for up to 30 days on-chip. We show that these networks establish functional connections with the endothelium-rich spheroids and vascular organoids, as they successfully provide intravascular perfusion to these structures. We find that organoid growth, maturation, and function are enhanced when cultured on-chip using our vascularization method. This microphysiological system represents a viable organ-on-chip model to vascularize diverse biological 3D tissues and sets the stage to establish organoid perfusions using advanced microfluidics.


Conflict of interest statement

C.Q., J.-L.A. and Y.F. are the authors of the patent application US20210277349A1 (granted) describing the method for microfluidic perfusion used in this study. J.M.P. declares a conflict of interest as he is one of the authors of the patent application US20200199541A1 relating to blood vessel organoids generation. Furthermore, J.M.P. is the founder, shareholder, and chairman of the scientific advisory board of Angios Biotech, a company establishing BVOs for drug testing and vascular transplants. The remaining authors declare no competing interests.

Figures

Fig. 1
Fig. 1. Device design and overview of organoid and cell configurations.
a Computer-aided design (top) and photographs (bottom) of the microfluidic chip displaying 10 microchannels, with each microchannel featuring a trapping site. b Top view of the microfluidic device. A syringe pump was connected to the outlet of the channel to introduce fluid perfusion. c Schematic diagram and photograph of the parallelization feature of our setup, showcasing 10 microchannels controlled simultaneously. d Photograph of the microfluidic chip and schematic three-dimensional view of the U-cup shaped area functioning as a trap. Here, the trap site is exemplarily occupied by a cell aggregate. e Schematic diagram showing an overview of the loading process. Initially, the hydrogel containing an organoid and HUVEC cells was introduced. Before polymerization of the hydrogel, air was introduced to position the hydrogel and the HUVEC cells. Finally, growth medium was introduced for continuous perfusion of the microfluidic chamber and the trapped organoid. f Schematic 3D and cross-sectional views of the microchannel showing the air loading process and associated hydrogel deposition. g Experimental cross-sectional view (left) of the microfluidic channel showing the hydrogel deposition in the trap and in the channel’s corners and 3D rendering (right), taken with an in-house light sheet fluorescence microscopy set-up. h Representative images of vascular spheroid/organoid cultured in fibrin (left), and hiPSC-derived lung organoids cultured in Matrigel, showing efficient trapping and robust growth over 2 weeks on-chip (right).
Fig. 2
Fig. 2. Generation of anastomosed endothelial networks through functional vascularization of mesenchymal spheroids.
a Mesenchymal spheroids cultured on-chip under static or flow conditions. Representative images are shown at day 7 after seeding. b Angiogenesis Analyzer output of the morphology of the endothelial networks after a week of culture on-chip (n = 10 (static) and 8 (flow)). c Confocal z-stack maximum intensity projection of the three-dimensional endothelial network. d Gel embedded RFP-HUVEC cells in the main channel are shown in red, GFP-HUVEC cells from the mesenchymal spheroids are shown in green. Note the formation of structured endothelial networks over time that appear to be stable until the end of the observation period (day 13 after seeding). In a close-up view, anastomosis between RFP-HUVEC and GFP-HUVEC cells are indicated by white arrows (inset). e Schematic drawing depicting the cell culture configuration, with anticipated open connections at the fibrin gel interface allowing for microbeads perfusion (created with BioRender.com). f Maximum of intensity projection over a 71 images stack, highlighting the tracks of the microbeads passing through the interconnected network. See Supplementary Movie 1 and Supplementary Fig. 5 for raw movies and details. g Sum of the binarized and frame-color coded images from (f) showing time-resolved beads perfusion. See Supplementary Movie 2 for details. h Projections of maximum intensity over an image stack showing tracking of one individual microbead (red) passing through the endothelial network. The inset shows an assembled projection of three movies taken at the indicated area at higher magnification. For better visualization, the RFP-HUVEC cells are not shown in these images. See Supplementary Movie 3 for raw data. i Summary of different flow parameters measured in our organ-on-chip device as compared to in vivo physiological flow rates in human capillaries. Data represent mean values ± s.d. Beads were 1 µm (f), 4.8 µm and 0.5 µm (h and inset) in diameter. Scale bars, 400 µm (d), 200 µm (f and g), 100 µm (a, c and h), 50 µm (d (inset)) and 20 µm (h (inset)). Data represents mean ± s.d. Statistical significance was attributed to values of P < 0.05 as determined by unpaired t test (two-tailed). ***P < 0.001. Source data are provided as a Source Data file.
Fig. 3
Fig. 3. Vascularization of Blood Vessel Organoids (BVOs) on-chip.
a Schematic of the protocol used for the differentiation of human pluripotent stem cells into blood vessel organoids. b Representative immunofluorescence of BVOs-on-chip, with capillary networks expressing CD31, the tight junction protein ZO-1, the adherens junction protein VE-cadherin, and covered by pericytes (PDGFRβ). c Cross-section of BVO-on-chip showing capillaries with hollow lumens and collagen type IV basal membrane coverage. d Initial and final cell culture configuration. e Vessel from the endothelial HUVEC network (stained for the endothelial marker CD31) with orthogonal views showing hollow lumen structures. f Time resolved evolution of the cell culture on chip. GFP-HUVEC cells self-organized from a single cell suspension, into an endothelial network surrounding the organoid. g Quantification of the endothelial networks using Angiogenesis Analyzer plugin, at different time points of the on-chip culture. hk Angiogenesis Analyzer outputs of the morphology of the endothelial networks regarding the total network length (e), the number of segments (f), the number of junctions (g) and the total isolated branches length (h) in imaged area from n = 5 independent microchannels denoted as Ci (where i ranges from 1 to 5). Scale bars, 200 µm (b, d, f, and g) and 20 µm (c, e).
Fig. 4
Fig. 4. Establishment of perfusable HUVEC endothelial networks encompassing blood vessel organoids.
a Imaris 3D rendering from confocal z-stacks of the endothelial network that has developed in the trapping site after 14 days of culture on-chip. b Confocal z-stack maximum intensity projection of the endothelial network at day 14 after staining of the microfluidic chip for CD31 expression and the nuclear marker Hoechst. Cyan dotted lines are used to provide the organoid’s location behind the network, determined through brightfield images. c Projection of maximum intensity over an image stack showing the tracking of one individual microbead (red) passing through the endothelial network (green). The inset shows the perfusion of several microbeads at higher magnification. See Supplementary Movie 4 for raw movies. d 3D representation from confocal z-stacks using clipping planes to reveal the presence of fluorescent microbeads located inside the lumen of a HUVEC vessel. e Angiogenesis Analyzer outputs of endothelial networks on-chip assessing the total network length evolution over a period of 30 days. Experiments were conducted on n = 4 independent microchannels denoted as Ci (where i ranges from 1 to 4). Scale bars, 400 µm, (e), 200 µm (ac), 50 µm (d) and 20 µm (d (inset)).
Fig. 5
Fig. 5. Assessment of functional anastomosis between a HUVEC endothelial bed and stem cell derived blood vessel organoids.
a Confocal z-stacks maximum intensity projection after staining of the microchannels for CD31 expression (red) and the nuclear marker Hoechst. The BVO vasculature corresponding to CD31+GFP- vessels is visible in the center of the trap. b Hierarchical structure of vascularized BVO-on-chip emulates the arteriole-capillary-venule transition as seen in vivo. Schematic representation below (created with BioRender.com). c Quantification of diameters for HUVEC vessels and BVOs vessels (n = 50 individual vessels were measured for each type). d Confocal z-stacks maximum intensity projection after staining for CD31 expression of the organoid cultures under flow conditions with and without HUVECs, and in wells. The organoid location is shown by the cyan dotted line. eg Anastomosis of GFP+ HUVEC vessels with iPS cell-derived blood vessels of the organoid (e). Imaris segmentation and distance mapping revealed direct contact between the two vasculatures (f and g). h Z-slice (150 µm deep) from a confocal z-stack showing the tracking of one individual microbead (yellow) passing through the BVO endothelium. Side panels show red, green and blue color channels separately. i, j Vascularized BVO imaged live (i) and stained (j) after overnight beads perfusion. Microbeads accumulation in the BVO’s vasculature is highlighted by a white arrow (j) and Imaris 3D rendering (j (inset)). k Projection of maximum intensity over an image stack showing tracking of microbeads (cyan) passing through the BVO’s vasculature (red). The perfusion direction is indicated by arrows and the image is an assembly from two movies taken at different z positions. See Supplementary Movie 5 for raw data. l Schematic diagram of the imaging setup (created with BioRender.com) and 3D rendering of a resulting confocal z-stack are shown. A close-up view of an individual microbead lodged deep within the BVO’s vasculature is presented, approximately 400 µm away from the bottom of the microfluidic chip. Beads were 2 µm (h) and 1 µm (j, k and l) in diameter. Scale bars, 200 µm (a, b and h), 100 µm (df and h (inset), i, k and l), 30 µm (f (inset) and g). Statistical significance was attributed to values of P < 0.05 as determined by unpaired t test (two-tailed). ***P < 0.001. Source data are provided as a Source Data file.
Fig. 6
Fig. 6. Organoids’ growth and maturation enhancement through flow and vascularization.
a, b BVO (brightfield, dotted cyan line) and HUVEC network (GFP) development from day 0 to day 10 on-chip, in static (a) and flow (b) conditions (diagrams created with BioRender.com). Enhanced ECM remodeling under flow conditions can be observed in the brightfield images at day 10, particularly by the presence of black structures surrounding the trap site, indicative of active cell processes (highlighted by white arrows). c Angiogenesis Analyzer outputs of the morphology of the endothelial networks between static and flow conditions after 10 days of culture on-chip (n = 8 (static) and 10 (flow)). d BVOs’ growth after 10 days of culture on-chip in various conditions, reported as a percentage increase in their size (average of minor and major axes from the fitted ellipse) compared to day 0 (n = 7 (static w/o vasc.), 11 (static with vasc.), 7 (flow w/o vasc.) and 12 (flow with vasc.)). e Volcano plot showing differentially expressed genes between conditions static w/o vasc. and flow with vasc. f Most enriched (top 15) Gene Ontology (GO) biological process terms resulting from the comparison between conditions static w/o vasc. and flow with vasc. g Heatmap of a selection of genes associated with ECM organization (dotted green boxes) and blood vessel development (dotted black boxes) pathways. The color-coded representation illustrates the expression patterns of key genes involved in these biological processes, enabling a visual comparison of their relative expression levels between conditions static w/o vasc. and flow with vasc. h Classification of BVO transcriptomes with a reference tissue simulated from single-cell RNA-seq data of BVOs matured in mice. Semi-supervised classification based on the Kruskal-Wallis test of genes significantly differentially expressed across all conditions, followed by visualization of the top 50 most significant genes (diagrams created with BioRender.com). Scale bars, 200 µm (a, b and d). Data represents mean ± s.d. Statistical significance was attributed to values of P < 0.05 as determined by unpaired t test (two-tailed). *P < 0.05 (P = 0.05 (static w/ vasc. vs flow w/o vasc.) and P = 0.03 (static with vasc. vs. flow w/o vasc.)), **P < 0.01 (P = 0.008), ***P < 0.001. Source data are provided as a Source Data file.
Fig. 7
Fig. 7. Pancreatic islet spheroids’ function enhancement through flow and vascularization.
a Generation of pre-vascularized pancreatic islet spheroids for on-chip culture within a HUVEC endothelial bed and under flow conditions (diagram created with BioRender.com). b Schematic diagram of glucose stimulation and collect of secretions performed on-chip (created with BioRender.com). c, d Comparison of the insulin secretions (c) and stimulation index = [high glucose solution]/[low glucose solution] (d) of the pancreatic islet spheroids between the various culture conditions. Each point on the graph represents the stimulation index of one pancreatic islet obtained from the measure of low and high glucose stimulation. Scale bar, 100 µm (a). Data represents mean ± s.d. Statistical significance was attributed to values of P < 0.05 as determined by unpaired t test (two-tailed). *P < 0.05 (P = 0.017 (static w/o vasc.), P = 0.029 (static with vasc.), P = 0.037 (flow without vasc.)), ***P < 0.001. Source data are provided as a Source Data file.

Similar articles

Cited by

References

    1. Auger FA, Gibot L, Lacroix D. The pivotal role of vascularization in tissue engineering. Annu. Rev. Biomed. Eng. 2013;15:177–200. doi: 10.1146/annurev-bioeng-071812-152428. - DOI - PubMed
    1. Mansour AA, et al. An in vivo model of functional and vascularized human brain organoids. Nat. Biotechnol. 2018;36:432–441. doi: 10.1038/nbt.4127. - DOI - PMC - PubMed
    1. Wimmer RA, et al. Human blood vessel organoids as a model of diabetic vasculopathy. Nature. 2019;565:505–510. doi: 10.1038/s41586-018-0858-8. - DOI - PMC - PubMed
    1. van den Berg CW, et al. Renal subcapsular transplantation of PSC-derived kidney organoids induces neo-vasculogenesis and significant glomerular and tubular maturation in vivo. Stem Cell Rep. 2018;10:751–765. doi: 10.1016/j.stemcr.2018.01.041. - DOI - PMC - PubMed
    1. Koning M, et al. Vasculogenesis in kidney organoids upon transplantation. Npj Regen. Med. 2022;7:1–16. doi: 10.1038/s41536-022-00237-4. - DOI - PMC - PubMed