. 2024 Feb 16;15(1):1446.
doi: 10.1038/s41467-024-45760-8.

PAF1c links S-phase progression to immune evasion and MYC function in pancreatic carcinoma

Affiliations

PAF1c links S-phase progression to immune evasion and MYC function in pancreatic carcinoma

Abdallah Gaballa et al. Nat Commun. .

Abstract

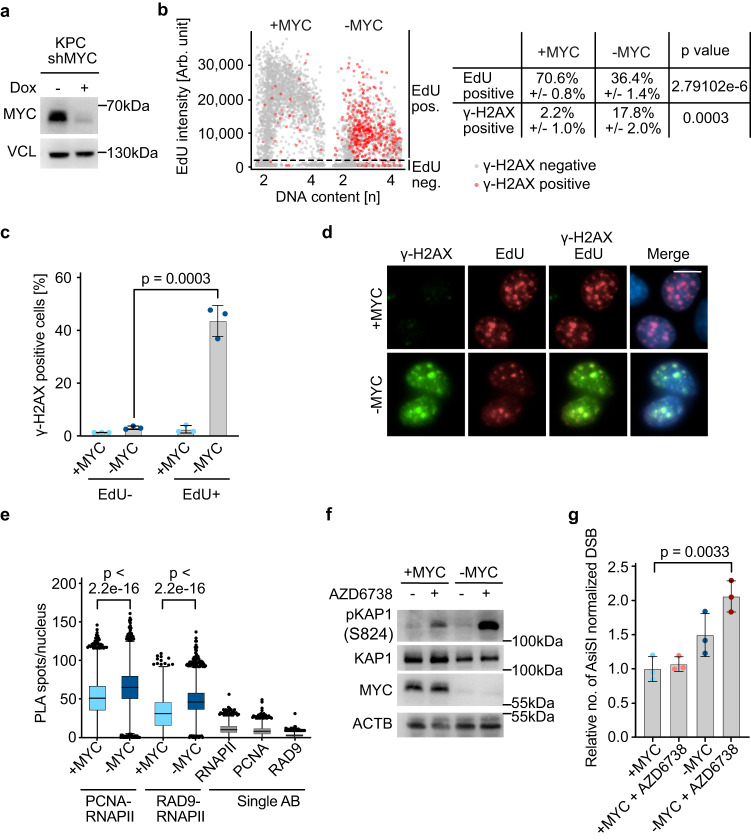
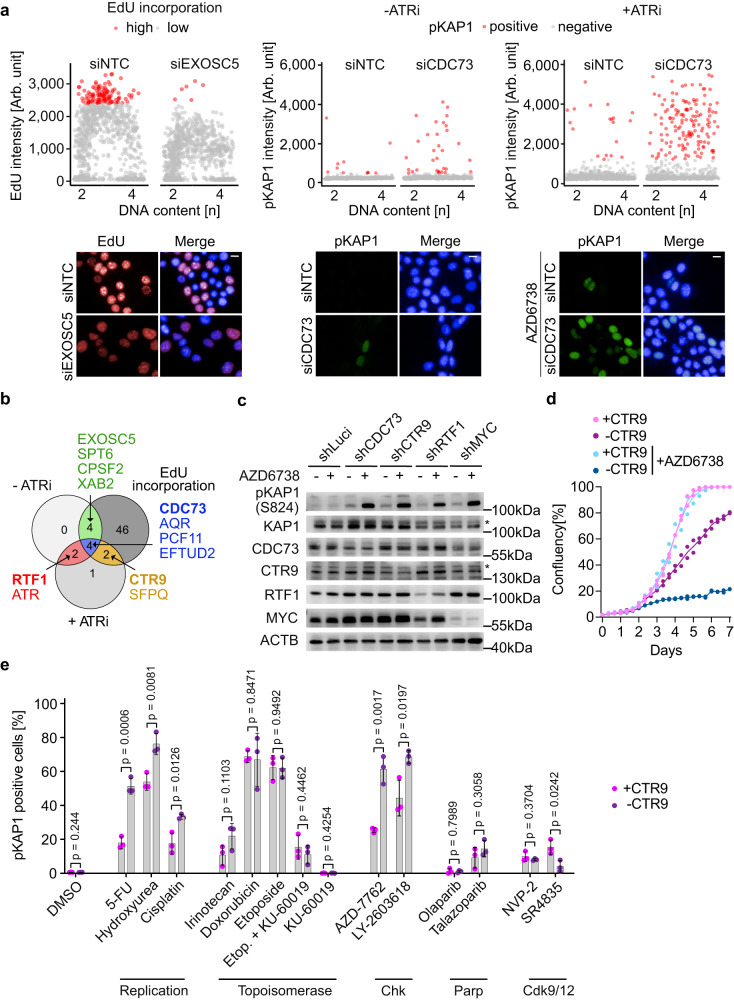
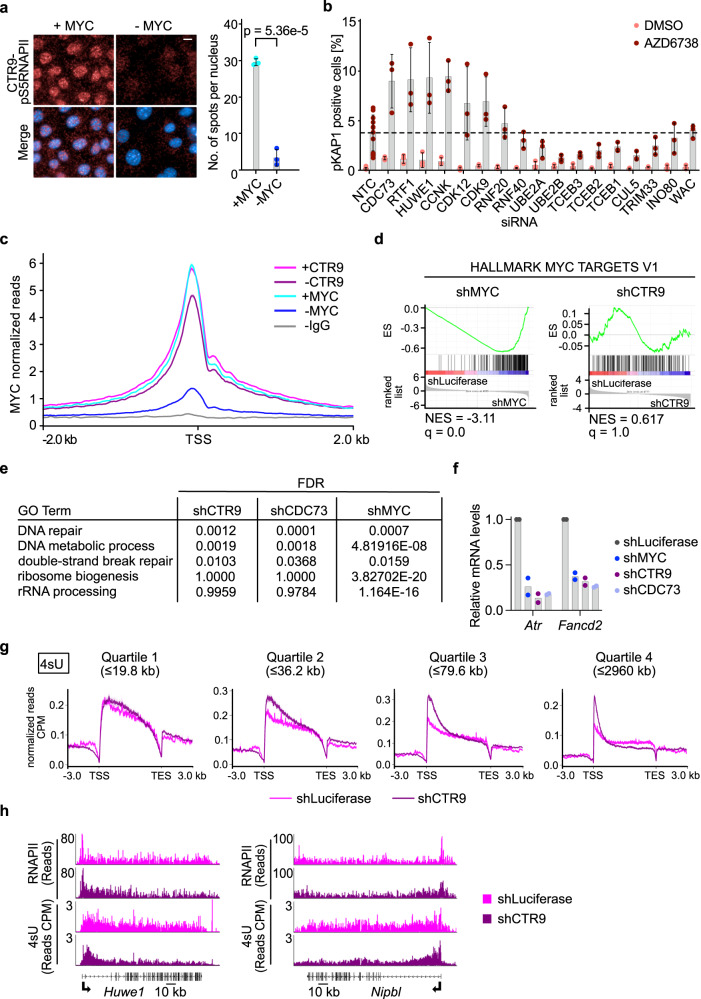
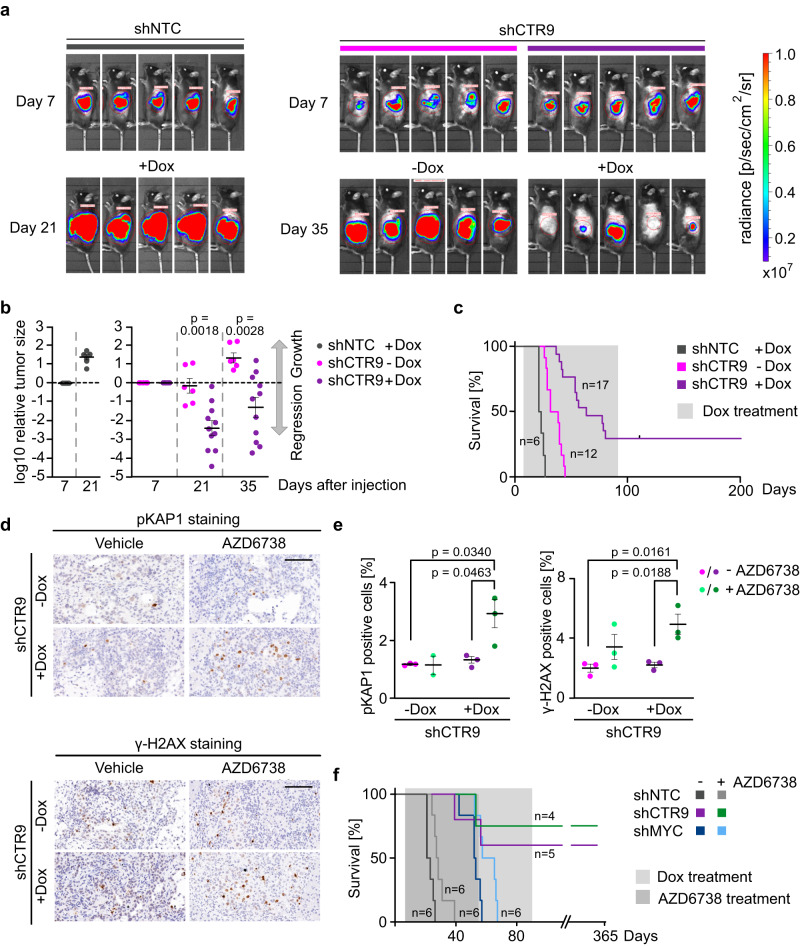
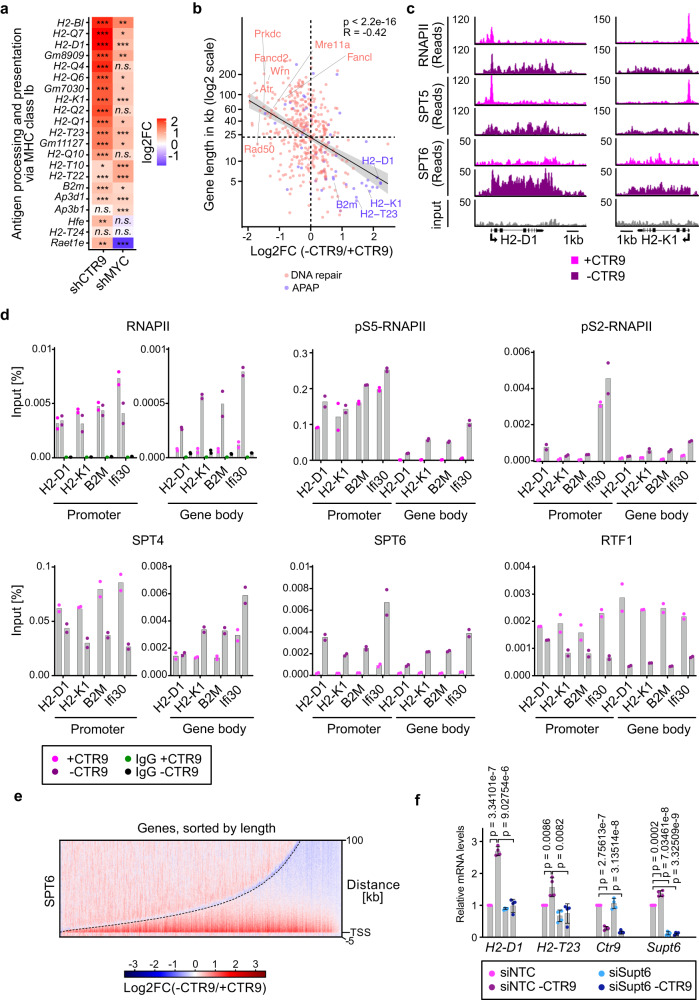
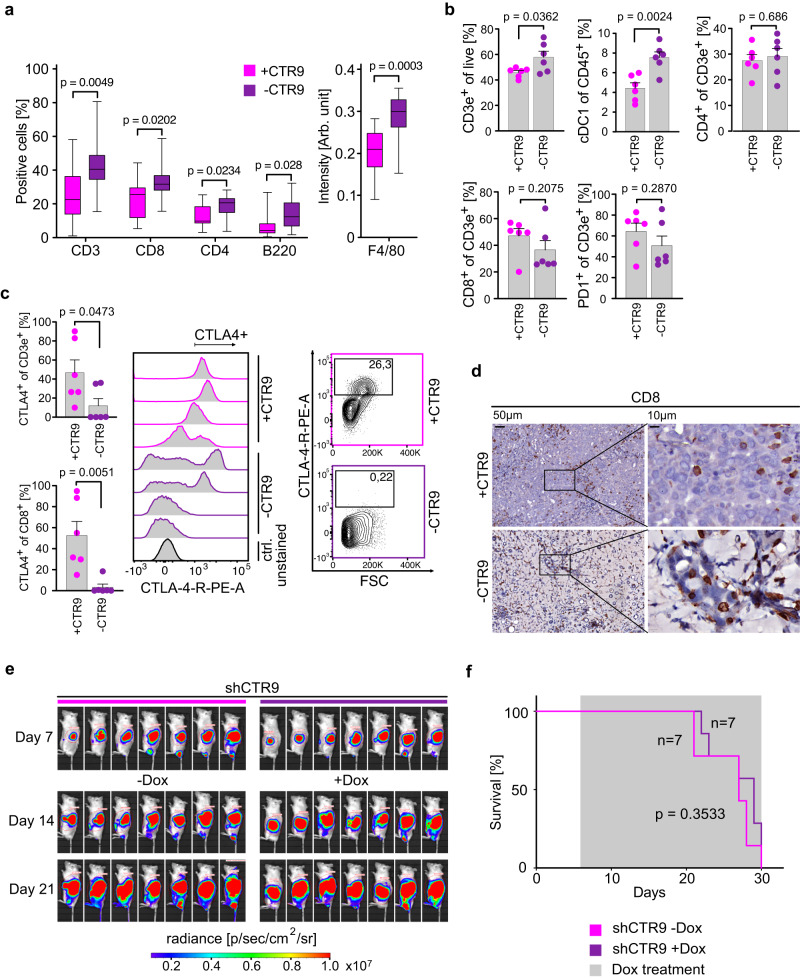
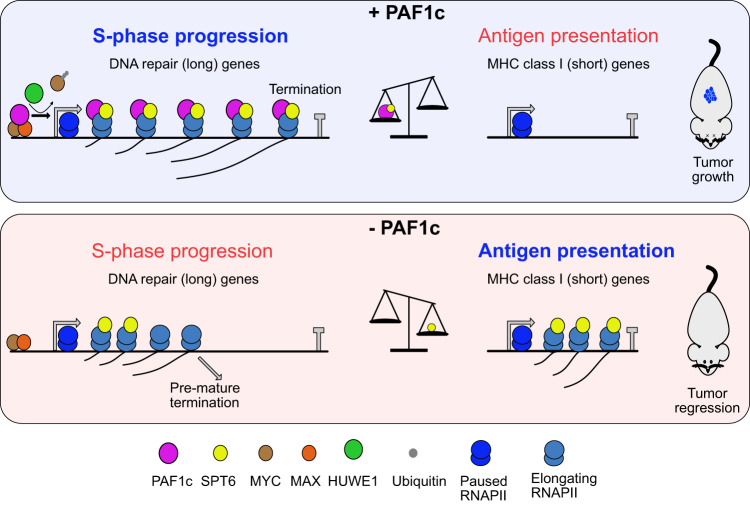
In pancreatic ductal adenocarcinoma (PDAC), endogenous MYC is required for S-phase progression and escape from immune surveillance. Here we show that MYC in PDAC cells is needed for the recruitment of the PAF1c transcription elongation complex to RNA polymerase and that depletion of CTR9, a PAF1c subunit, enables long-term survival of PDAC-bearing mice. PAF1c is largely dispensable for normal proliferation and regulation of MYC target genes. Instead, PAF1c limits DNA damage associated with S-phase progression by being essential for the expression of long genes involved in replication and DNA repair. Surprisingly, the survival benefit conferred by CTR9 depletion is not due to DNA damage, but to T-cell activation and restoration of immune surveillance. This is because CTR9 depletion releases RNA polymerase and elongation factors from the body of long genes and promotes the transcription of short genes, including MHC class I genes. The data argue that functionally distinct gene sets compete for elongation factors and directly link MYC-driven S-phase progression to tumor immune evasion.


Conflict of interest statement

M.E. is a founder and shareholder of Tucana Biosciences. The remaining authors declare no competing interests.

Figures

Fig. 1
Fig. 1. Endogenous MYC prevents transcription-replication conflicts in PDAC cells.
a Immunoblot showing MYC expression in KPC cells. Where indicated, doxycycline (1 µg/ml) was added for 48 h. Vinculin was loading control (n = 3; n is number of independent experiments unless otherwise stated). b Quantitative image-based cytometry showing DNA content (Hoechst) on the x-axis and EdU incorporation on the y-axis of cells carrying doxycycline-inducible shRNA targeting MYC. “-MYC” indicates samples in which MYC depletion was induced by doxycycline addition (1 µg/ml) for 48 h and “+MYC” ethanol-treated control samples. EdU was added 30 min before fixation. For each independent replicate, 1000 cells were randomly selected and shown in this plot (n = 3). The table on the right shows mean values, standard deviations, and P values (unpaired two-sided t-test). c Bar plot showing the percentage of γ-H2AX positive cells in EdU or EdU+ cells, derived from (b). Data are presented as mean ± s.d. (n = 3; unpaired two-sided t-test). d Representative immunofluorescence images used for the analysis shown in (b). The merged image includes all stains including Hoechst to mark nuclei. Scale bar: 10 µm. e Single-cell quantification of nuclear PLA foci between either PCNA or RAD9 and total RNAPII. The following total number of cells was examined over three independent experiments: +MYC: PCNA-RNAPII n = 7715; −MYC: PCNA-RNAPII n = 2794; +MYC: RAD9-RNAPII n = 4934; −MYC: RAD9-RNAPII n = 3768; two-tailed Mann–Whitney U-test). Single antibody controls are shown for the +MYC condition (number of cells analyzed in one experiment: RNAPII: n = 2451; PCNA: n = 3232; RAD9: n = 2767). In the box plot, the central line shows the median and the borders of the boxes extend from the 25th to the 75th percentile, and the whiskers were plotted using the Tukey method and outliers are shown as black dots. f Immunoblot of cells harboring doxycycline-inducible shRNA targeting MYC. MYC depletion was induced as in (a) and AZD6738 (0.3 µM) was added for 48 h. Beta-actin was loading control (n = 3). g Bar plot showing the relative number of AsiSI-normalized reads, quantifying double-strand breaks as determined by BLISS sequencing. Doxycycline was added for 48 h to deplete MYC and AZD6738 (2 µM) for 2 h was added where indicated. Data are presented as mean ± s.d. (n = 3; unpaired two-sided t-test). Source data are provided as a Source Data file.
Fig. 2
Fig. 2. PAF1c maintains genomic stability in PDAC cells.
a Quantitative image-based cytometry with DNA content (Hoechst) shown on the x-axis. Left: EdU intensity shown on the y-axis (number of cells plotted: siNTC: n = 1032, siEXOSC5:n = 1029). Middle: pKAP1(S824) intensity shown on the y-axis (number of cells plotted: siNTC: n = 1048; siCDC73: n = 833). Right: pKAP1(S824) intensity upon incubation with AZD6738 (0.1 µM; 24 h) (number of cells plotted: siNTC: n = 1654; siCDC73: n = 1175). For each parameter, one siRNA that scored as a hit is shown as an example. Representative images are shown at the bottom. Scale bar: 10 µm. siRNA transfection was 48 h and EdU was added 30 minutes before fixation (number of independent experiments n = 3, except for “+ ATRi”, n = 2). b Venn diagram showing the overlap between hits of different read-outs. Targets scoring in at least 2 of the 3 read-outs are shown. siRNAs with P < 0.05 (“+ATRi” P < 0.15) were considered as hits. c Immunoblot of cells harboring doxycycline-inducible shRNA targeting luciferase, components of the PAF1c and MYC. Depletion was induced by doxycycline addition for 72 h and AZD6738 treatment for 72 h at 0.2 µM concentration. * refers to a non-specific band. Beta-actin was loading control (n = 3). d Growth curve of cells harboring doxycycline-inducible shRNA targeting CTR9. “-CTR9” indicates that shRNA expression was induced by doxycycline (1 µg/ml), “+CTR9” samples were treated with ethanol. AZD6738 (0.5 µM) was added where indicated. Each data point represents an independent experiment (n = 2 independent experiments). e Bar plots showing percentage of pKAP1-positive cells. Where indicated, doxycycline (1 µg/ml) was added for 48 h. Cells were treated with indicated compounds for 24 h. Data are presented as mean ± s.d. (n = 3 independent experiments; unpaired two-sided t-test). Source data are provided as a Source Data file.
Fig. 3
Fig. 3. Characterization of PAF1c function in transcription elongation.
a (Left) Representative images of PLAs between CTR9 and pS5RNAPII in cells harboring doxycycline-inducible shRNA targeting MYC. Scale bar: 10 µm. (Right) Quantification of the nuclear PLA foci. Nuclei were stained with Hoechst. Data are presented as mean ± s.d. (n = 3 independent experiments; unpaired two-sided t-test). b Bar plot showing percentage of pKAP1-positive nuclei. siRNAs were transfected 48 h before fixation and AZD6738 (0.1 µM) was added for 24 h. Data are presented as mean ± s.d. (n = 3 independent biological replicate for all siRNAs except siNTC, n = 12). c Average density plot of MYC occupancy localized around the transcription start site (TSS) of all expressed (10920) genes analyzed by CUT&RUN (n = 2). “-CTR9/MYC” indicates samples where CTR9 or MYC depletion was induced by doxycycline (1 µg/ml) for 48 h in cells harboring doxycycline-inducible shRNA targeting CTR9, and “+CTR9/MYC” ethanol-treated cells. IgG was used as negative control. d GSEA enrichment plot of the gene set “HALLMARK MYC TARGETS V1” in cells expressing shRNA targeting luciferase versus either MYC (left) or CTR9 (right) (n = 3). e Table showing downregulated GO terms upon either CTR9, CDC73 or MYC depletion. Enrichr package in R was used for the GO term search and P values were calculated using Fisher’s exact test. False discovery rate (FDR) is calculated using the Benjamini–Höchberg procedure to adjust P values for multiple comparisons. f RT-qPCR measurement of Atr and Fancd2 mRNA levels upon depletion of either MYC, CTR9 or CDC73 relative to the control. Doxycycline addition was done for 48 h. Each data point represents an independent biological replicate (n = 2 biological replicates). g Metagene plots mapping nascent transcription marked by 4sU incorporation. Metagene plots show read density averaged over the gene bodies of all expressed genes stratified by increasing length from quartile 1 (shortest) to quartile 4 (longest), where each quartile contains 2091 or 2092 genes. Only intronic 4sU-seq reads were considered (n = 3). h Browser picture showing read distribution of RNAPII ChIP-sequencing (top) and 4sU- sequencing showing nascent transcription (bottom) at two long DNA repair (GO-0006281) genes (n = 2, for the RNAPII-ChIP-sequencing. n = 3, for the 4sU-sequencing experiment). Source data are provided as a Source Data file.
Fig. 4
Fig. 4. CTR9 is required for PDAC growth.
a Luciferase imaging of KPC-cell–derived tumors expressing NTC (non-targeting control) shRNA or shRNA against CTR9 upon orthotopic transplantation into C57BL/6 J mice. Doxycycline treatment was started 7 days after transplantation. Luciferase activity is shown at day 7 after transplantation and after 2 or 4 weeks of doxycycline treatment. b Change of tumor size of KPC tumors expressing doxycycline-inducible shNTC (left) or shCTR9 (right) relative to the start of doxycycline treatment on day 7. The plot shows the log10 of the ratio of luciferase activity at the indicated times relative to day 7. Results are presented as mean ± S.E.M. P values were calculated using the unpaired two-sided t-test. n = 6 mice for shNTC+Dox and shCTR9-Dox, while n = 11 mice for shCTR9+Dox. c Kaplan–Meier plot of mice transplanted with KPC cells expressing doxycycline-inducible shCTR9 or shNTC. Doxycycline was added to the food for 12 weeks as indicated. d Immunohistochemistry of pancreatic tumors expressing shRNA against CTR9. Mice were treated for 3 days with or without doxycycline and AZD6738 or vehicle. Sections were stained with anti-pKAP1 and anti-γ-H2AX antibodies. Scale bar: 100 µm. e Percentage of pKAP1 or γ-H2AX positive cells present in the tumor tissue. Positive cells were counted after 3 days of CTR9 depletion and AZD6738 treatment. Results are presented as mean ± S.E.M. Each dot represents an independent tumor and P values were calculated using the unpaired two-sided t-test. n = 3 independent tumors except for pKAP1 staining of AZD6738 treated mice, n = 2. f Kaplan–Meier plot of mice transplanted with KPC cells expressing doxycycline-inducible shCTR9, shMYC or shNTC. Expression of shRNAs was induced with doxycycline from day 7 for 12 weeks in all mice. Mice were treated with AZD6738 or vehicle from day 7 for 7 weeks. Source data are provided as a Source Data file.
Fig. 5
Fig. 5. PAF1c sequesters SPT6 on long genes.
a Heat map showing log2FC of change in expression of genes involved in antigen processing and presentation via MHC class I molecules (GO-0002475) upon the depletion of either CTR9 or MYC (n = 3). P values were calculated using the likelihood ratio test (LRT), then False discovery rate (FDR) was calculated using the Benjamini–Höchberg procedure to adjust P values for multiple comparisons. The FDRs were: *p ≤ 0.05, **p ≤ 0.001, ***p ≤ 0.0001, n.s. not significant. b Scatter plot of gene length versus log2 fold-changes in gene expression upon CTR9 depletion, comparing expressed genes of the GO term DNA repair (GO-0006281, n = 375 genes) in red with antigen processing and presentation genes (APAP, GO-0019882, n = 56 genes) in blue (Pearson correlation coefficient (R) = −0.42, p < 2.2e-16, two-sided pearson correlation test). c Browser picture showing read distribution of RNAPII (top), SPT5 (middle) and SPT6 (bottom) at H2-K1 and H2-D1 genes from a ChIP-Rx experiment in cells expressing doxycycline-inducible shRNA targeting CTR9 (n = 2). “-CTR9” indicates that shRNA expression was induced by doxycycline (1 µg/ml), “+CTR9” samples were treated with ethanol. d ChIP-qPCR showing RNAPII, pS5RNAPII, pS2RNAPII, SPT4, SPT6 or RTF1 binding to the indicated genes either at the promoter or in the gene body. IgG was used as a negative control to show the background signal. Data are presented as mean of two technical replicates of one of two biological replicates with similar results (n = 2). e Heat map of the log2FC of SPT6 occupancy for all expressed (10,920) genes analyzed by ChIP-Rx comparing CTR9 depletion to the control. Genes are sorted according to their length from shortest (left) to longest (right). The black dashed line represents the end of the gene (n = 2). f RT-qPCR measurement of H2-D1 and H2-T23 MHC class I genes, CTR9 and Supt6 (encoding SPT6). KPC cells expressing doxycycline inducible shRNA targeting CTR9 were used. Both siRNA transfection and doxycycline addition were for 48 h. Data are presented as mean ± s.d. (n = 4 independent experiments; unpaired two-sided t-test). Source data are provided as a Source Data file.
Fig. 6
Fig. 6. CTR9 is required for immune evasion in PDAC.
a Box plots showing the percentage of the indicated cells (left), or intensity of DAB (diaminobenzidine) staining (right) in tumor tissue. Mice carrying tumors expressing doxycycline-inducible shRNA against Ctr9 were treated for three days with doxycycline or control. For each plot, 4–6 regions per tumor were evaluated from three independent tumors, n = 14 regions analyzed. P values were calculated using unpaired two-tailed t-test using Welch’s correction. In the box plot, the central line shows the median, the box borders extend from the 25th to the 75th percentile, and the whiskers go down to the smallest value and up to the largest. b Bar plots showing flow cytometry analysis of immune cell subsets in the tissues of tumors initiated by orthotopic transplantation of KPC cells harboring doxycycline-inducible shNTC or shCTR9. After 7 days of transplantation, doxycycline treatment was added for 3 days. Pre-gating was performed using single living cells. cDC1 cells were defined as (CD45+, CD11b, CD11c+). Data are presented as mean ± s.d. (n = 6 independent tumors; unpaired two-sided t-test). c Left, bar plots showing the percentage of CTLA4+ T-cells of CD3e+ or CD8+ cells, data are presented as mean ± s.d. (n = 6 independent tumors; unpaired two-sided t-test). Middle, histograms showing staining of CTLA4 on T-cells (CD3e+), with intensity on the x-axis, and counts on the y-axis. Right, flow cytometry contour plot, documenting the gating strategy for CTLA4+ T-cells (CD3e+). d Representative immunohistochemistry images of tumor sections stained for CD8 (brown) with two different magnifications. Note the juxtaposition of CD8-positive T-cells with the remaining tumor cells. “-CTR9” refers to three days of doxycycline treatment. e Luciferase imaging of KPC cell derived tumors harboring shRNA against Ctr9 upon orthotopic transplantation into NRG mice. Doxycycline treatment was started 7 days after transplantation. Luciferase activity of KPC cells was measured at day 7 after transplantation (start) and after 1 and 2 weeks of doxycycline treatment. f Kaplan–Meier plot of NRG mice transplanted with KPC cells expressing doxycycline-inducible shCTR9. shRNA was induced with doxycycline from day 7. P values were calculated using two-sided Mantel–Cox test. Source data are provided as a Source Data file.
Fig. 7
Fig. 7. Model summarizing our findings.
Model summarizing our findings. We propose that PAF1c acts downstream of MYC to enhance full-length transcription of long DNA repair genes while limiting the expression of short MHC class I genes. Interference with PAF1c function results in the redistribution of transcription elongation factors, including SPT6. This restores expression of short MHC class I genes and impairs the full-length transcription of long DNA repair genes. This change reshapes the tumor microenvironment, causing immune cell-dependent tumor regression and enabling long-term survival of PDAC-bearing mice.

References

    1. Bailey P, et al. Genomic analyses identify molecular subtypes of pancreatic cancer. Nature. 2016;531:47–52. doi: 10.1038/nature16965. - DOI - PubMed
    1. Maddipati R, et al. MYC Levels Regulate Metastatic Heterogeneity in Pancreatic Adenocarcinoma. Cancer Discov. 2022;12:542–561. doi: 10.1158/2159-8290.CD-20-1826. - DOI - PMC - PubMed
    1. Loevenich LP, et al. SMAD4 Loss Induces c-MYC-Mediated NLE1 Upregulation to Support Protein Biosynthesis, Colorectal Cancer Growth, and Metastasis. Cancer research. 2022;82:4604–4623. doi: 10.1158/0008-5472.CAN-22-1247. - DOI - PMC - PubMed
    1. Porter JR, et al. Global Inhibition with Specific Activation: How p53 and MYC Redistribute the Transcriptome in the DNA Double-Strand Break Response. Molecular Cell. 2017;67:1013. doi: 10.1016/j.molcel.2017.07.028. - DOI - PMC - PubMed
    1. Hingorani SR, et al. Trp53R172H and KrasG12D cooperate to promote chromosomal instability and widely metastatic pancreatic ductal adenocarcinoma in mice. Cancer cell. 2005;7:469–483. doi: 10.1016/j.ccr.2005.04.023. - DOI - PubMed

Substances