. 2024 Feb 16;14(1):3891.
doi: 10.1038/s41598-023-49145-7.

Quantum measurement enables single biomarker sensitivity in flow cytometry

Affiliations

Quantum measurement enables single biomarker sensitivity in flow cytometry

J Sabines-Chesterking et al. Sci Rep. .

Abstract

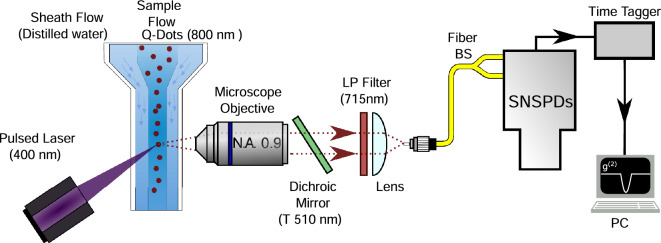
We present the first unambiguous experimental method enabling single-fluorophore sensitivity in a flow cytometer using quantum properties of single-photon emitters. We use a quantum measurement based on the second-order coherence function to prove that the optical signal is produced by individual biomarkers traversing the interrogation volume of the flow cytometer from the first principles. This observation enables the use of the quantum toolbox for rapid detection, enumeration, and sorting of single fluorophores in large cell populations as well as a 'photons-to-moles' calibration of this measurement modality.


Conflict of interest statement

The authors declare no competing interests.

Figures

Figure 1
Figure 1
Experimental setup. Two syringe pushers independently control the sample flow with quantum dots (QD) and the sheath flow (distilled water) through a 0.25×0.25 mm flow channel. Picosecond pulses at 405 nm with a repetition rate of 76 MHz excite quantum dots in the flow channel. Quantum dots fluoresce at 800 nm. An objective with 0.9 numerical aperture (NA) collects fluorescent light orthogonally to both the direction of the flow and the pump laser beam. After filtering by a dichroic mirror (low pass at 510 nm) and a thin film filter (low pass at 715 nm), fluorescent photons are coupled into a single-mode fiber. A 50:50 fiber beam splitter sends the output from the flow cell to two superconducting nanowire single-photon detectors (SNSPD). A time tagger and a PC record and store photon arrival times for statistical processing.
Figure 2
Figure 2
Photon number distributions (n) for high and low concentration measurements obtained using 1 ms and 10 ms time bins as labeled. Solid lines show Poisson fits of the photon number distributions.
Figure 3
Figure 3
Second-order coherence function at zero time delay g(2)(0) as a function of the number of photons per time bin filter cut-off ncut-off. (a) Low concentration sample. (b) High concentration sample. Error bars are statistical uncertainties calculated as the normalized square root of number of measured coincidences. A temporal filter is set to discard photons detected with delays greater than 2.5 ns. Thin dashed lines—guides for an eye that connect experimentally obtained data points. Solid lines—g(2)(0) values from the model, see text.
Figure 4
Figure 4
Temporal dependence of fluorescence and its use for filtering of the experimental data. Solid plot markers: The experimental values of g(2)(0) in the interval that begins at the beginning of the shaded region (0.65 ns) and ends at the time indicated by the x axis with a PCR cut-off set to 4 photons/bin. Dashed lines: guides for an eye connecting experimental points obtained for different concentrations and time bin sizes. Shaded region: temporal filtering of τ2.6 ns used throughout the manuscript. Error bars are statistical uncertainties calculated as the normalized square root of number of measured coincidences and shown only for the points used in the manuscript. Large blue dot marks the lowest value of the second-order correlation function observed with a temporal window of 4.6 ns. Red solid line: observed fluorescence signal temporal profile (normalized by the maximum value).

References

    1. Shapiro HM. Practical Flow Cytometry. Wiley; 2005.
    1. Campana D, Coustan-Smith E. Detection of minimal residual disease in acute leukemia by flow cytometry. Cytometry J. Int. Soc. Analyt. Cytol. 1999;38:139. - PubMed
    1. Craig FE, Foon KA. Flow cytometric immunophenotyping for hematologic neoplasms. Blood J. Am. Soc. Hematol. 2008;111:3941. - PubMed
    1. Van Dongen J, Lhermitte L, Böttcher S, Almeida J, Van Der Velden V, Flores-Montero J, Rawstron A, Asnafi V, Lecrevisse Q, Lucio P, et al. Euroflow antibody panels for standardized n-dimensional flow cytometric immunophenotyping of normal, reactive and malignant leukocytes. Leukemia. 2012;26:1908. doi: 10.1038/leu.2012.120. - DOI - PMC - PubMed
    1. Ding M, Kaspersson K, Murray D, Bardelle C. High-throughput flow cytometry for drug discovery: Principles, applications, and case studies. Drug Discov. Today. 2017;22:1844. doi: 10.1016/j.drudis.2017.09.005. - DOI - PubMed

Substances